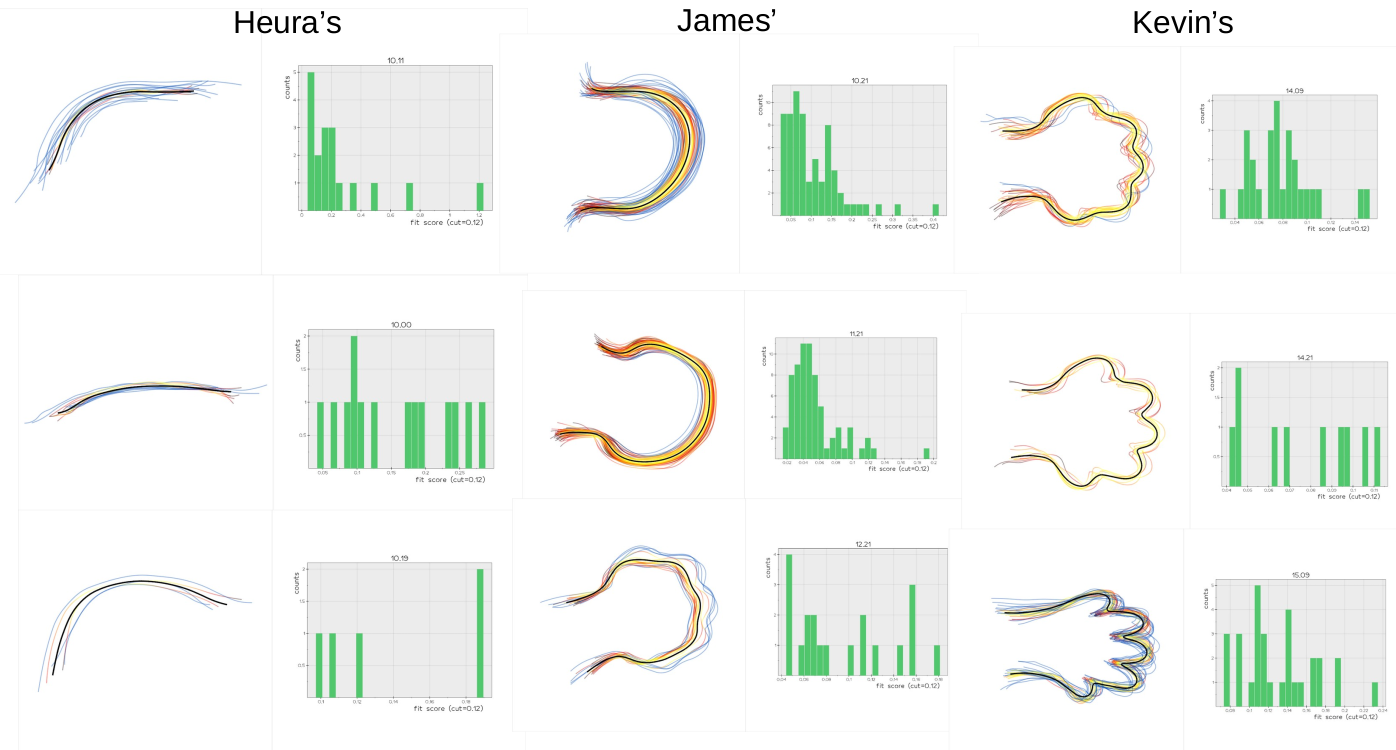
Given an experimental set of 2D lines + time, compute the average shapes for each of the time points and extrapolate the shapes at intermediate time points.
- Align each group using rigid procrustes alignment (PA). BUT: PA allows for improper rotations (subsample mirroring) so we keep the Left/Right samples separate this would also serve as control
-
Apply Iterative Closest Point, using PA output as baseline
-
Extract mean outlines:
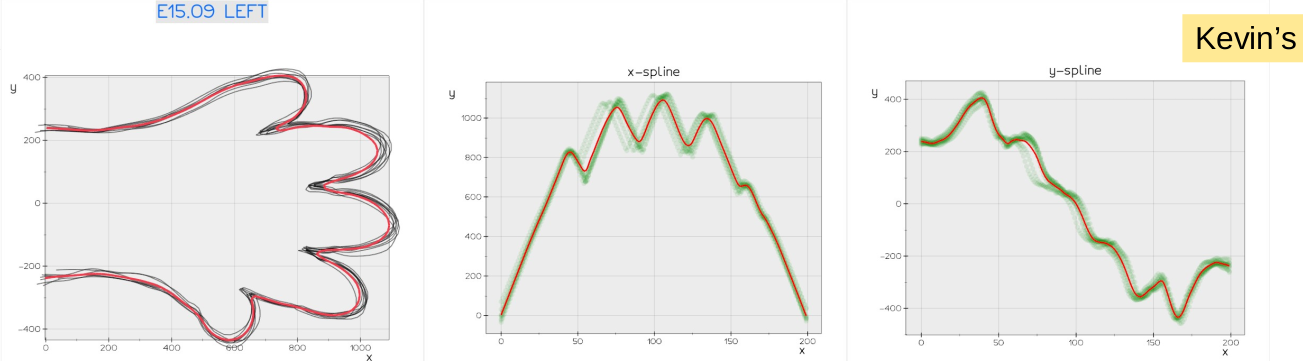
- Refit the whole experimental sample
-
python stages_builder.pycreates the averages as described above -
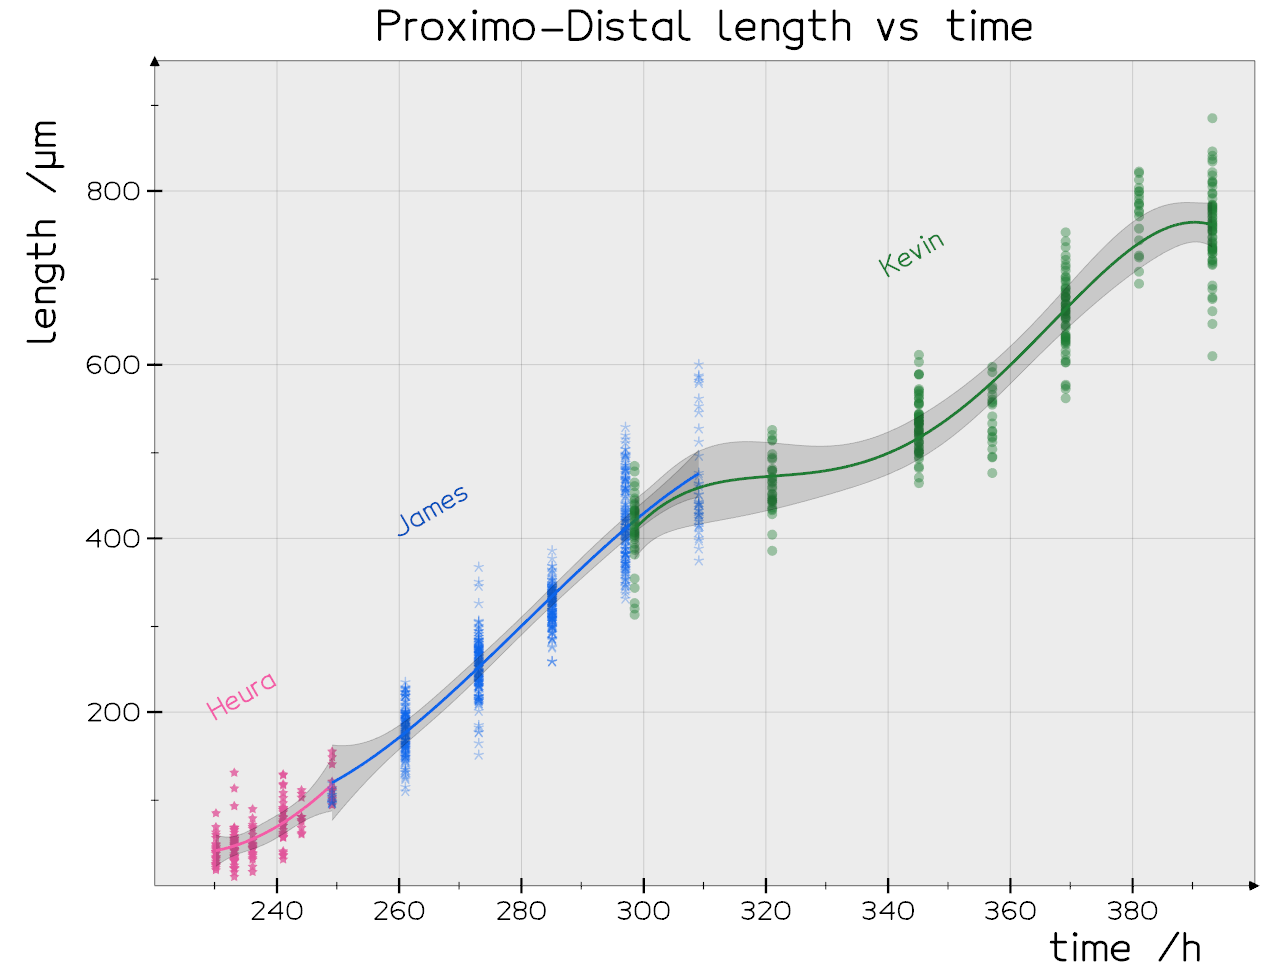
python compareSizes.pyplots the resulting growth of the limb for the 3 datasets as a function of time:
python stages_fitter.pycreates the animation at the header of this page.