The votevizr package helps you make diagrams to better understand
election results in ordinal voting systems, a class that includes
- positional
methods, including
- plurality
- Borda count
- anti-plurality
- Condorcet methods, with many ways of resolving cycles
- ranked-choice voting (aka RCV, instant-runoff voting/IRV, alternative vote/AV, single-winner STV, preferential voting)
votevizr implements the methods I develop in this
paper published in Social
Choice and Welfare. The paper
explains the figures in detail and discusses previous attempts to
represent election results in ternary diagrams.
To install from GitHub:
devtools::install_github("aeggers/votevizr")The package includes two datasets, brexit_prefs and sf_result. Each
dataset is just a named list containing frequencies for each preference
ordering over three alternatives.
We load the Brexit poll results:
library(votevizr)
#> Loading required package: magrittr
data(brexit_prefs)
brexit_prefs
#> $`Remain > Deal > No deal`
#> [1] 0.375
#>
#> $`No deal > Deal > Remain`
#> [1] 0.228
#>
#> $`Deal > No deal > Remain`
#> [1] 0.212
#>
#> $`Remain > No deal > Deal`
#> [1] 0.087
#>
#> $`Deal > Remain > No deal`
#> [1] 0.059
#>
#> $`No deal > Remain > Deal`
#> [1] 0.038
Now we make some figures. Let’s start with plurality:
brexit_prefs %>%
  qplot_votevizr(split = " > ", method = "plurality")
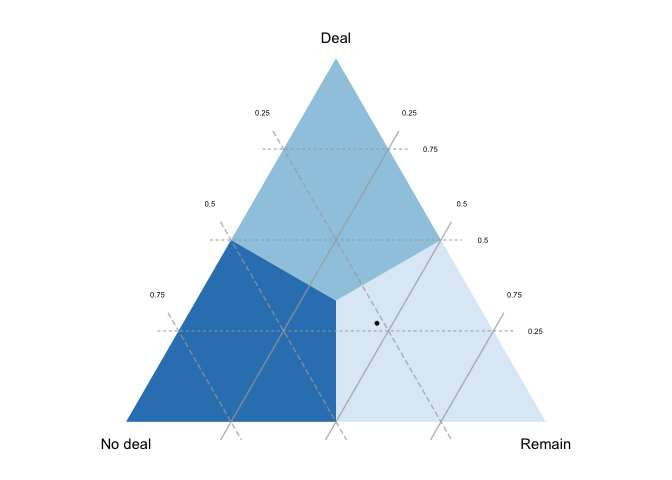
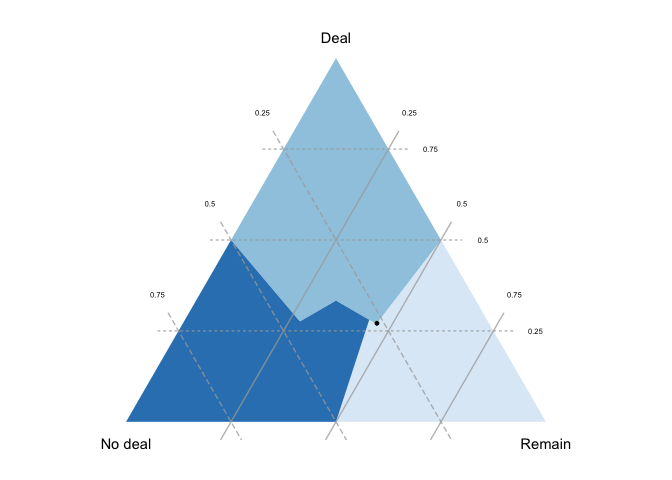
Each vertex of the triangle represents an election result where one alternative is ranked first by all voters; the closer you get to a vertex, the larger that alternative’s share of first preferences (i.e. top rankings). The black dot represents the actual result: “Remain” was ranked first most often (on just under 50% of ballots), while “Deal” and “No deal” were each ranked first on just over 25% of ballots.
Each colored region identifies the first-preference results where a given candidate would win. In plurality the outcome depends only on first preferences, so these regions are symmetrical.
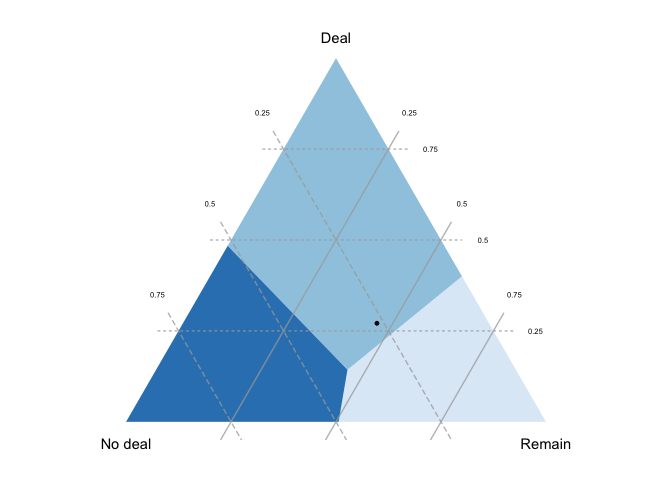
If we move to Borda count, the first-preference win regions become asymmetrical:
brexit_prefs %>%
  qplot_votevizr(split = " > ", method = "Borda")
This is because (unlike plurality) Borda count gives points for being ranked second, and “Deal” was ranked second on most ballots; given this pattern of lower preferences, “Deal” would win a Borda count election even if it was well below a plurality of first-preference votes.
Note that the figure assumes the pattern of second preferences (lower rankings) is fixed: as we move away from the dot, we see what would have happened if e.g. “Remain” had won more first-preference votes but the proportion of “Remain” voters listing “Deal” second (vs. “No deal”) was held fixed.
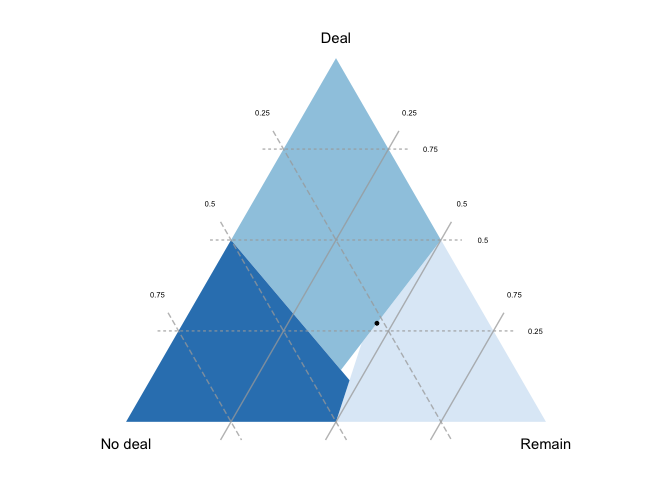
With Condorcet methods, the winner is determined by checking each pair of candidates: a candidate who is ranked higher than each other candidate by a majority is the winner. In the Brexit case, we essentially have a tie between “Remain” and “Deal”:
brexit_prefs %>%
  qplot_votevizr(split = " > ", method = "Condorcet")
Note that there is an area with no winner: this is where a Condorcet
cycle takes place,
with “Remain” beating “Deal”, “Deal beating”No deal“, and”No deal"
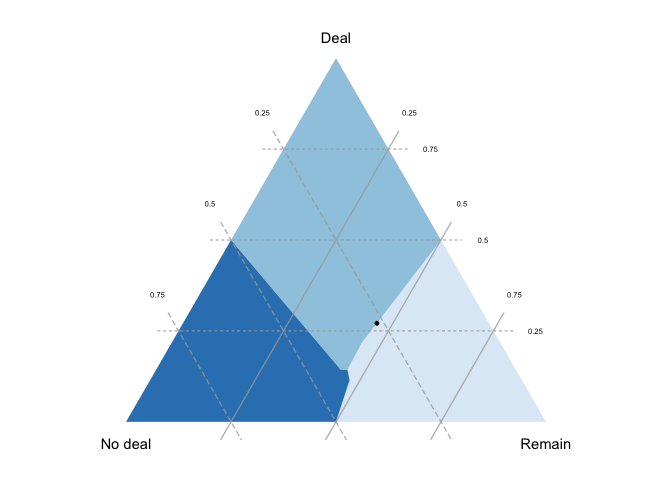
beating “Remain”. votevizr allows several ways of resolving such a
cycle. Here is the Kemeny-Young method:
brexit_prefs %>%
  qplot_votevizr(split = " > ", method = "Condorcet", if_cycle = "kemeny")
Finally we have ranked-choice voting:
brexit_prefs %>%
qplot_votevizr(split = " > ", method = "RCV")vignette("votevizr_overview") gives a more detailed overview of the
package focusing on the qplot_votevizr() method.
vignette("under_the_hood") shows what is happening “under the hood”,
which is useful if you want more plotting flexibilty than
qplot_votevizr() provides.
