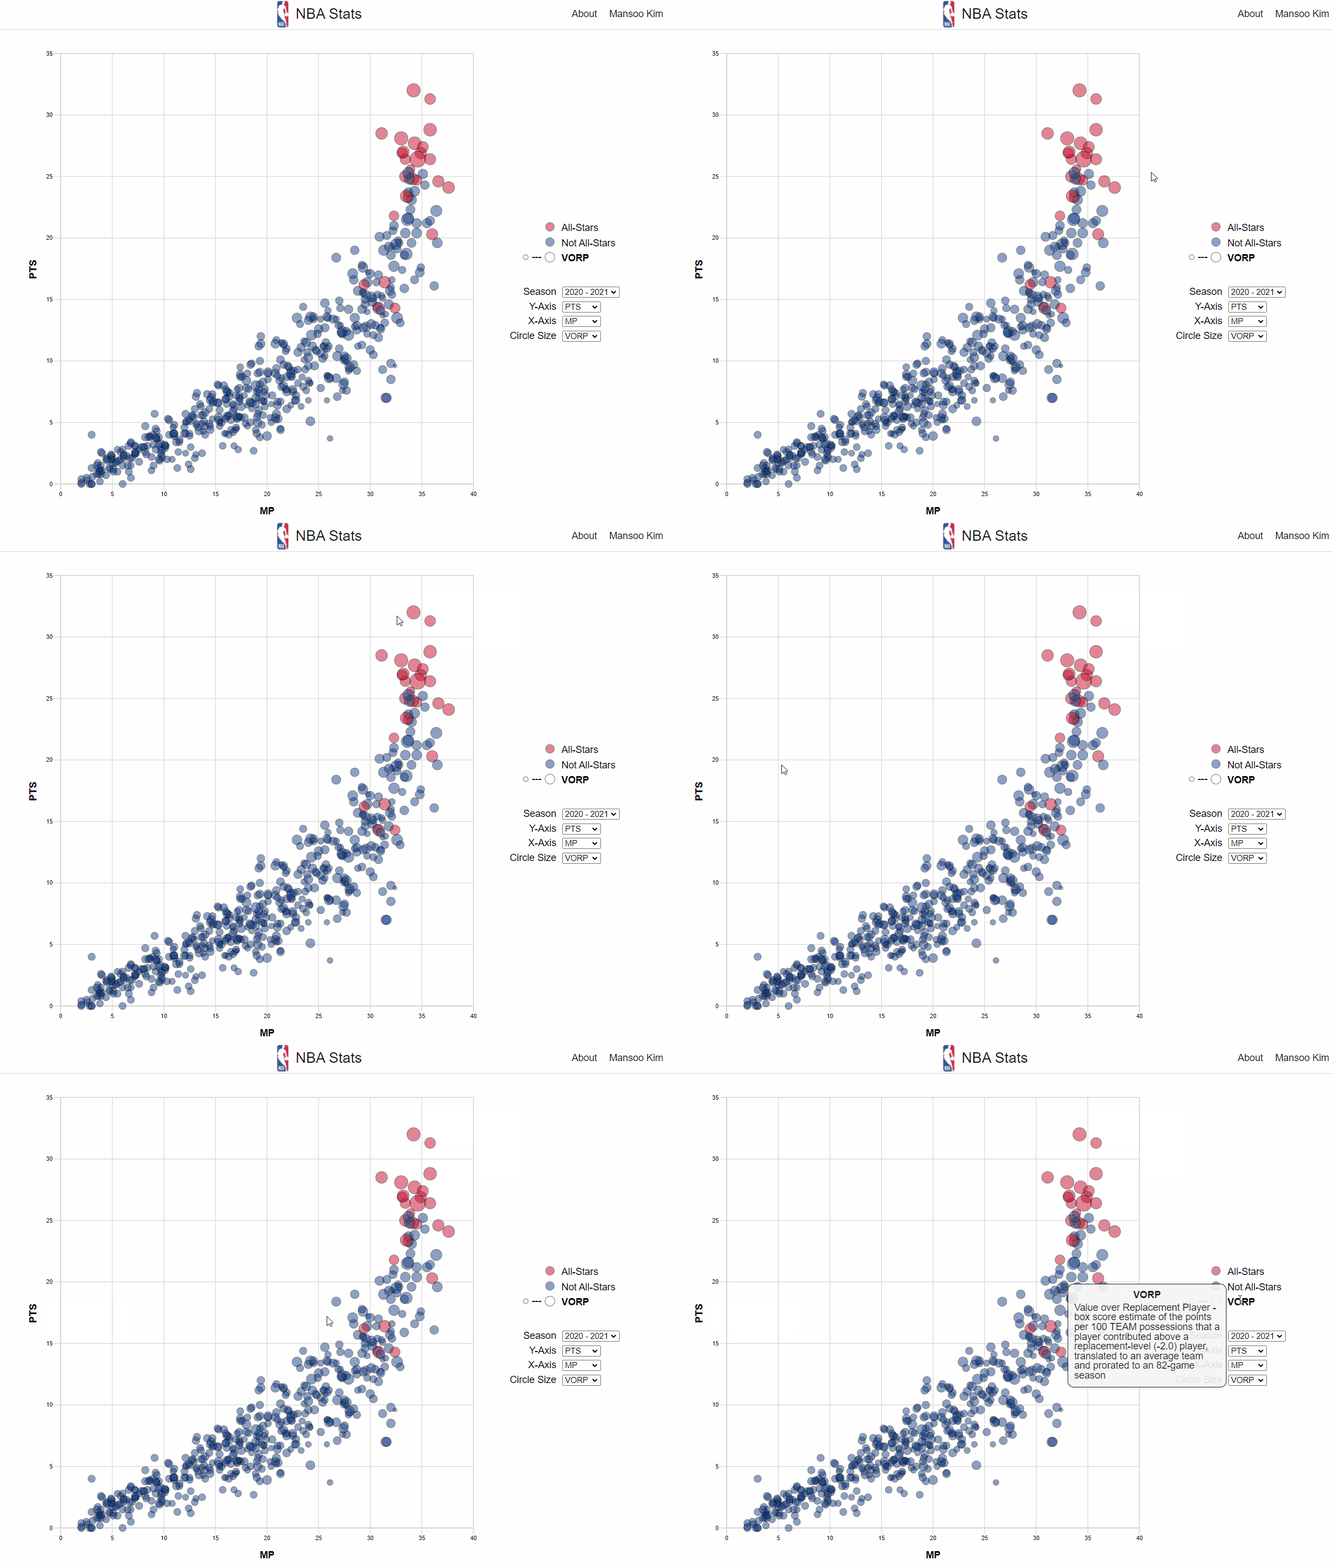
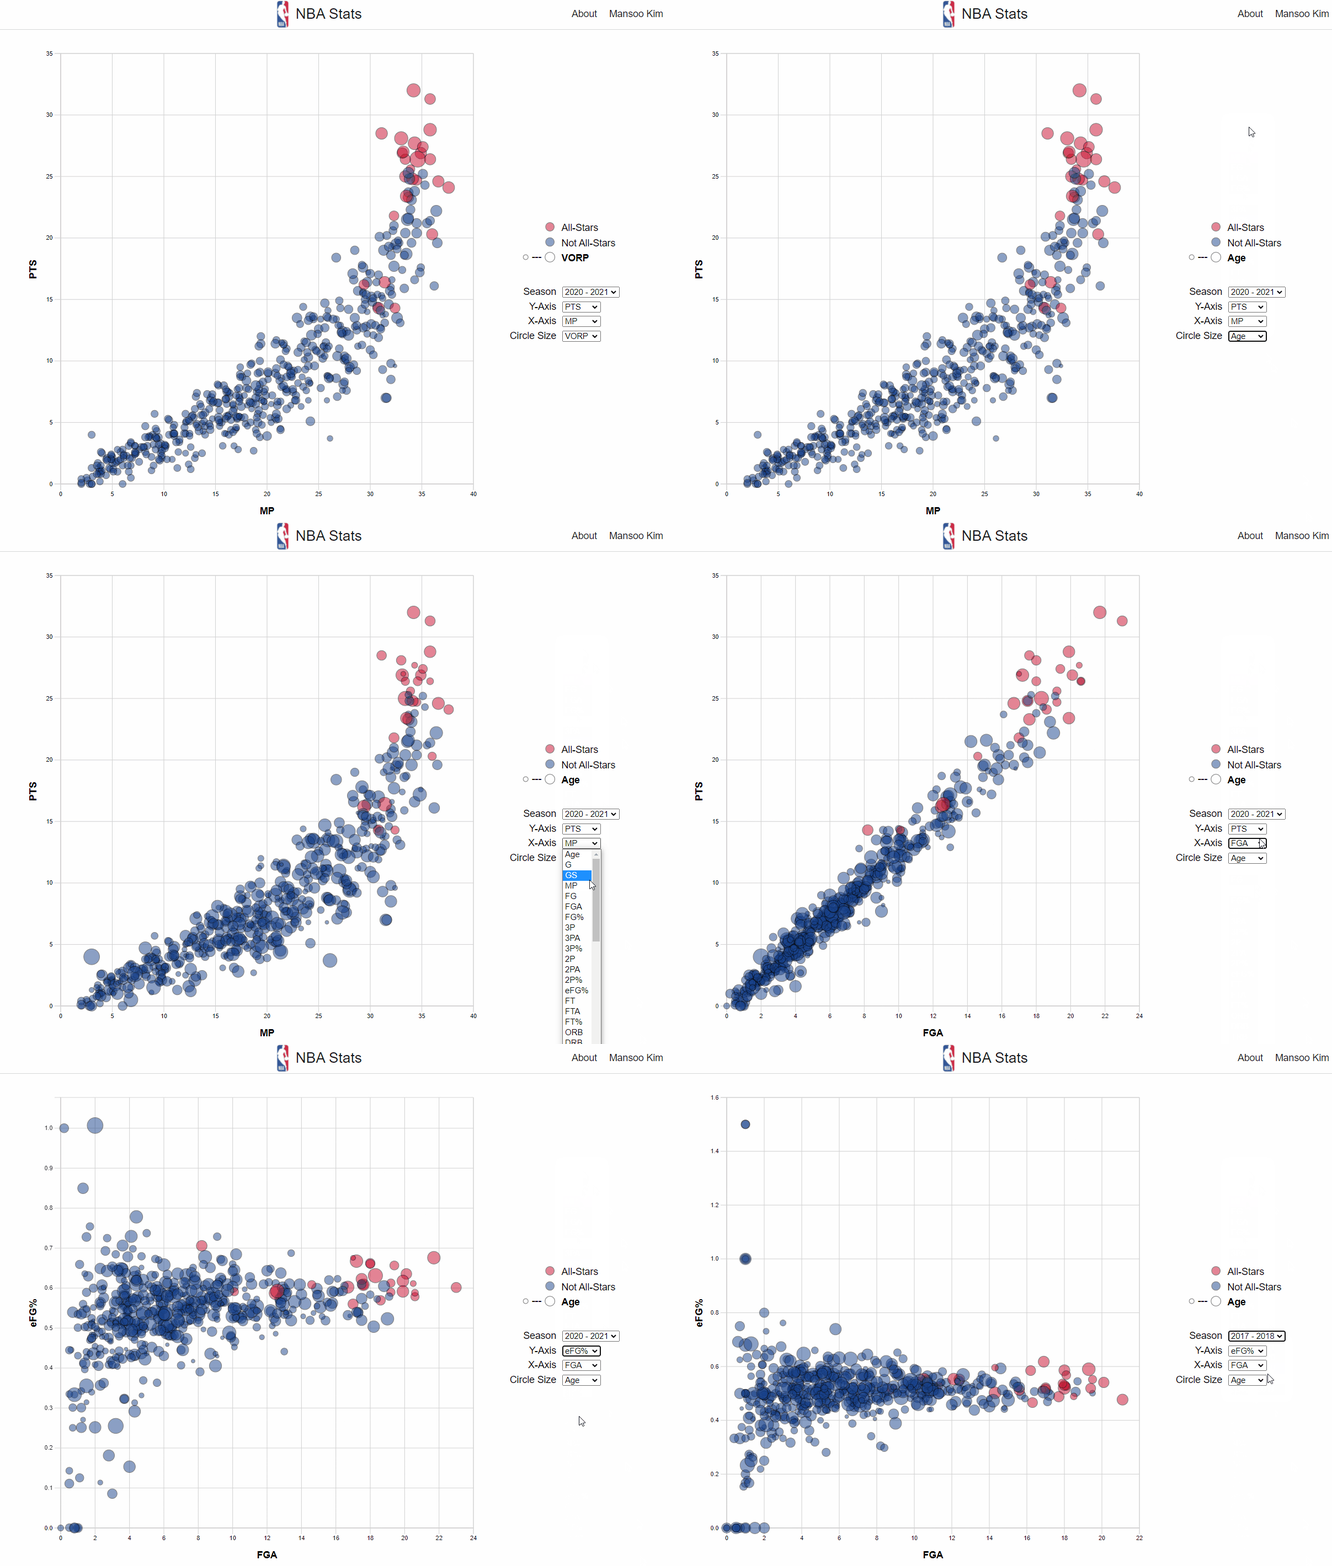
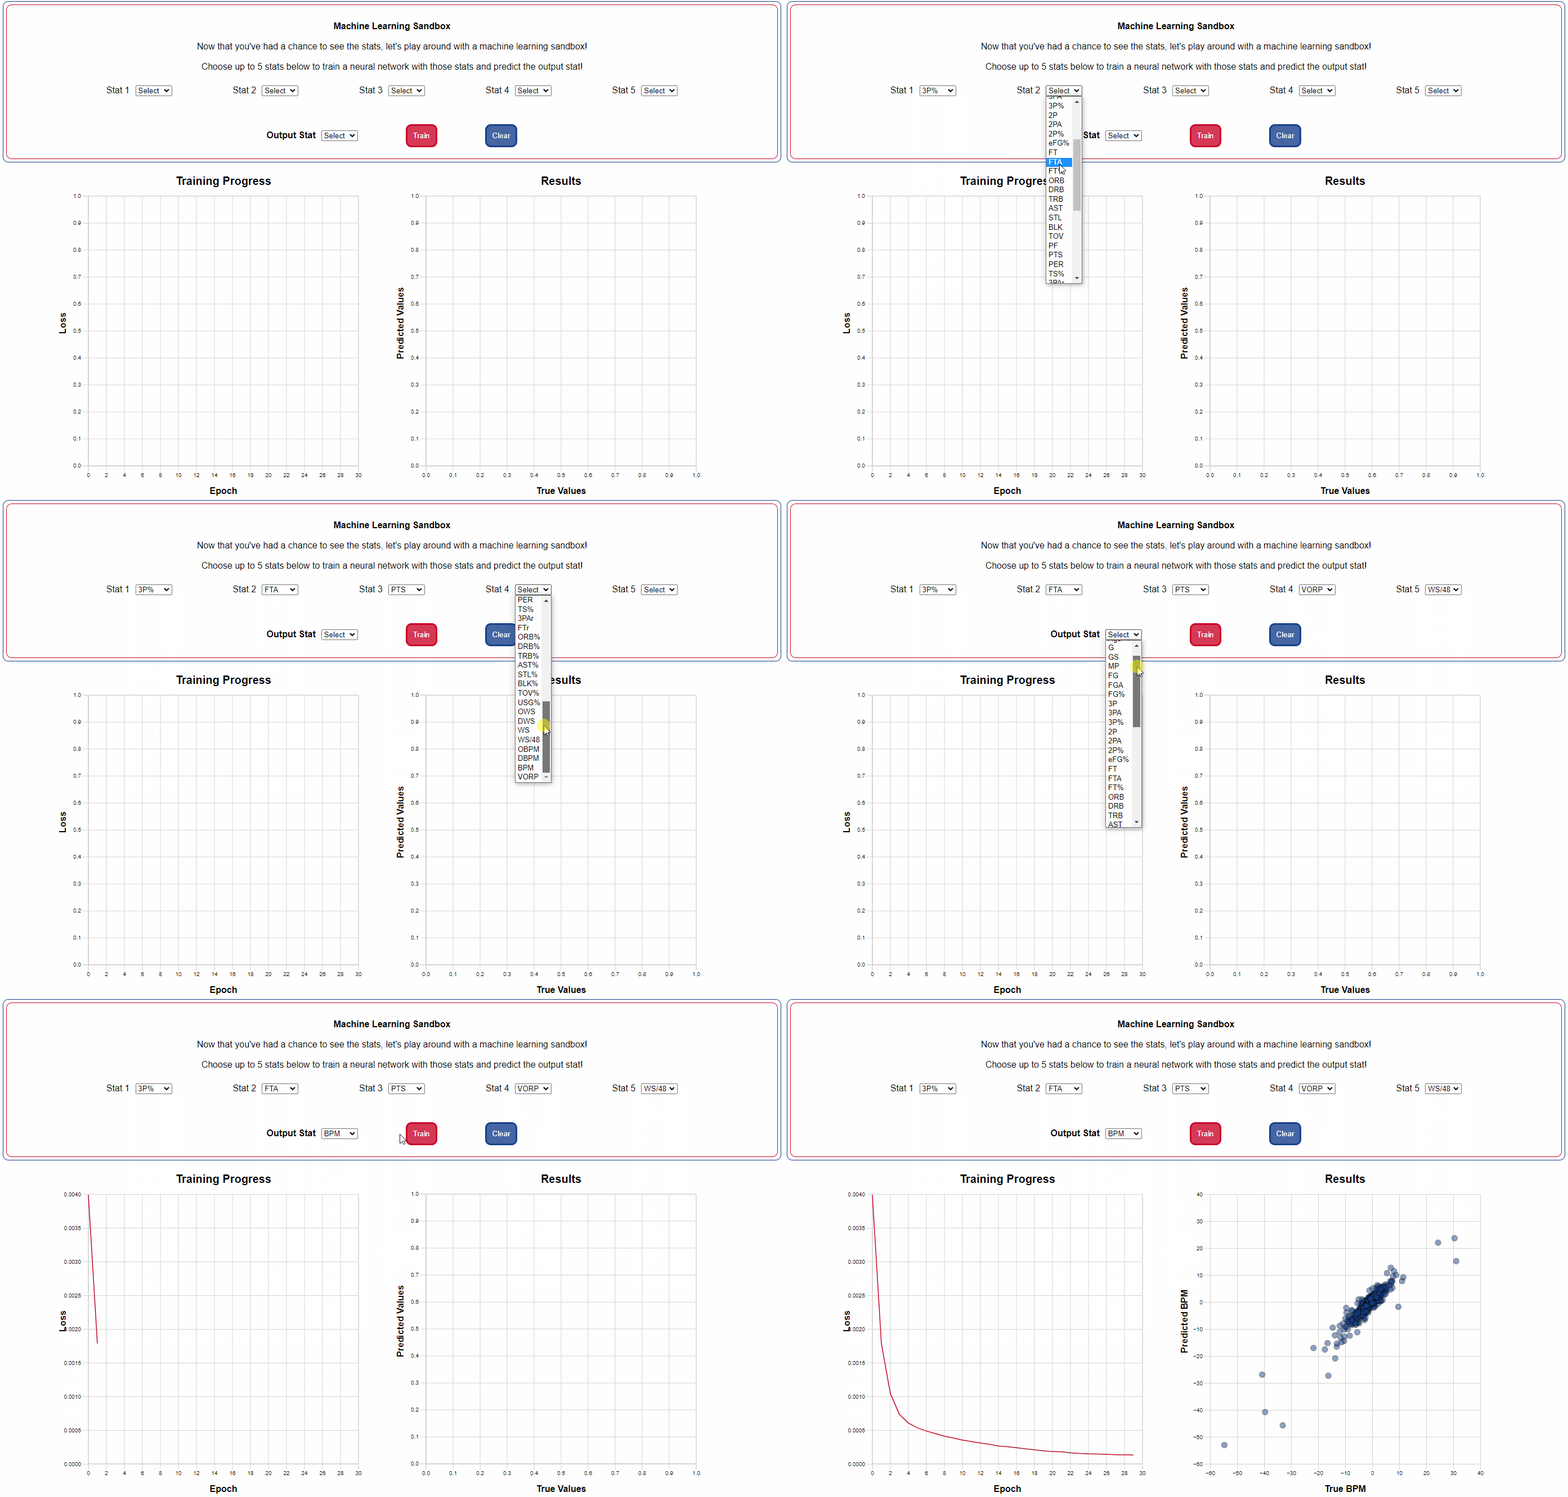
NBA Stats is a data visualization app where users can explore NBA stats from past seasons. Additionally, users can use the machine learning sandbox to train and test a neural network to see how effective certain stats are at predicting an output stat.
NBA Stats was implemented using JavaScript, D3.js, and TensorFlow.js
- Interactive D3.js scatter plot displays data with hover tooltips for more information on stats.
- Users can select stats for Y-axis, X-axis, and circle size, as well as the year for the NBA season.
let circles = this.plot.svg.append("g")
  .attr("class", "scatter-circles")
  .selectAll("circle").data(data).enter().append("circle");

circles
  .on("mouseenter", (_, d) => {
    const imgTag = (d["Tm"] !== "TOT") ? `<img src="src/assets/images/team-logos/${d["Tm"]}.png" width="30px">` : "";
    this.tooltip
    .style("visibility", "visible")
    .html(
      `<div class="tooltip-logo-line"><strong>${d["Player"]}</strong>${imgTag}</div>
      <p>${yStat}: ${d[yStat]}</p>
      <p>${xStat}: ${d[xStat]}</p>
      <p>${aStat}: ${d[aStat]}</p>`
    );
  })
  .on("mousemove", (event) => {
    this.tooltip
      .style("left", event.pageX + 20 + "px")
      .style("top", event.pageY - 40 + "px");
  })
  .on("mouseleave", () => this.tooltip.style("visibility", "hidden"))
  .attr("cx", d => this.plot.xScale(d[xStat]))
  .attr("cy", d => this.plot.yScale(d[yStat]))
  .attr("r", d => aScale(d[aStat]))
.attr("class", d => d["All-Star"] === true ? "all-star" : null);- Powered by TensorFlow.js and its neural network implementation.
- Select up to 5 stats to train a neural network model and an output stat to predict.
- Click "Train" to initiate training the model, and wait for the results!
async run(allData, inputColumns, outputColumn) {
  this.ran = true;
  this.outputColumn = outputColumn;
  const { trainingInputs, trainingY, testingInputs, testingY, outputMin, outputMax } = this.prepData(allData, inputColumns, outputColumn);

  const model = this.createModel(inputColumns.length);

  await this.train(model, trainingInputs, trainingY);

  const preds = this.test(model, testingInputs);

  this.updateResults(testingY, preds, outputMin, outputMax);
}

