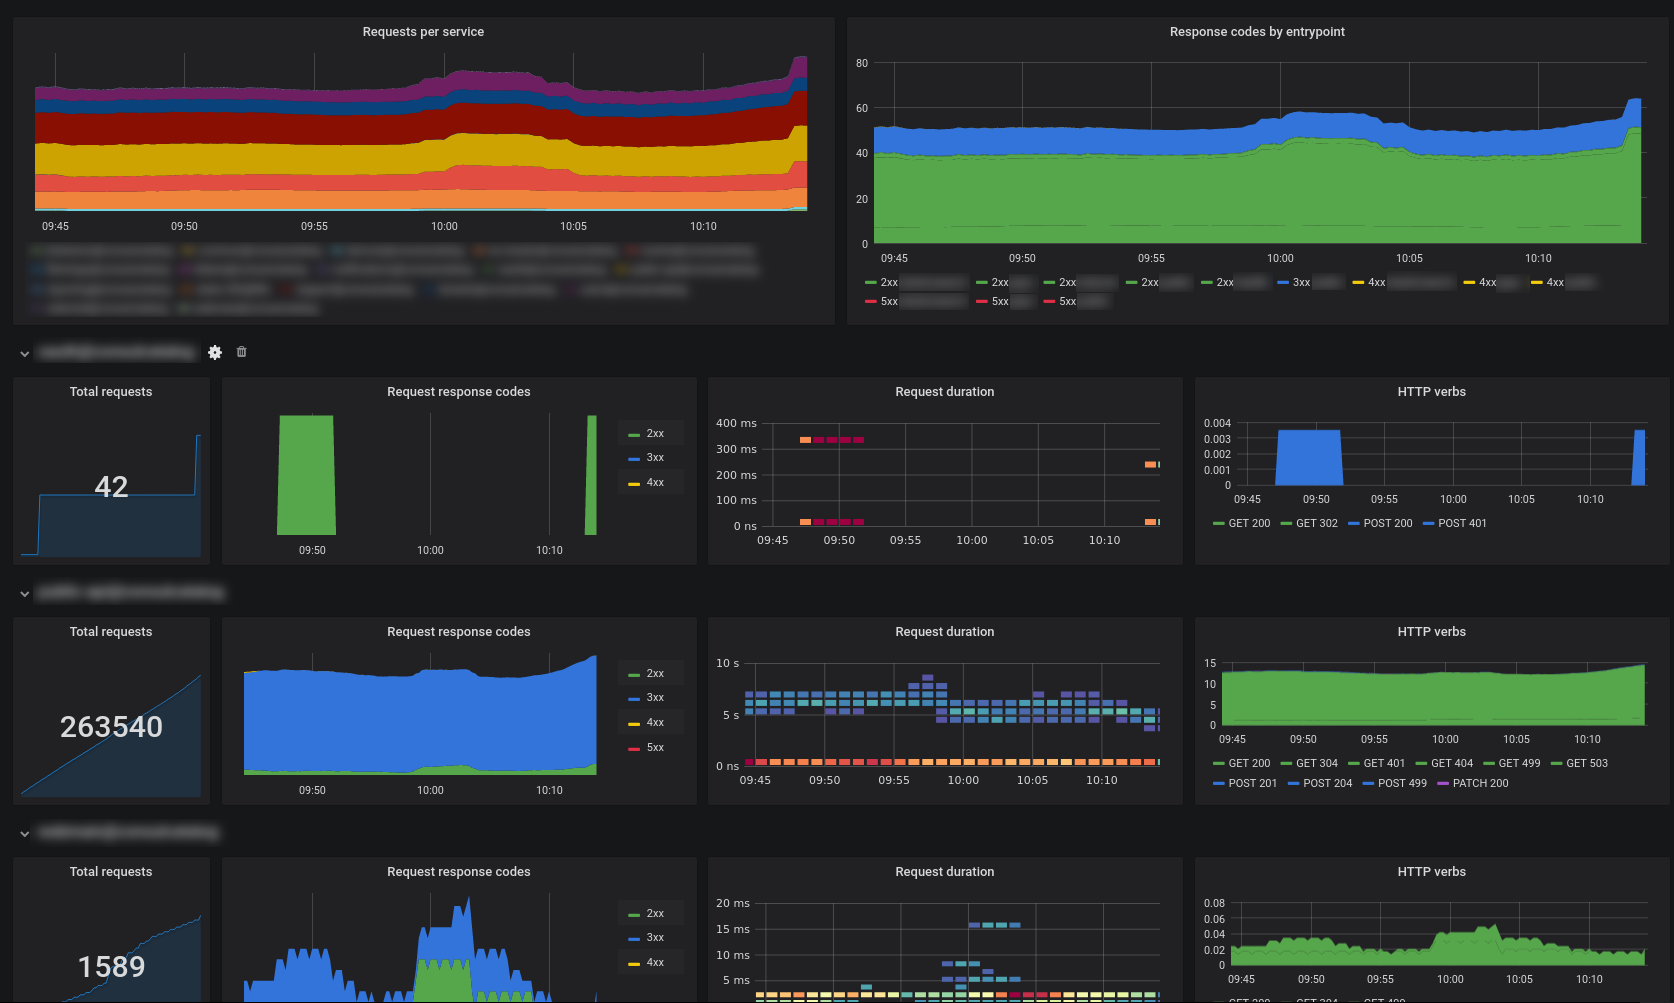
traefik-grafana-board
A grafana configuration for a simple traefik dashboard.
It's primarily oriented towards displaying HTTP requests and their status.
You have to enable prometheus reporting inside traefik to collect these metrics.
The dashboard consists of an overview over all services and a repeated list of statistics for each service.
You can toggle the services to display by using the $service variable and the prometheus source via $prometheus.
