Railroad_Map
Used Google Maps to help visualize the benefits of the A* graph search
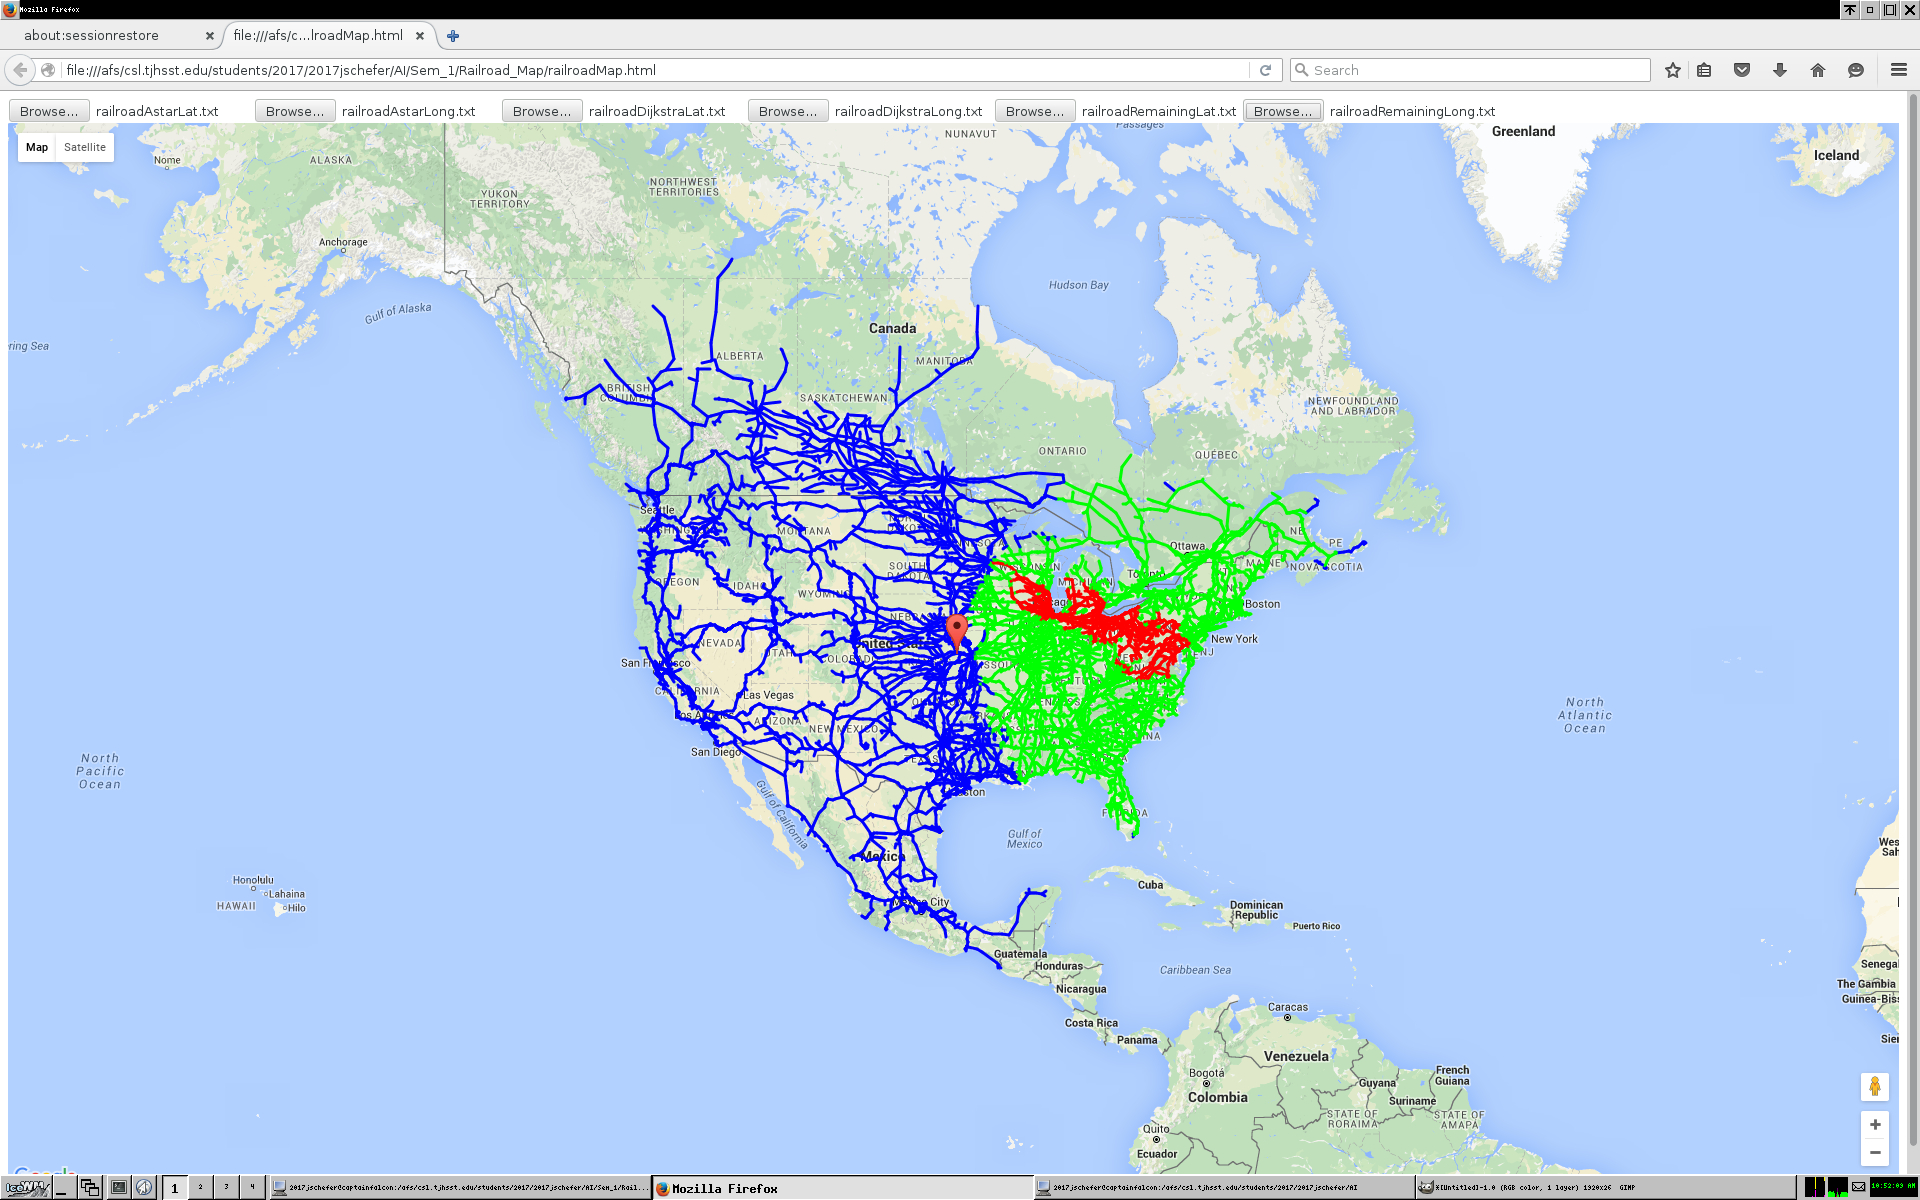
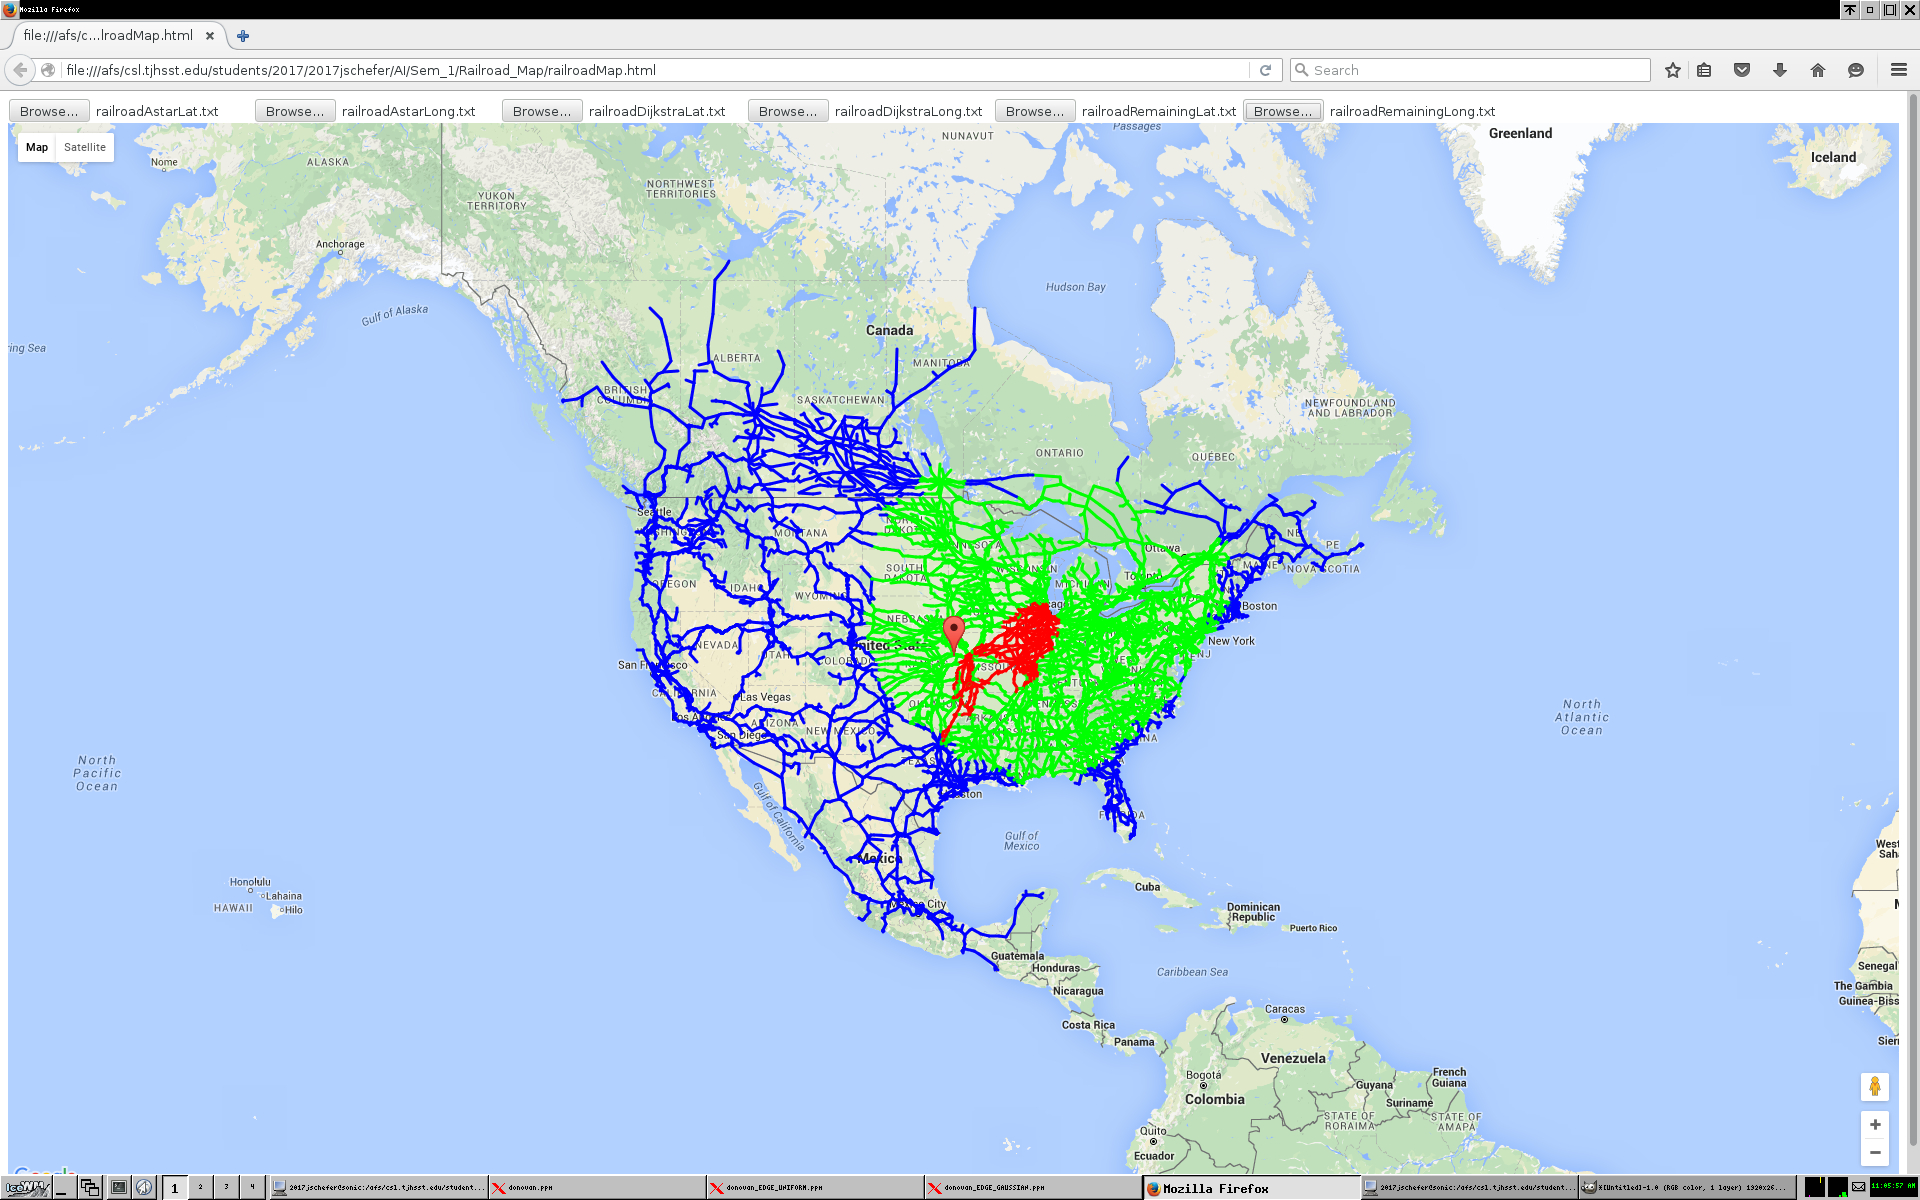
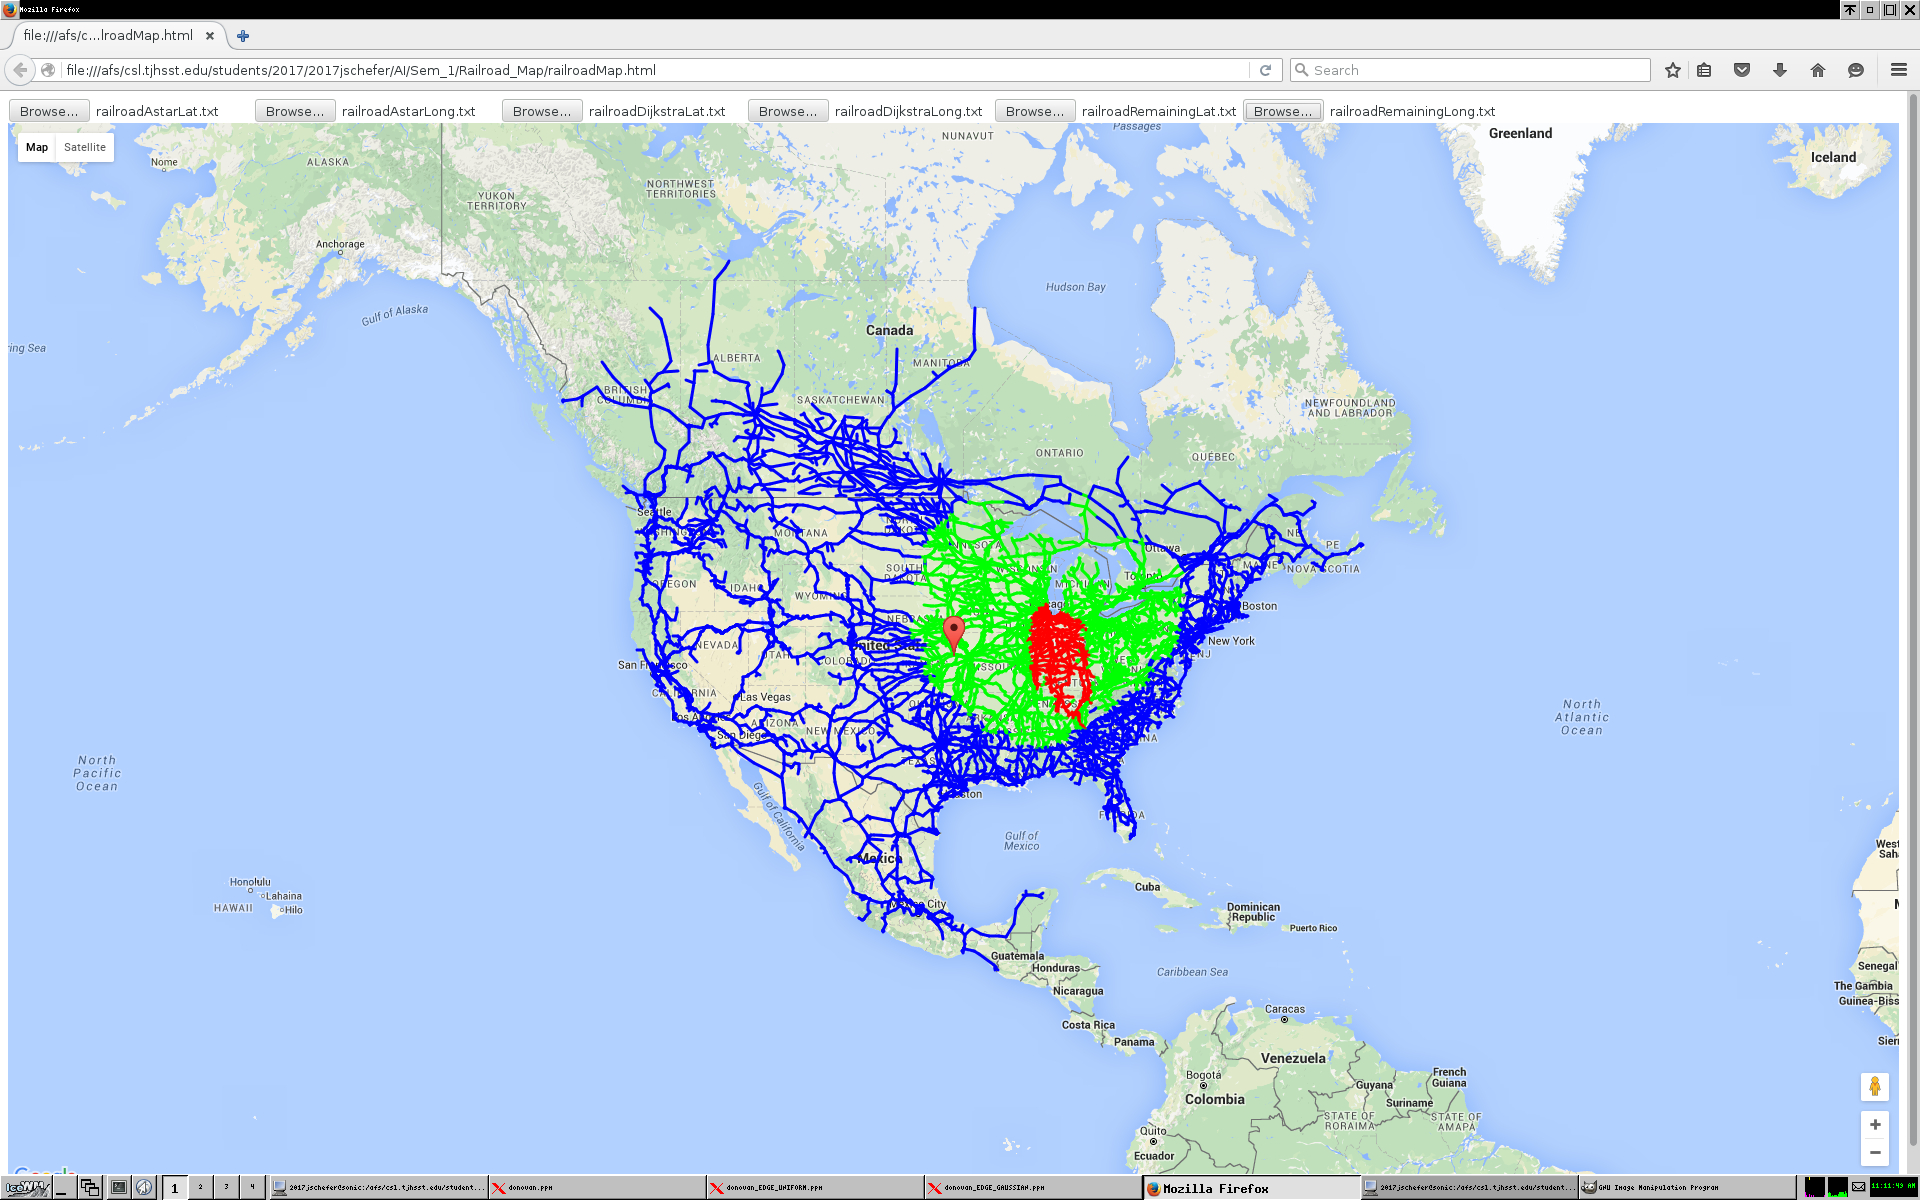
BACKGROUND: The A* search is designed to outperform other graph searches by a heuristically guessing the next node in the graph to check. This means that the algorithm will only have to check a fraction of the total paths before finding the shortest solution. As you can see in the example screenshots provided, the A* search(red) ouperforms the Dijkstra's algorithm (green). The blue paths represent all remaining nodes in the tree that neither algorithm checked.
Here is a visualization of the path from Washington, D.C. to Minneapolis:
 Chicago to Dallas:
 Chicago to Atlanta:

To view the map, run the python file called runme.py, this will run the A* and Dijkstra searches, print out a temporary javascript file of coordinates, and then launch the map. If you would like to run a different search, other than the default of Washington, D.C. to Minneapolis, add two of the city names (or codes) found in rrNodeCity.txt after your call of runme.py; you could also just change the defaults at the top of printer.py. For example, to run the search from Dallas to Brooklyn you would run the command $ python3 runme.py Dallas Brooklyn.
By default, the map will open in firefox, but this can be changed in the runme.py file.
This was made to be run from the command line on linux, see the comments in runme.py for Mac users, other operating systems will most likely require tweaks to get it to run properly.