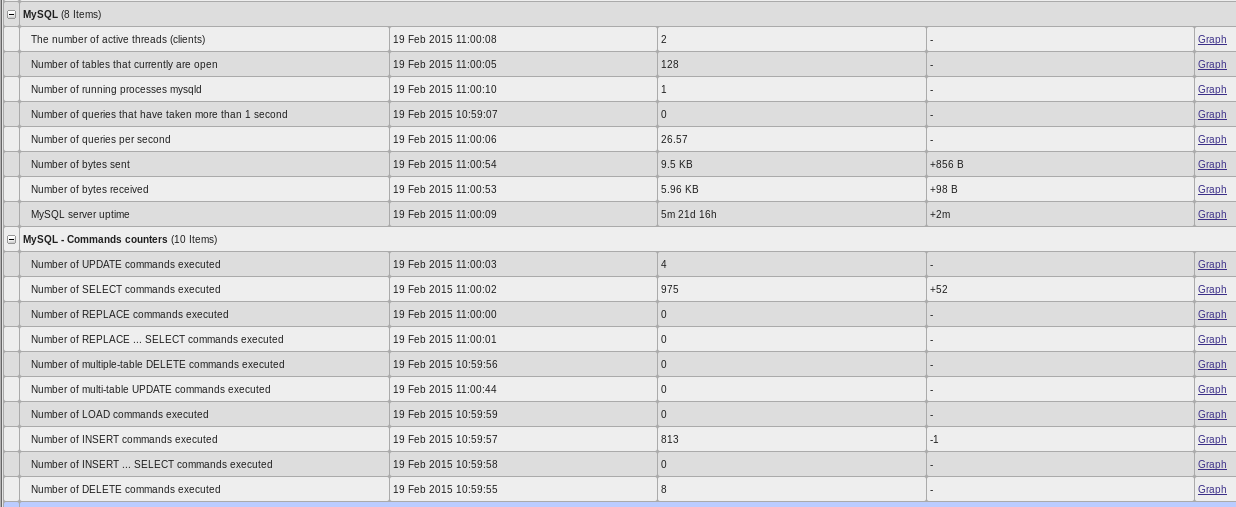
Extensive monitoring plugin for MySQL, including operational status, metrics, command counters AND slave-to-master monitoring by comparing table checksums.
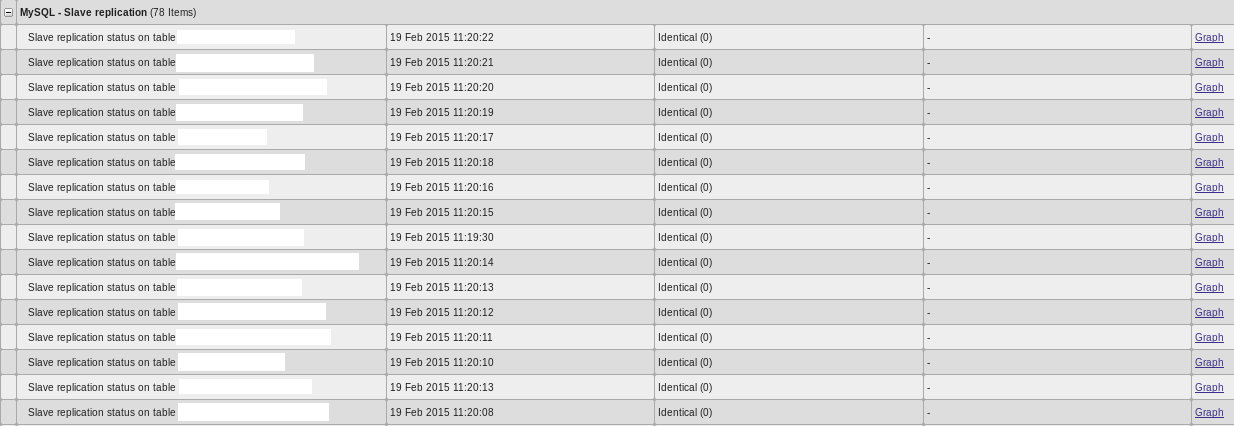
The slave monitoring is implemented through an extensive use of the powerful low-level discovery features available in Zabbix. As a result, only what gets replicated on the slave is actually monitored.
Depending on how you distribute your plugins around and respective Zabbix configuration, you would at least need to set up the following userparameters on the agent side:
UserParameter=mysql[*],<path_to_your_plugins>/mysql.sh $1
UserParameter=mysql.replication[*],<path_to_your_plugins>/mysql.sh replication $1
UserParameter=mysql.replication.checksum[*],<path_to_your_plugins>/mysql.sh replication checksum $1
UserParameter=mysql.replication.discovery,<path_to_your_plugins>/mysql.sh replication discovery
You would then need to import the templates into Zabbix and link them to the hosts you wish to monitor.
Before importing the template, you are required to add the following value mappings so that sampled values can be mapped to human readable states (makes latest data look prettier).
mysql> SELECT name, value, newvalue FROM valuemaps INNER JOIN mappings ON valuemaps.valuemapid = mappings.valuemapid WHERE name LIKE 'MySQL%';
+----------------------------------------------+-------+-------------+
| name                                         | value | newvalue    |
+----------------------------------------------+-------+-------------+
| MySQL - IO thread status                     | -1    | Disabled    |
| MySQL - IO thread status                     | 0     | Running     |
| MySQL - IO thread status                     | 1     | Not running |
| MySQL - Master read/exec log position status | 0     | In sync     |
| MySQL - Master read/exec log position status | 1     | Out of sync |
| MySQL - Slave replication table status       | 0     | Identical   |
| MySQL - Slave replication table status       | 1     | Different   |
| MySQL - Slave replication table status       | -1    | Absent      |
| MySQL - SQL thread status                    | -1    | Disabled    |
| MySQL - SQL thread status                    | 0     | Running     |
| MySQL - SQL thread status                    | 1     | Not running |
+----------------------------------------------+-------+-------------+
By default, the plugin makes use of the $HOME/.my.cnf config file to connect to the local MySQL instance. You should probably look at distributing this via Puppet.
If you run zabbix-agentd as root, you would have to configure /root/.my.cnf as follows:
[client]
user=root
host=localhost
password=<your_password>
When it comes to slave monitoring, you would need to make sure that the following environment variables are defined in mysql.cfg in the same directory where the plugins gets installed.
export MYSQL_MASTER_HOST="<master_host>"
export MYSQL_MASTER_USER="<master_user>"
export MYSQL_MASTER_PASSWORD="<master_password>"
# number of times the checksum will be re-calculated if differs from the master
export MYSQL_CHECKSUM_RETRY=
MySQL server generic statistics including command counters:
MySQL slave replication (LLD):
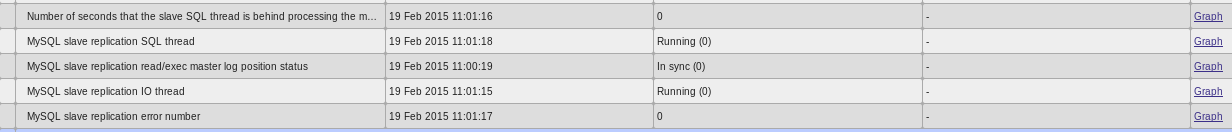
MySQL slave replication status:
Matteo Cerutti - matteo.cerutti@hotmail.co.uk