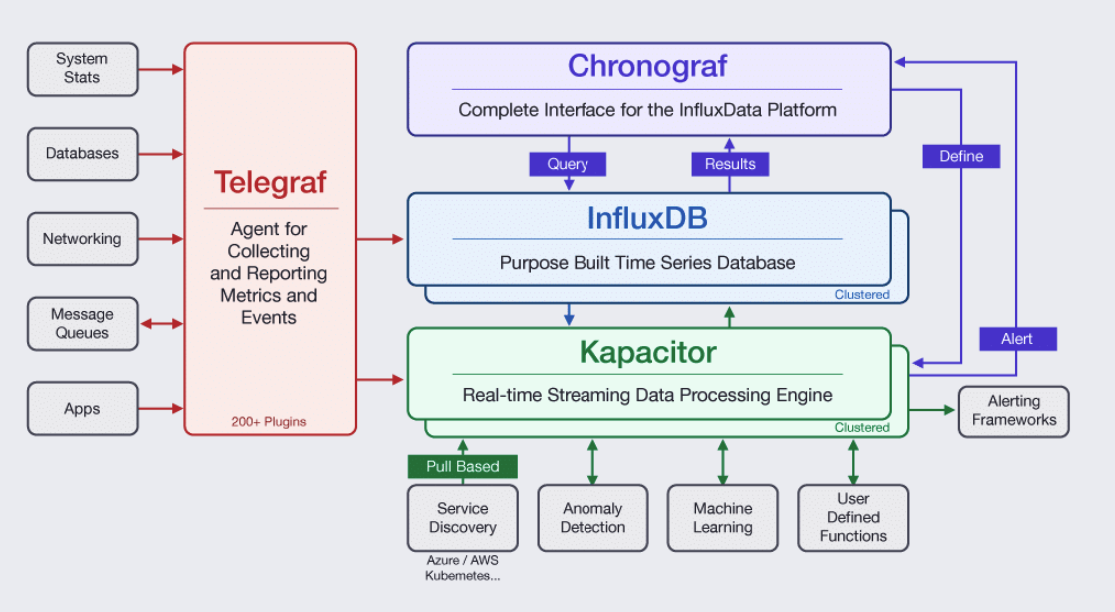
Purpose of this repository is a comparison of three kubernetes metrics storages - InfluxDb, Prometheus and Graphite.
Requirements
- minikube -
>= 1.24.0 - kubectl
- helm
It may be needed to allow access to ports by disabling firewall:
$ sudo ufw allow PORT_NUMBEROnly for demonstration purposes we use Kubernetes clusters locally with MiniKube.
$ minikube version
minikube version: v1.24.0
commit: 76b94fb3c4e8ac5062daf70d60cf03ddcc0a741b

$ minikube start -p lsc
(...)
$ kubectl cluster-info
Kubernetes master is running at https://192.168.49.2:8443
KubeDNS is running at https://192.168.49.2:8443/api/v1/namespaces/kube-system/services/kube-dns:dns/proxy

To further debug and diagnose cluster problems, use 'kubectl cluster-info dump'.

$ minikube -p lsc ssh
Last login: Sun Jan  9 19:20:59 2022 from 192.168.49.1
docker@lsc:~$ sudo chmod 666 /var/run/docker.sock
and please create monitoring namespace
kubectl create ns monitoringIn general, metrics are numeric measurements recorded over time, so they could be understood as time series. Example pack of metrics for web application includes number of requests per time unit, response code statistics, average CPU usage, etc. In this project we measure metrics for Kubernetes pod with instance of each studied technology.
Main goal of this project is to deploy each service on localhost kubernetes cluster and integrate with most popular dashboarding solution - Grafana. Another aspect to explore is to verify wheater those solutions are compatible as a source for metrics for kubernetes autoscaling.
Grafana is an open-source software made by GrafanaLabs which allows its user to query and visualize given metrics. It is compatible and easy connectable with InfluxDB, Prometheus and Graphite what was the main reason of decision of using it for project results' presentation.
The most suitable method to use it with Kubernetes is to install it with helm:
$ helm repo add grafana https://grafana.github.io/helm-charts
$ helm install grafana -n monitoring grafana/grafana
Fetch secret - admin password needed to login to the Grafana Dashboard from browser:
$ kubectl get secret --namespace default grafana -o jsonpath="{.data.admin-password}" | base64 --decode ; echoThe method to view Grafana Dashboard is presented in the next section of this report.
InfluxDB is an open-source database designed for time series storage by InfluxLabs. Data is stored in tables or in trees and for every piece of it a _time column with a timestamp is present. This is an example of push architecture - data must be directly written into the database. It is similar to SQL databases but is additionally optimized to handle time series data. In addition, a query language InfluxQl similar to SQL has been designed.
SELECT <field_key>[,<field_key>,<tag_key>] FROM <measurement_name>[,<measurement_name>]Data points are written with use of the line protocol. This text-based format consists of the following elements:
- Measurement - measurement name (required)
- Tag set - tag key-value pairs for particular point (optional)
- Field set - all field key-value pairs for the point (required)
- Timestamp - the Unix timestamp for the data point (optional)
- Whitespace - non-escaped whitespaces delimit elements of a data point, the former separates Measurement and Tag set from Field set while the latter separates Field set from Timestamp.
Example:
measurementName,tagKey=tagValue fieldKey="fieldValue" 1465839830100400200
While InfluxDB for single node is fully open source, for a bigger performance an Enterprise version is needed. The documentation states that single node does not require redundancy but it is a dangerous case, due to failure of writes and queries when a server is unavailable. A demand for high-performance is defined as one of the following:
- more than 750,000 writes per second
- more than 100 moderate queries per second
- more than 10,000,000 series cardinality
From hardware side, it is recommended to use SSDs to store data. In addition other requirements are rather big:
 Screenshot taken from official website: https://docs.influxdata.com/influxdb/v1.8/guides/hardware_sizing/#influxdb-oss-guidelines
$ helm repo add influxdata https://helm.influxdata.com
$ helm upgrade -i influxdb influxdata/influxdb -n monitoringexport POD_NAME=$(kubectl get pods --namespace default -l "app.kubernetes.io/name=grafana,app.kubernetes.io/instance=grafana" -o jsonpath="{.items[0].metadata.name}")
kubectl --namespace default port-forward $POD_NAME 3000$ KUBERNETES_HOST=$(minikube -p lsc ip)
$ helm upgrade --install -n monitoring telegraf-ds \
--set daemonset.config.outputs.influxdb.urls={http://influxdb.monitoring:8086} \
--set daemonset.config.inputs.kubernetes.url=http://${KUBERNETES_HOST}:10255 \
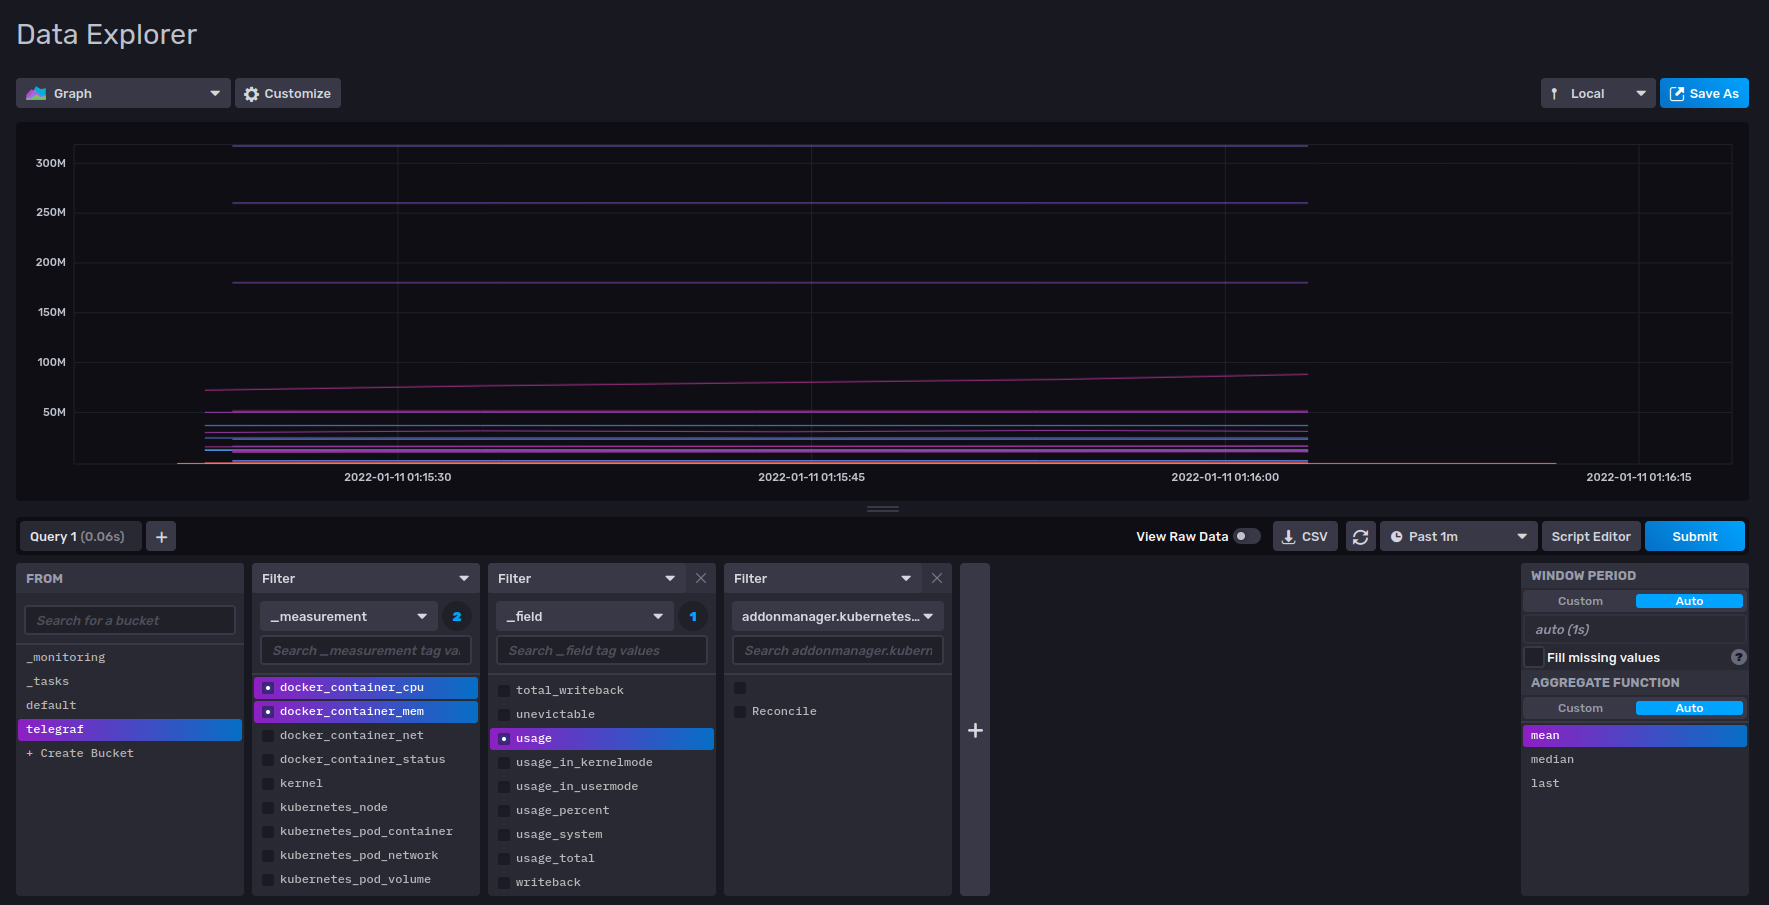
influxdata/telegraf-dsMetrics are being pulled from docker socket - telegraf is running as DaemonSet
kubectl describe cm -n monitoring telegraf-ds(...)
[[inputs.docker]]
endpoint = "unix:///var/run/docker.sock"
(..)
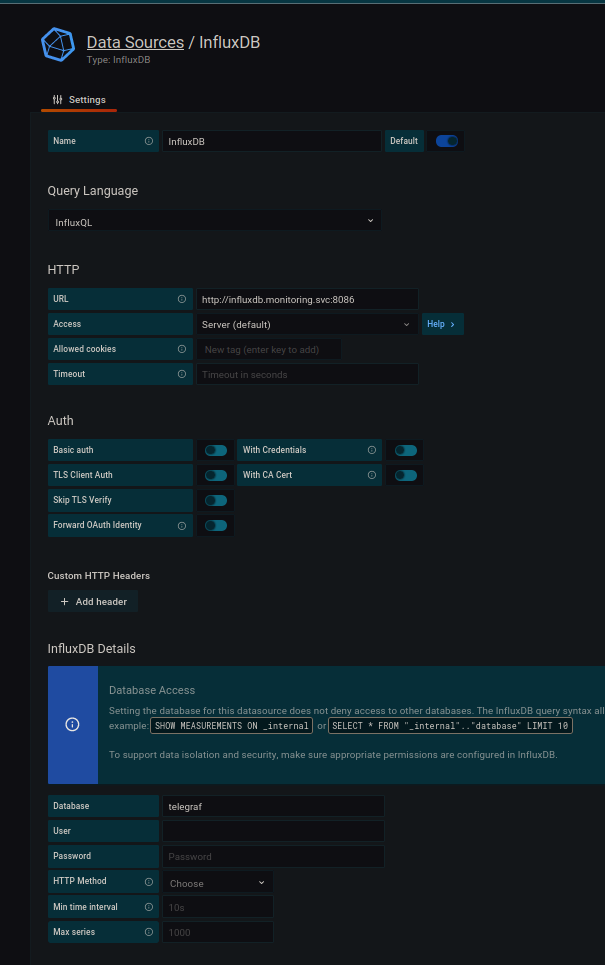
[[outputs.influxdb]]
database = "telegraf"
timeout = "5s"
urls = [
"http://influxdb.monitoring.svc:8086"
]
user_agent = "telegraf"
(...)From inside of InfluxDb container find if the telegraf database has been created:
$ influx
Connected to http://localhost:8086 version 1.8.6
InfluxDB shell version: 1.8.6
> SHOW databases
name: databases
name
----
_internal
telegraf
Example queries on metrics data:
$ influx
Connected to http://localhost:8086 version 1.8.6
InfluxDB shell version: 1.8.6
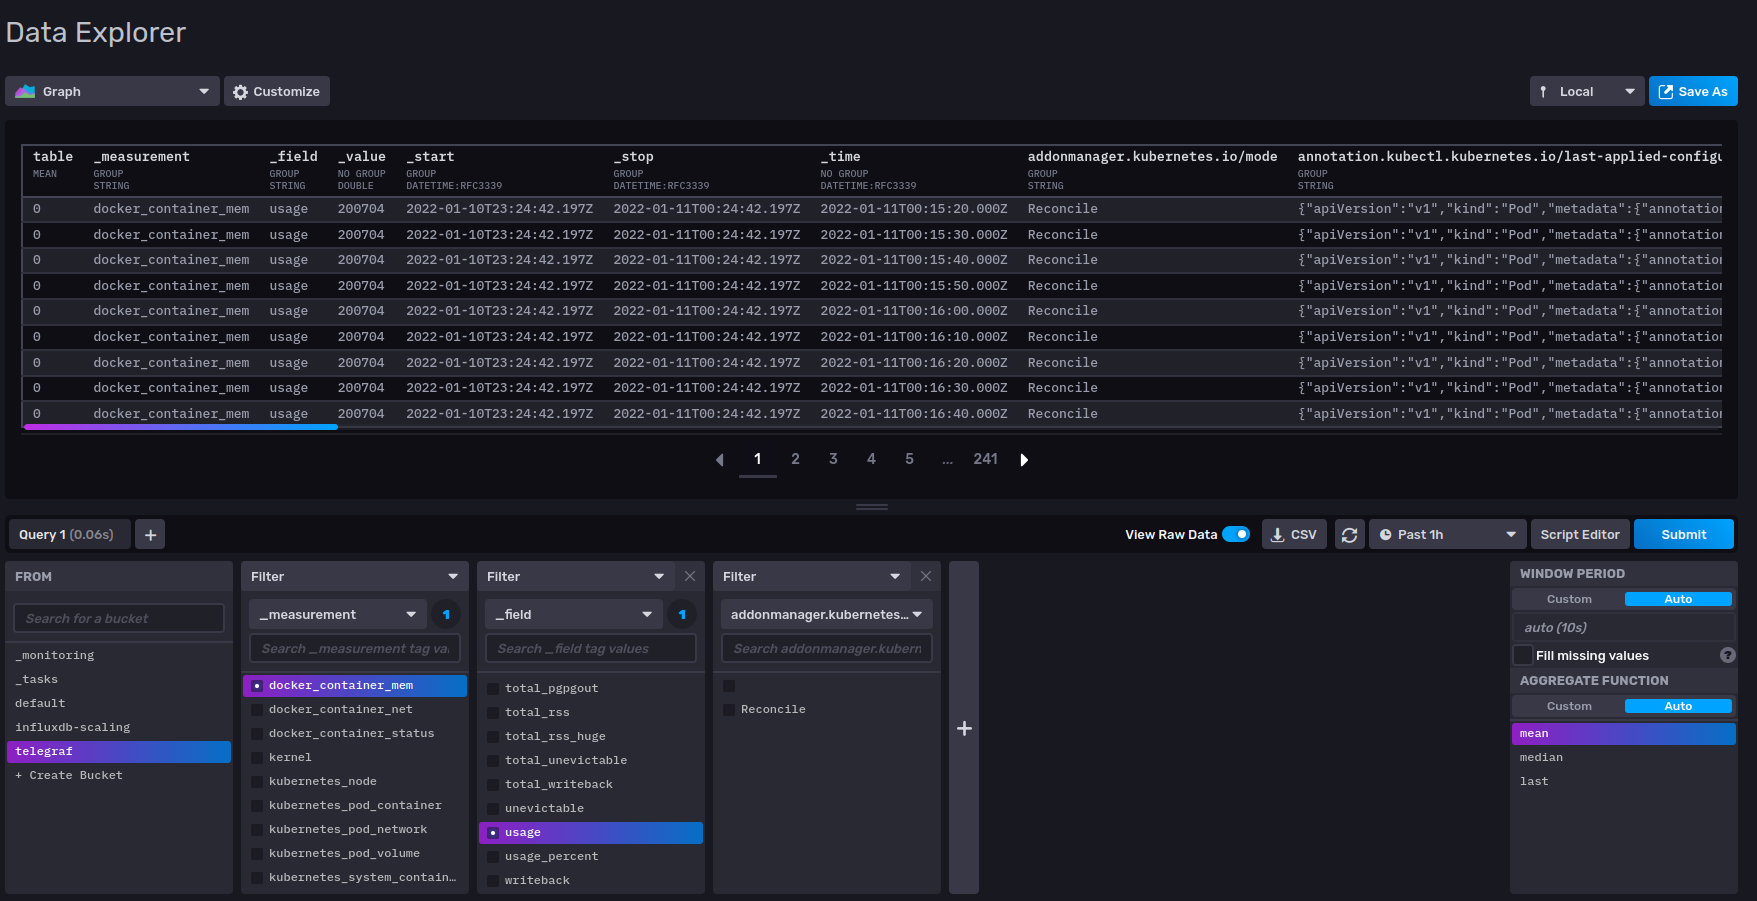
> SELECT usage_percent, container_name FROM docker_container_mem LIMIT 15;
name: docker_container_mem
time                usage_percent         container_name
----                -------------         --------------
1641756151000000000 0.0014785347305364344 k8s_POD_kube-proxy-rbx9v_kube-system_68308d73-1217-4bfb-be6d-e52b6e30a601_0
1641756152000000000 0.0007575963082087515 k8s_POD_coredns-78fcd69978-2jspd_kube-system_f59622d8-7008-4447-99f8-2c6ba56d0cb9_0
1641756152000000000 0.0005376489929223398 k8s_POD_etcd-lsc_kube-system_0718f35ce7473bbbfbc9b019ef460259_0
1641756152000000000 0.0008186927846771992 k8s_POD_influxdb-0_default_8cee725a-c6c2-45e4-bd91-d94f868c729a_0
1641756152000000000 0.0005376489929223398 k8s_POD_kube-apiserver-lsc_kube-system_f732a34dfa98aa302cd4bdff70682bd2_0
1641756152000000000 0.0005376489929223398 k8s_POD_kube-controller-manager-lsc_kube-system_6c4baaed1d9cc46dd4fadddb7663c040_0
1641756152000000000 0.0005376489929223398 k8s_POD_kube-scheduler-lsc_kube-system_5adae6cb6dff4ae67658d85a4f4ae4fe_0
1641756152000000000 0.0005376489929223398 k8s_POD_storage-provisioner_kube-system_c9e1ca46-335a-4093-bd65-4d4aaec9e639_0
1641756152000000000 0.0008186927846771992 k8s_POD_telegraf-ds-w7xwh_default_4009ed2d-43a5-46d6-ae48-f221224b5b0d_0
1641756152000000000 7.0657169117647065    k8s_coredns_coredns-78fcd69978-2jspd_kube-system_f59622d8-7008-4447-99f8-2c6ba56d0cb9_0
1641756152000000000 0.10777418449034175   k8s_etcd_etcd-lsc_kube-system_0718f35ce7473bbbfbc9b019ef460259_0
1641756152000000000 0.04622559409602753   k8s_influxdb_influxdb-0_default_8cee725a-c6c2-45e4-bd91-d94f868c729a_0
1641756152000000000 0.6919053767098765    k8s_kube-apiserver_kube-apiserver-lsc_kube-system_f732a34dfa98aa302cd4bdff70682bd2_0
1641756152000000000 0.1438211056067259    k8s_kube-controller-manager_kube-controller-manager-lsc_kube-system_6c4baaed1d9cc46dd4fadddb7663c040_0
1641756152000000000 0.032992097292961764  k8s_kube-proxy_kube-proxy-rbx9v_kube-system_68308d73-1217-4bfb-be6d-e52b6e30a601_0
> SELECT mean(usage_percent) FROM docker_container_mem WHERE container_name='k8s_influxdb_influxdb-0_default_8cee725a-c6c2-45e4-bd91-d94f868c729a_0' LIMIT 15;

name: docker_container_mem
time mean
---- ----
0    0.4698723762118421
Or to verify if the node is healthy
$ apk add curl jq
$ curl -XGET "localhost:8086/health" | jq .
  % Total    % Received % Xferd  Average Speed   Time    Time     Time  Current
                                 Dload  Upload   Total   Spent    Left  Speed
100   106  100   106    0     0  97069      0 --:--:-- --:--:-- --:--:--  103k
{
  "checks": [],
  "message": "ready for queries and writes",
  "name": "influxdb",
  "status": "pass",
  "version": "1.8.6"
}export POD_NAME=$(kubectl get pods --namespace monitoring -l "app.kubernetes.io/name=grafana,app.kubernetes.io/instance=grafana" -o jsonpath="{.items[0].metadata.name}")
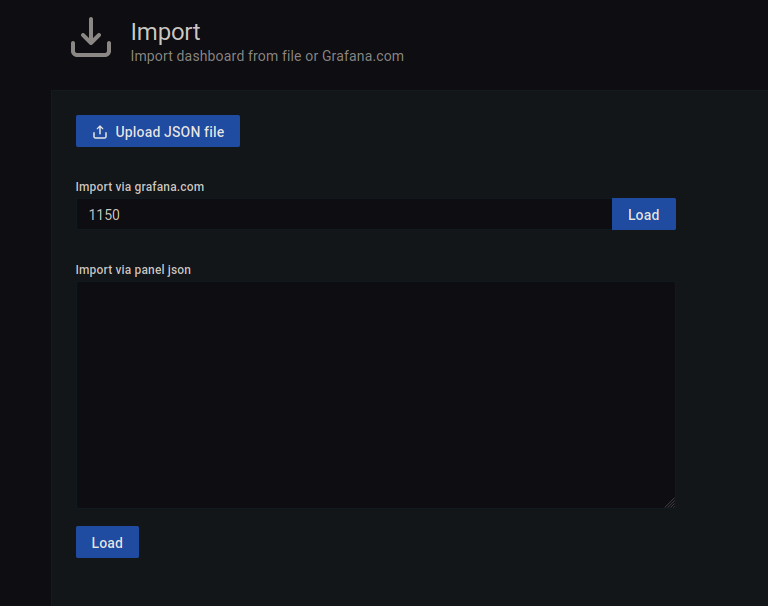
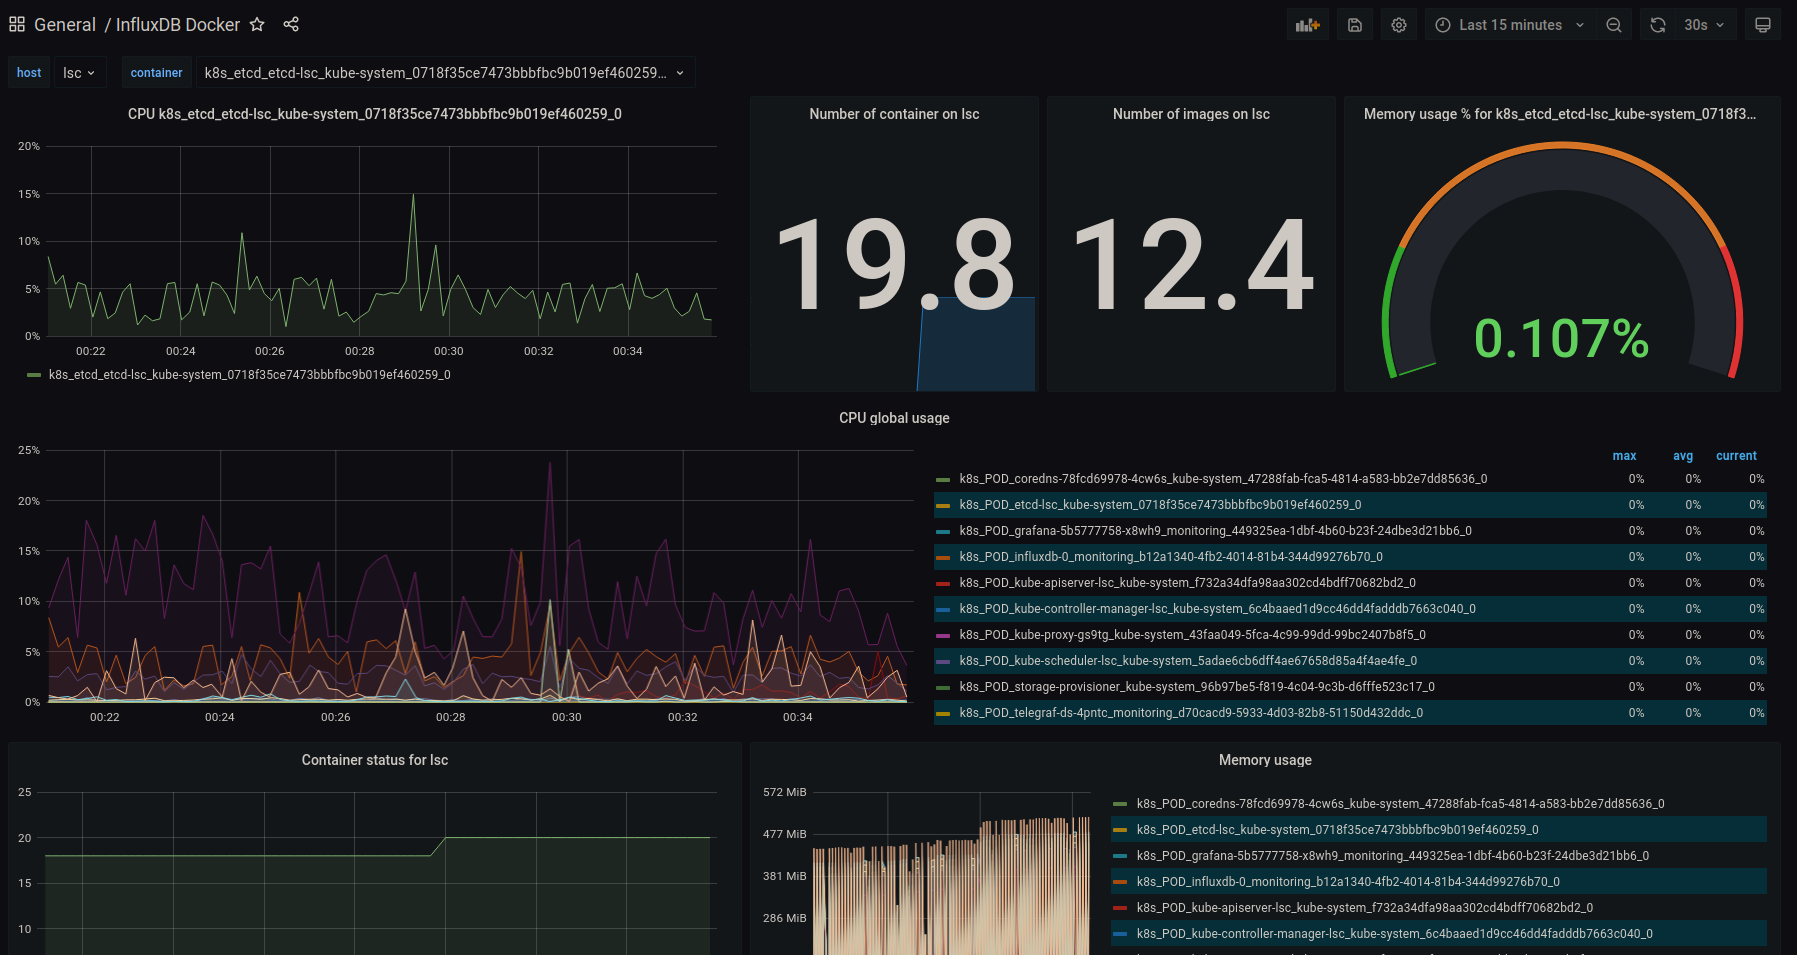
kubectl --namespace monitoring port-forward $POD_NAME 300Import example Docker dashboard
Kubernetes natively supports scaling based on CPU and MEM collectec by metrics-server. Those metrics are reported by each nodekubelet.
Scaling kubernetes workloads based on own metrics might be a challenging task.
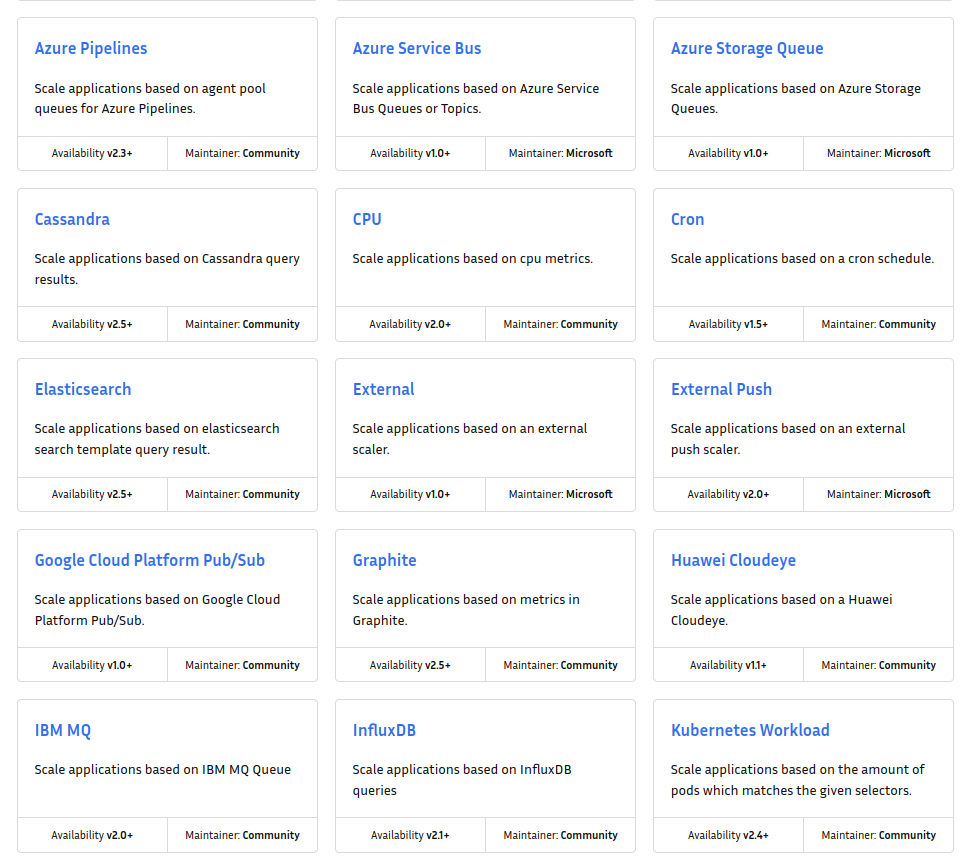
However there is a CNCF project - Kubernetes Event-Driven Autoscaling that has integration with more advanced product than InfluxDB - InfluxDB2.
helm repo add kedacore https://kedacore.github.io/charts
kubectl create namespace keda
helm install keda kedacore/keda --namespace keda
Our approach focused on a Job pattern - each event should trigger quick running jobs, that might for example process spike of events.
apiVersion: keda.sh/v1alpha1
kind: ScaledJob
metadata:
  name: influxdb-consumer
  namespace: lsc
spec:
  jobTargetRef:
    template:
      spec:
        containers:
        - name: influxdb-scaling
          image: alpine
          imagePullPolicy: Always
          command: ["sleep", "20"]
        restartPolicy: Never
   triggers:
  - type: influxdb
    metadata:
      serverURL: http://influx-influxdb2.monitoring.svc:80
      thresholdValue: '2'
      organizationName: influxdata
      query: |
        from(bucket: "influxdb-scaling")
        |> range(start: -5m)
        |> filter(fn: (r) => r._measurement == "scaling")
      authToken: REDACTED
      metricName: influx-metric
kubectl apply -f influxdb-scaling.yml
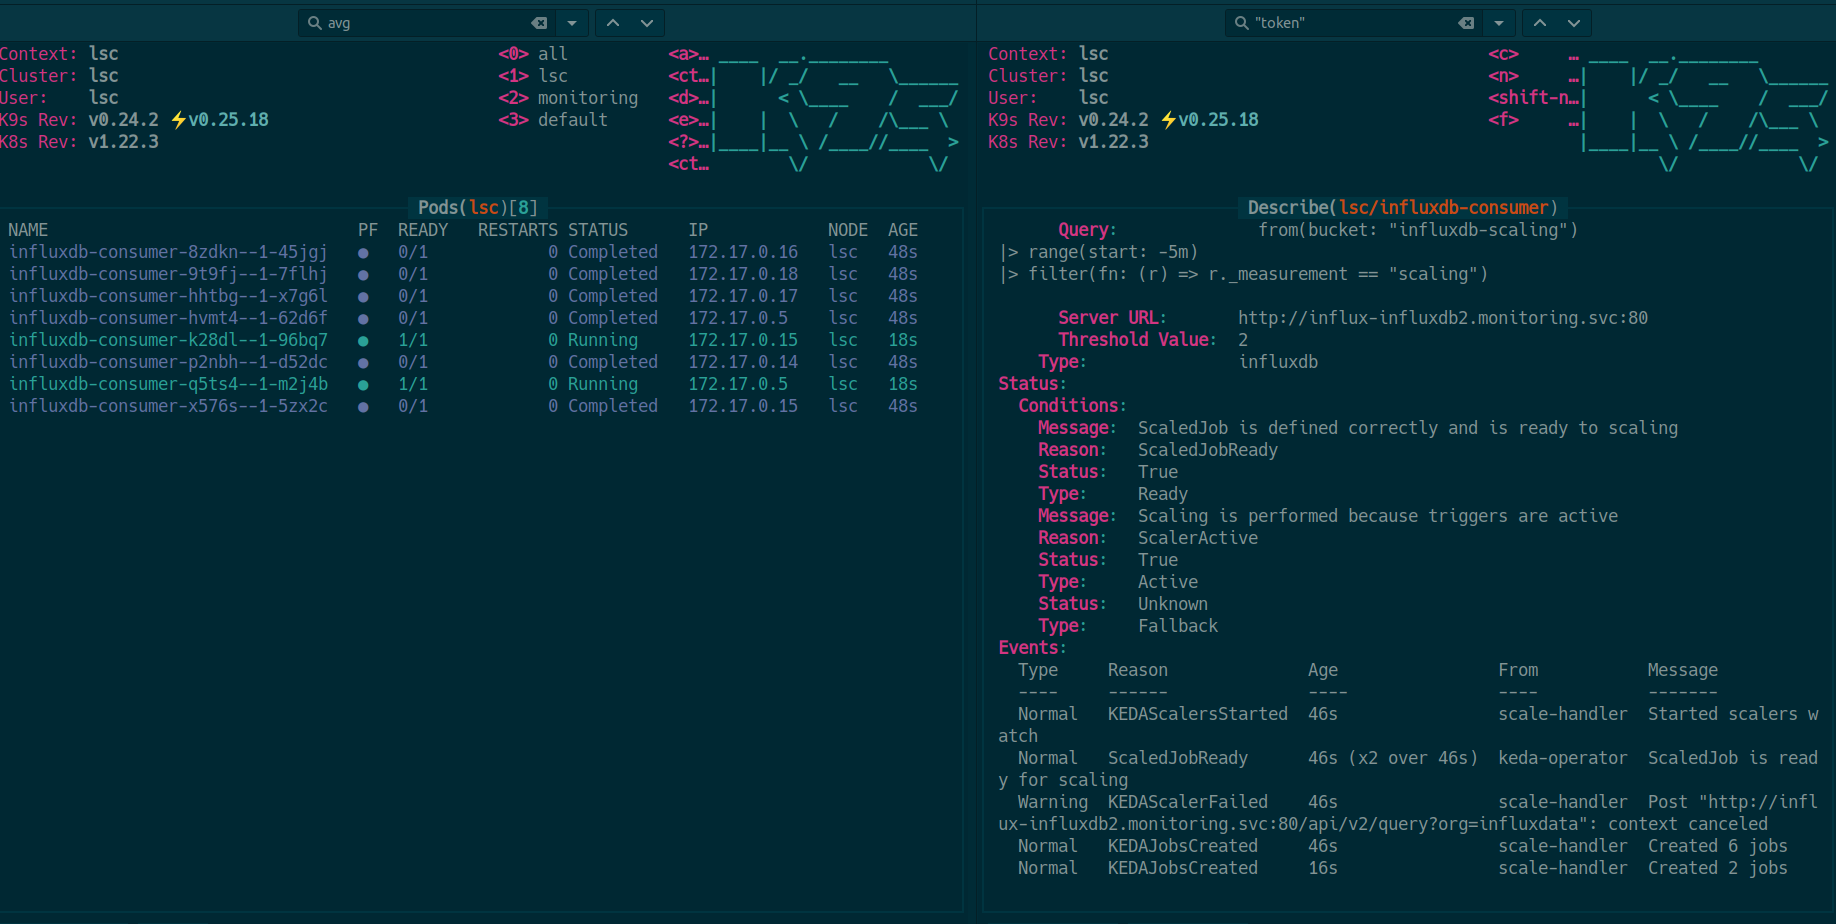
After insertion of above threshold value metrics to influx-scaling bucket we might notice custom scaling
InfluxDB2 is a advanced version with features like build-in UI or agents authorization.
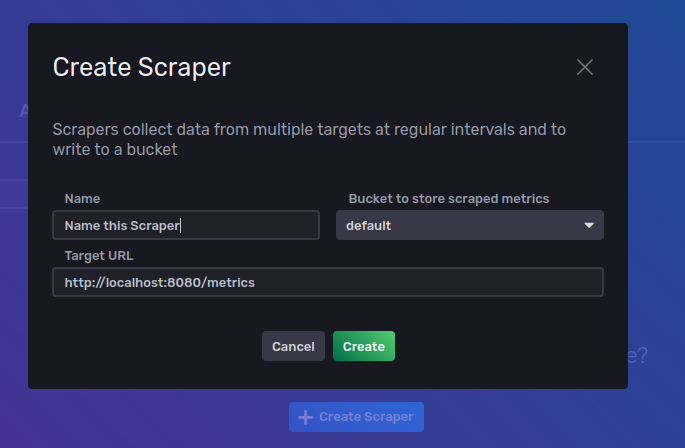
helm upgrade --install influxdb2 influxdata/influxdb2 -n monitoringInfluxDB2 also supports pull architecture with Scrapers feature
(...)
[[outputs.influxdb_v2]]
  bucket = "telegraf"
  token = REDACTED
  urls = [
    "http://influx-influxdb2:80"
  ]
  organization = "influxdata"
(...)
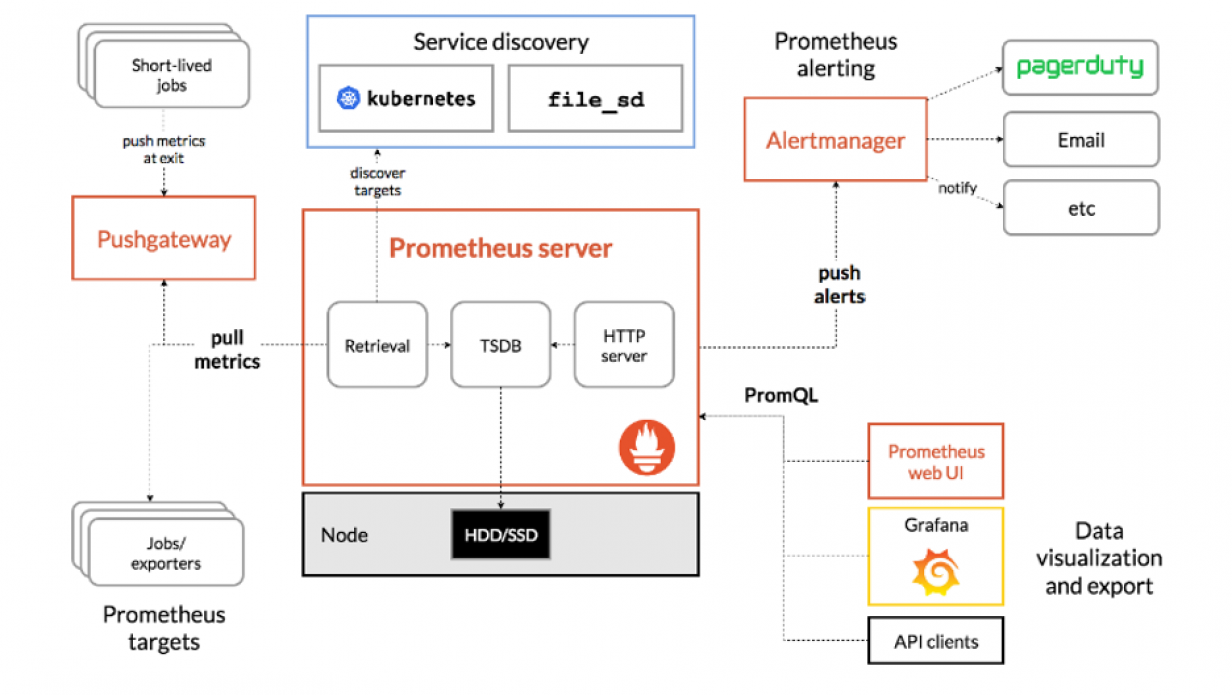
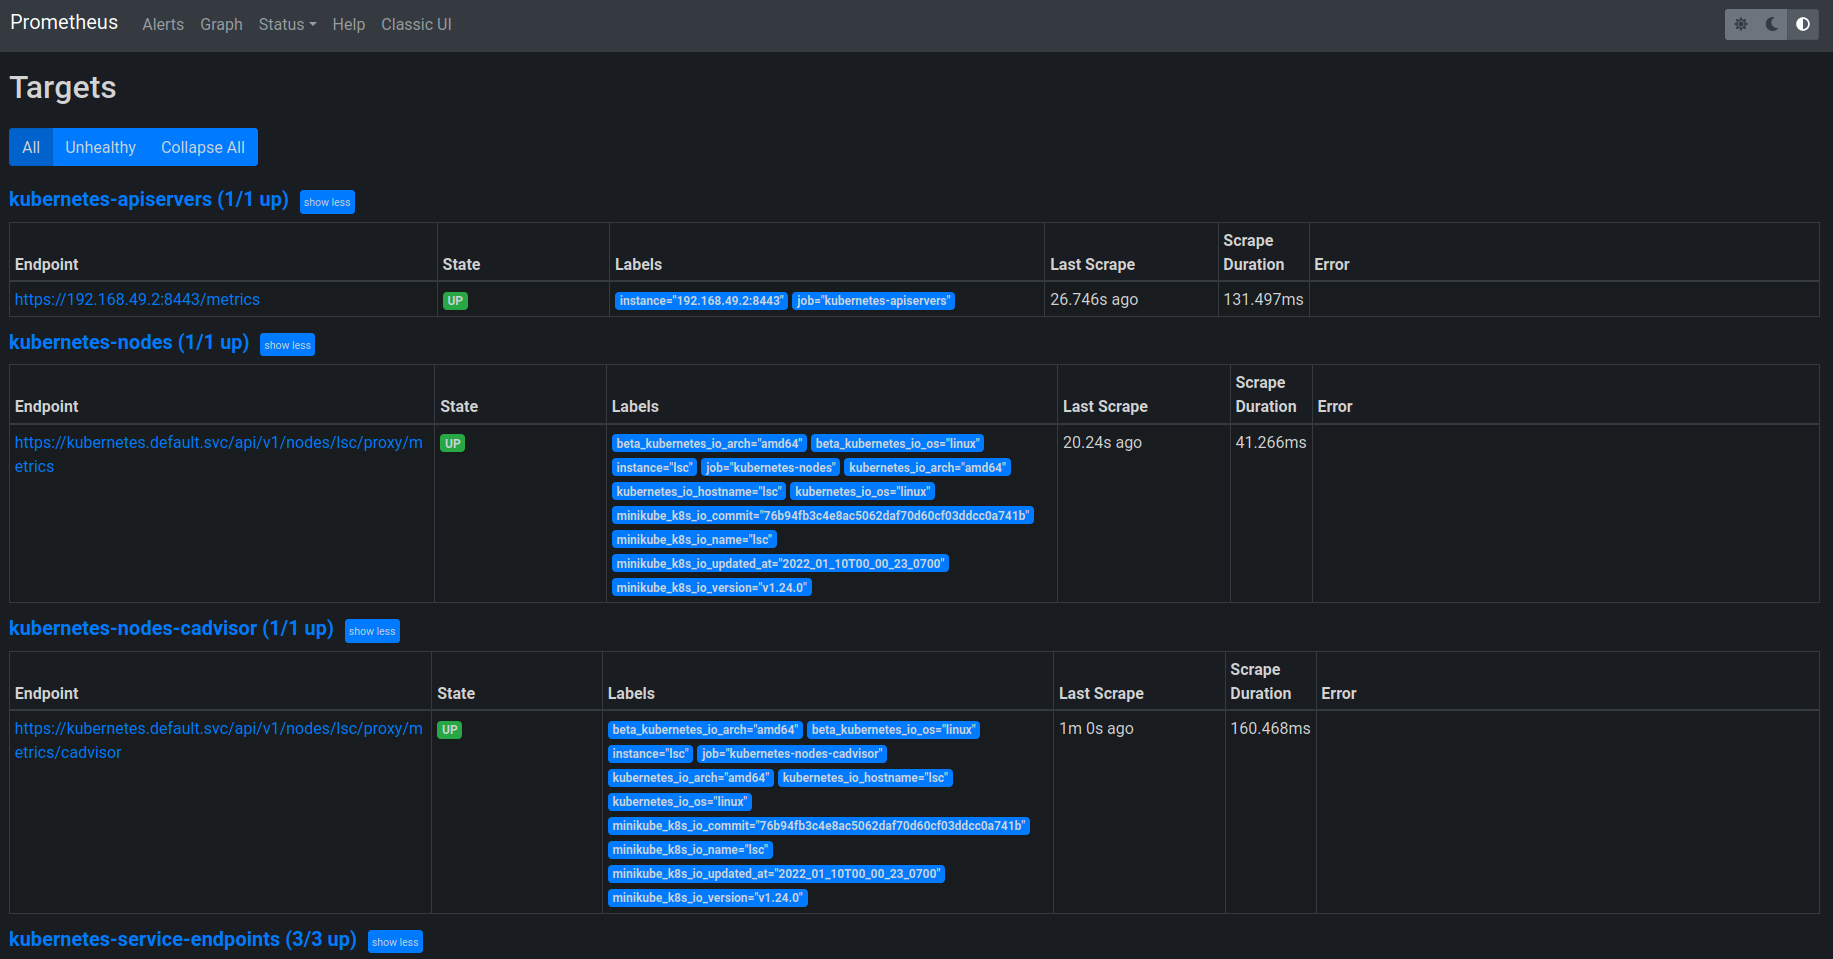
Prometheus is an open-source set of systems designed for monitoring and alerting. It is able to store metrics as time series data. It also does not need agents to push data directly into database, it has an opportunity tu pull metrics from defined endopints.
It is designed for high reliability, even under failure conditions, so it suits problems when 100% accuracy is not a crucial issue.
All data is stored as time series, defined here as streams of timestamped values belonging to one of defined metrics identified by unique metric names.
Like InfluxDB, Prometheus has also its own query language named PrometheusQL.
helm repo add prometheus-community https://prometheus-community.github.io/helm-charts
helm install prometheus prometheus-community/prometheus -n monitoringserver-url: http://prometheus-server.monitoring.svc:80
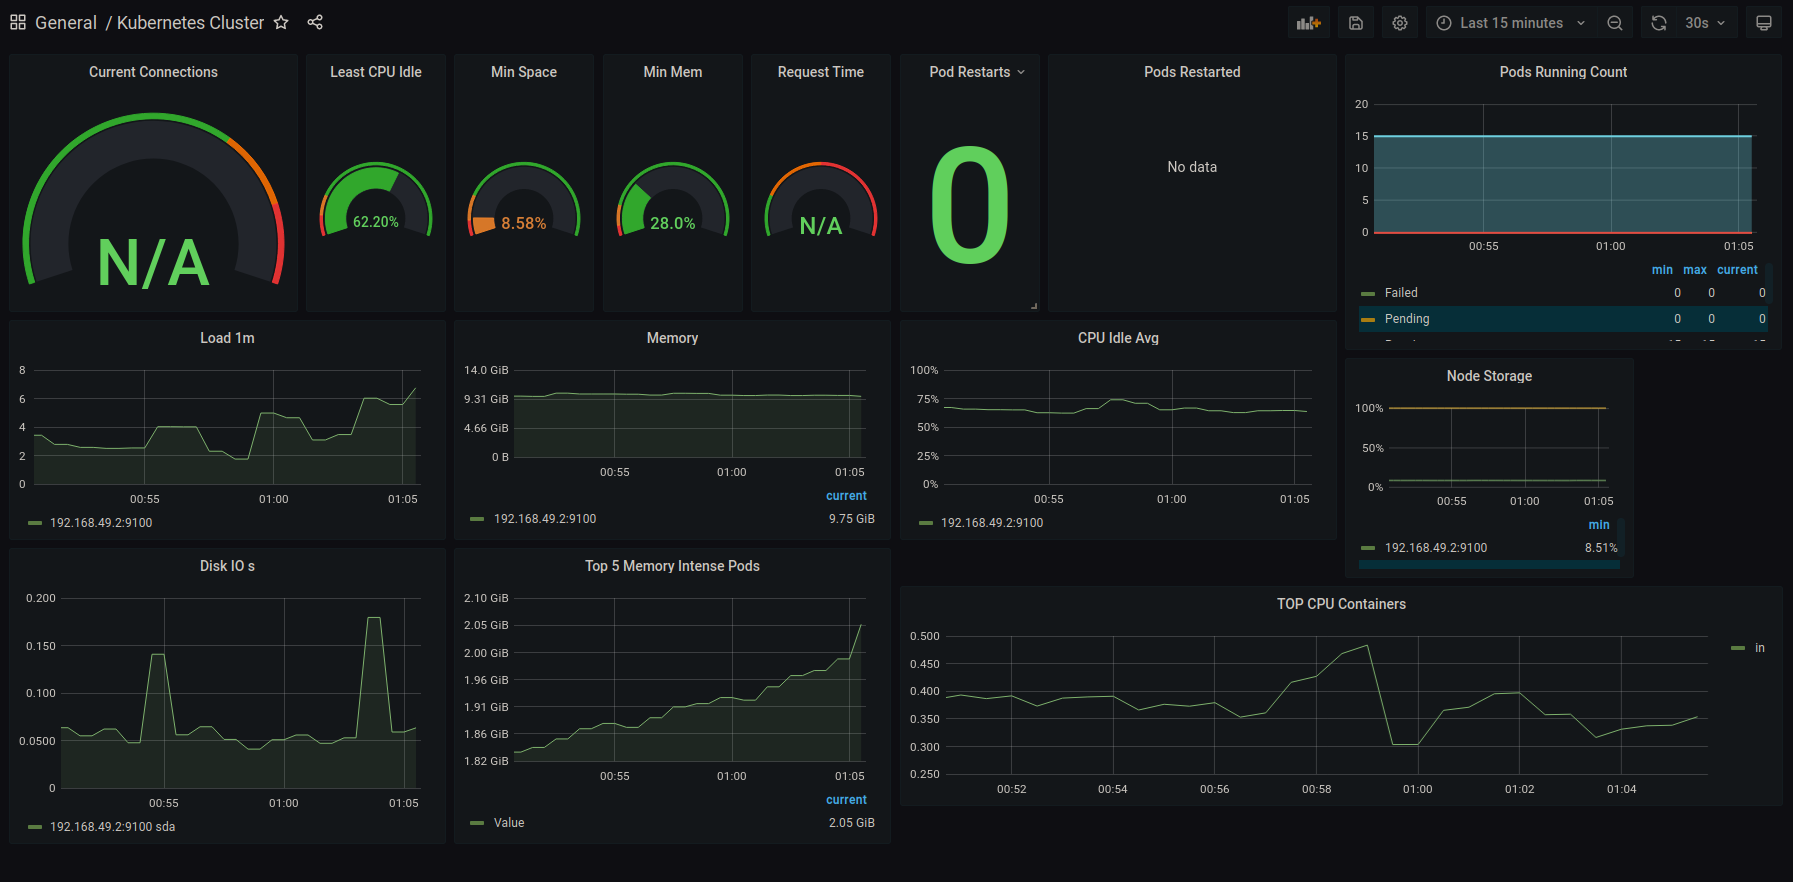
Grafana dashboard id - 7249 - Kubernetes Cluster
Promscale supports running Prometheus in High Availability (HA). This means that you can have multiple Prometheus instances running as "HA pairs". Such "HA pairs" (what we will call clusters from now on) are simply two or more identical Prometheus instances running on different machines/containers. These instances scrape the same targets and should thus have very similar data (the differences occur because scrapes happen at slightly different times). You can think of a cluster as a group of similar Prometheus instances that are all scraping the same targets and replicas as individual Prometheus instance in that group.
export POD_NAME=$(kubectl get pods --namespace monitoring -l "app=prometheus,component=server" -o jsonpath="{.items[0].metadata.name}")
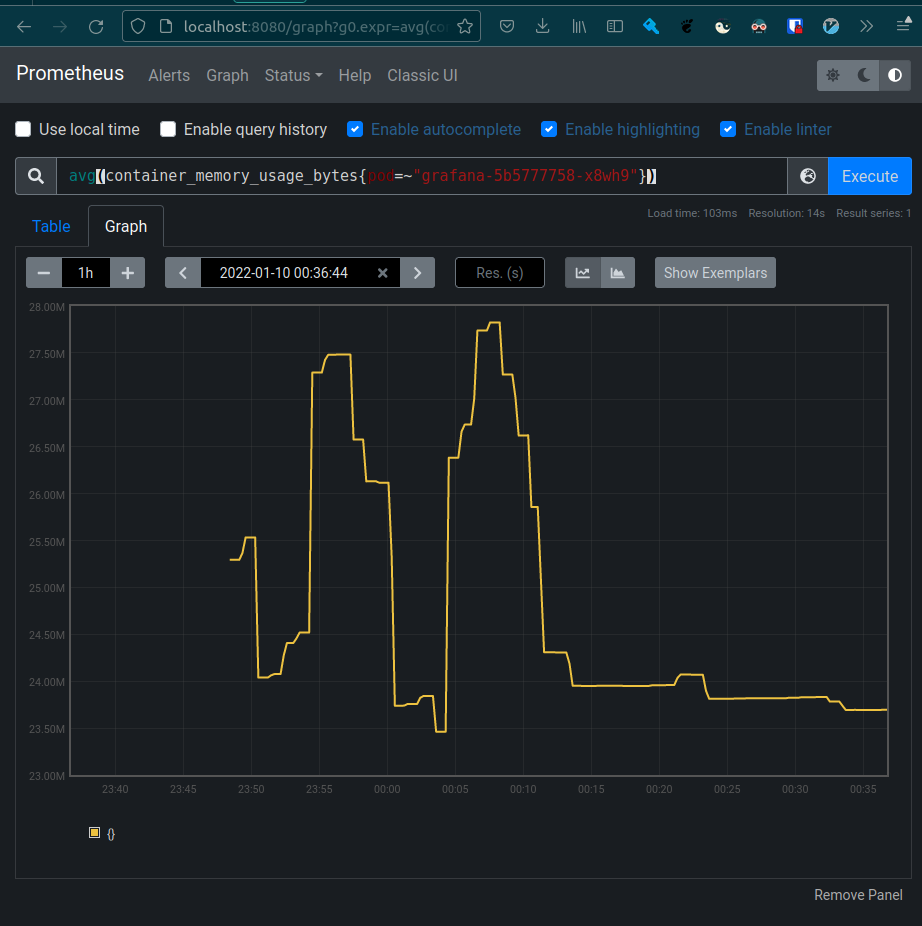
kubectl --namespace monitoring port-forward $POD_NAME 8080:9000Query:
avg(container_memory_usage_bytes{pod=~"grafana-5b5777758-x8wh9"})
Graphite is a project designed especially for monitoring metrics with push architecture - the tool is fed by external agents, e.g. collectd deamon. It is capable of storage of time series data and renedering graphs on user demand. It has its own dashboard for plotting pictures, however it is also easily pluggable into Grafana.
It was designed to be not too much demanding software, available also for cheaper architectures. It consists of 3 components:
- carbon - deamon listening for time-series data
- whisper - database library for storing time-series data
- graphite webapp - web application in Django responsible for graph rendering
The user's effort with usage of Graphite lays on collection of data and sending it to carbon.
Graphite is described as good horizontally scalling tool. It also is able to handle multiple data at a moment - I/O operations are usually small and even in the case of limited I/O operations of storage device it is able to keep data in cache until writing of all amount of it is possible.
$ helm repo add kiwigrid https://kiwigrid.github.io/
$ helm install graphite -n monitoring kiwigrid/graphite$ export POD_NAME=$(kubectl get pods --namespace monitoring -l "app.kubernetes.io/name=graphite,app.kubernetes.io/instance=graphite" -o jsonpath="{.items[0].metadata.name}")
$ echo "Visit http://127.0.0.1:8080 to use your application"
$ kubectl -n monitoring port-forward $POD_NAME 8080:80Used Graphite image automatically contains collectd deamon which is supporting metrics of the pod.
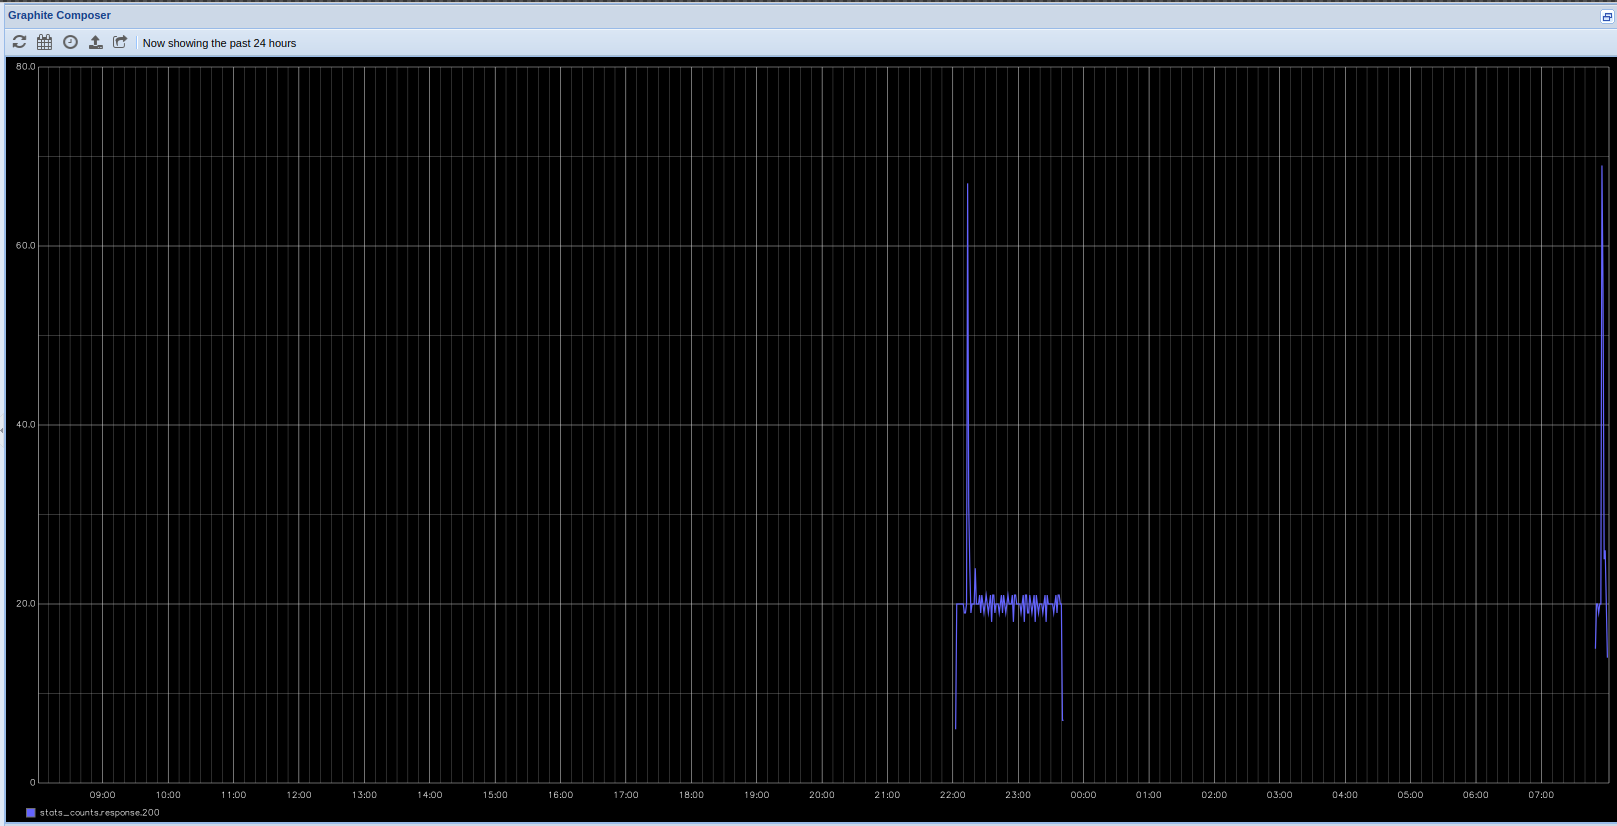
It is possible to view metrics directly from the Graphite dashboard, example with number of HTTP 200 responses is shown below:
Graphite has its own metrics format - a protoplast to linie protocol
TOKEN@.metricname value [timestamp]InfluxDB and Graphite are mostly focused on storage of time series data, while Prometheus is more complicated system which includes e.g. trending and alerting tools. What is more, Prometheus is more like a pull architecture while the others needs their data to be directly pushed to them.
In terms of data model the one used in Prometheus and InfluxDB is richer than in Graphite and allows user to explicitly declare dimensions of data which allows easy filtering and aggregation of it. Graphite data model is designed to better work with aggregated data while in the others it is possible to store separate similar fields.
InfluxDB has the most suitable data storage for event logging which is a variant of merge tree. Graphite data storage is simple and most suitable for data coming in equal time intervals, while Prometheus could handle short "impulses" of short-lived changing sets of time series.
- Michał Dygas
- Piotr Wróbel
