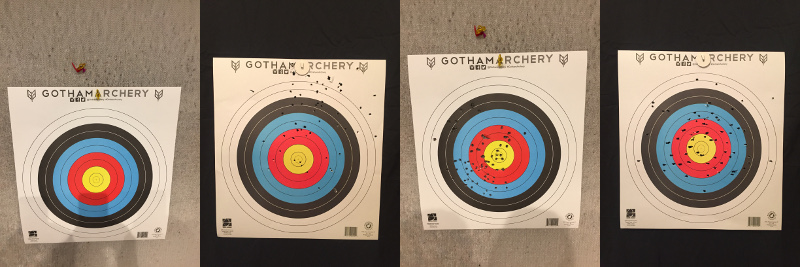
I've long been fascinated by computer vision and had been thinking about using it to develop an automatic archery scoring system for a while. A few years ago, I found out about an archery range (shout out to Gotham Archery!) that had just opened in my neighborhood and decided to check it out. I was hooked after the introductory class and have been shooting there regularly ever since. As I continued to work on improving my form, I found self-evaluation to be somewhat difficult and wanted to come up with a quick and simple way to calculate my scores and shot distributions. As I developed my skills at the Metis data science bootcamp, I started to get a clearer vision of how exactly I could build such a tool. My initial app idea involved live object tracking running on a mobile device, which I quickly realized might be too ambitious for a computer vision neophyte. I eventually settled on a plan to analyze a single target photo to derive shot positions and an average shot score for the session.
Before gathering my initial data, I set some restrictions on what each of those images would require. I wanted images to have all four corners of the target sheet visible so I could unskew and uniformly frame each one. Photos also needed to have enough contrast to pick out the target sheet and shot holes from the background. In order to keep the scope of the project manageable, I only used a single type of target: the traditional single-spot, ten ring variety. With those parameters in mind, I collected target data in two ways over several trips to the aforementioned Gotham Archery; I used my iPhone to photograph my target after each round of shooting at the range and also collected several used targets others had shot from the range's discard bin. I set up a small home studio to quickly shoot the gathered targets but did not use any special lighting, camera equipment, or a tripod because I wanted the images to represent what an app user could easily produce themselves. I ended up collecting around 40 usable targets (some were too creased or torn) and set aside 11 of those to use as a test set to evaluate the app's performance.
With my data in hand I was ready to start writing some code to process my image data into qualitative values, which meant choosing between one of a couple diverging approaches. Either training a Convolutional Neural Network or a more manual image processing approach would work to calculate scores, but both options come with benefits and important limitations:
| Algorithm | Pros | Cons |
|---|---|---|
| CNN | Probably less coding | Might need more data |
| High personal interest | Only good for score data | |
| Manual Processing | Needs less data | Probably more coding |
| Good for scores and positional data | Less sexy |
Going with a neural network may have been difficult due to the small number of targets I had collected. Even though I could have boosted the dataset by taking multiple photographs of each target from different angles and orientations I'm still not sure I would have had enough to train a quality model. However the real dealbreaker for me was that a CNN would not be able to provide me with shot coordinates, which I really wanted to help break down an archer's inconsistencies. Heavily processing images with OpenCV was simply the better solution for my problem, no matter how much I would have liked to work with neural networks on this project.
OpenCV has a vast selection of image processing tools that can be intimidating at first glance and I spent the first few days working with the library just learning what commands might prove useful. Between my own exploration and reading a few blogs, like the incredibly helpful pyimagesearch, I was able to work out the common strategy of filter-gather-transform. I applied filters to an image in order to gather specific data that I would then use to transform the image somehow. For example, in order to remove perspective skew, I found the corners of the target sheet and then used their coordinates to pull those edges to the corners of the image. I repeated the filter-gather-transform process several times in order to consistently frame targets and then acquire shot positions. I broke down the work into roughly 12 steps:
- Import image and set color space
- Find target sheet corners
- Remove perspective skew
- Find scoring region circles
- Resize image into a square with circles centered
- Separate image by background color
- Balance values of each part to make holes stand out
- Recombine image
- Obscure logos at bottom of target sheet
- Use blob detection to find holes
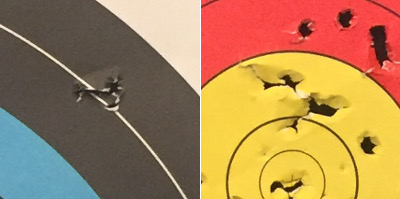
- Split up large blobs that are clusters of shots
- Calculate shot scores based on distance from center
Here are some sample images showing what a target looks like at various steps:

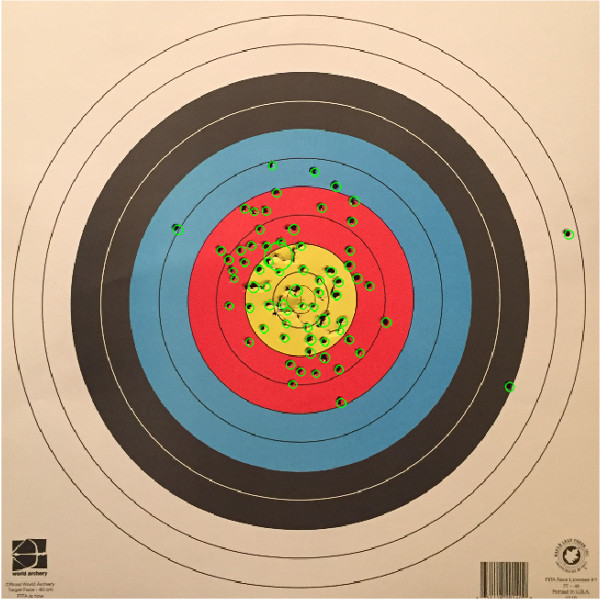
You can check out larger versions of the images in the 'shotplot.ipynb' notebook, which runs through the entire shot identification process. The actual code for the OpenCV processing lives in target_reader.py so that it can be easily imported into both a notebook and the Flask app script. Here is a sample image of a target with identified shots circled:
In order to evaluate the performance of my image processing code, I manually identified shots on my eleven-target test set and compared the results to what my algorithm found. I then compiled a confusion matrix and recall and precision values for the over 500 shots in the test set:
| Metric | Score |
|---|---|
| Test Set Recall | .955 |
| Test Set Precision | .983 |
| Not Labeled a Shot | Labeled a Shot | |
|---|---|---|
| Not Actually a Shot | N/A* | 9 |
| Actually a Shot | 25 | 530 |
* Too many to count
In practice, I was constantly testing the performance of my code against different targets in my 'training' set and making adjustments when necessary. I certainly became more dilligent about testing after an early mishap resulted in my algorithm 'overfitting' a specific kind of target image and perform significantly worse against others. Another issue I encountered is the subjectivity of shot identification: determining how many shots created some holes is difficult if not impossible. Fortunately, manually identifying most shots is straightforward so I do not think the evaluation statistics would change significantly based on another person's shot identifications.
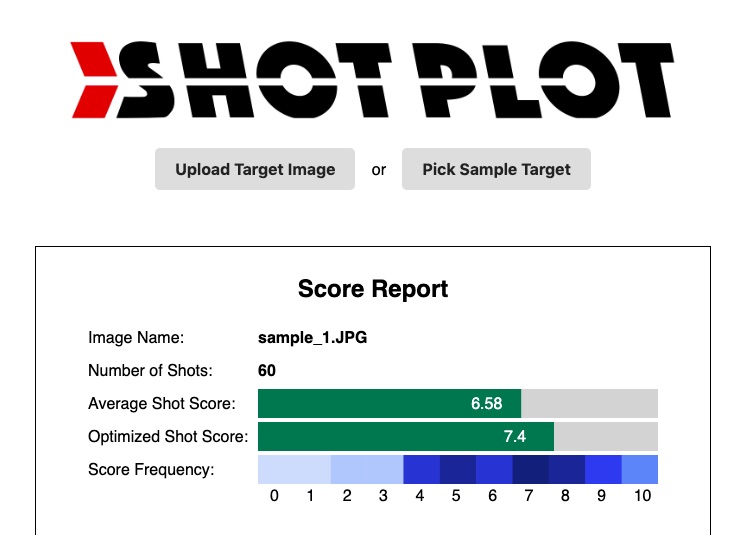
ShotPlot is live on Heroku, feel free to try it out! I built the app in Flask and relied heavily upon the D3.js library for visualization. This project was my first foray into D3 and I greatly valued the flexibility and customizability it offers. Other visualization software and libraries like Tableau and Matplotlib had less startup cost but couldn't faithfully reproduce the clear vision I had in mind for the app. Using D3 also leaves open the possibility of adding interactive features to the charts themselves in future development.
Overall I'm pleased with the results of my first attempt at implementing both computer vision and D3 visualization into a completed project. Although ShotPlot succesfully identifies the vast majority of all shots, it does tend to miss a few that are clearly visible, which I'd like to address in future updates. I also removed some information by obscuring the logos at the bottom of the targets because parts of them were getting misidentified as shots. Ideally I'd like to find a better solution that counts shots in those areas and will be testing some alternatives like using template matching to isolate abnormalities that could be identified as shots. Along with performance improvements, I'm aiming to get the app working properly on smartphones since that is the platform on which it's most likely to be used. I'd also like to expand the visualizations to really take advantage of D3's ability to create interactive charts. My long-term goals for ShotPlot include adding analyses across multiple sessions and support for multiple target types and shooting styles.


