spnethack
The goal of spnethack is to explore spatial networks in R.
Requirements
We’ll use the following packages:
library(sf)
library(osmdata)
library(dodgr)
library(stplanr)
library(dplyr)
library(piggyback)
library(tidygraph)
library(sfnetworks)
Data
It makes sense to have some input data.
From josm
Data from OSM was downloaded with the josm GUI. It can be read-in as
follows:
pb_download("promenade-all.geojson")
promenade_all = read_sf("promenade-all.geojson")
summary(factor(promenade_all$highway))
promenade_min = promenade_all %>%
  filter(name == "Promenade")

summary(is_linestring)
promenade_way = promenade_all %>%
  filter(!is.na(highway)) %>%
  filter()
# write_sf(promenade_way, "promenade-way.geojson")
# write_sf(promenade_min, "promenade-min.geojson")
The minimum dataset can be read-in as follows:
pb_download("promenade-min.geojson")
#> ✔ Setting active project to '/home/robin/repos/spnethack'
#> All files up-to-date already
promenade_min = read_sf("promenade-min.geojson")
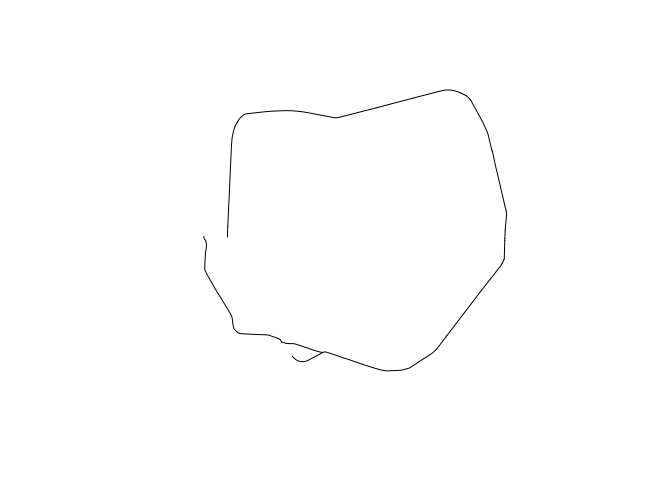
plot(promenade_min$geometry)
A slightly larger dataset can be read-in and plotted as follows:
pb_download("promenade-way.geojson")
#> All files up-to-date already
promenade_way = geojsonsf::geojson_sf("promenade-way.geojson")
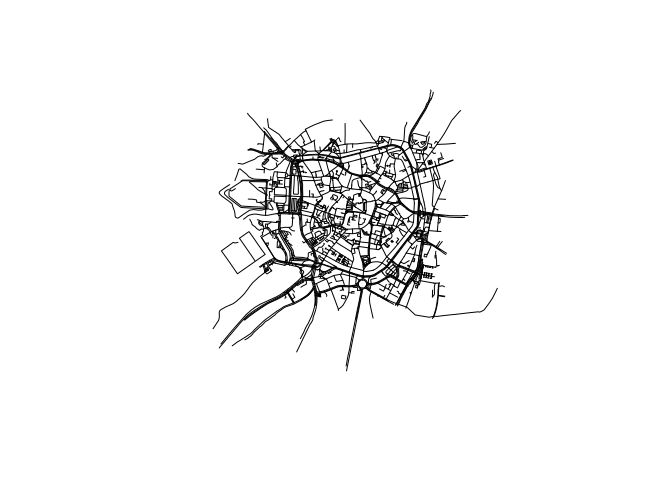
plot(promenade_way$geometry)summary(factor(st_geometry_type(promenade_way)))
#> LINESTRING
#> 2020
is_point = st_geometry_type(promenade_way) == "POINT"
promenade_way = promenade_way[!is_point, ]
promenade_way = st_cast(promenade_way, "LINESTRING")From osmdata
promenade_osmdata = opq(bbox = 'Muenster, DE') %>%
  add_osm_feature(key = 'name', value = 'Promenade') %>%
  osmdata_sf %>%
  unique_osmdata()
From dodgr
muenster = dodgr_streetnet('Muenster, DE')
promenade_dodgr = muenster %>% filter(name == 'Promenade')
Route networks with stplanr
The code to create route network data is in stplanr-promenade.R. It
can generate a ‘betweenness’ graph like this:
source(file = "stplanr-promenade.R")Route networks with dodgr
An example of how to create route data from sample points along the
edges can be found dodgr-promenade.R, it can also generate a flow
aggregate which is quite similar to the betweenness.
source(file = "dodgr-promenade.R")
dodgr_flowmap(graph_f, linescale = 5)
To do this we can use all the points in the data 430 points on the to
column and the same number on the from, and it takes 0.6 sec.
Route networks with sfnetworks
p_sfn = sfn_asnetwork(promenade_min)
plot(p_sfn)
p_graph = sfn_network2graph(p_sfn)
b = igraph::edge.betweenness(p_graph)
plot(p_sfn, lwd = b / mean(b))Munster example
p_sfn = sfn_asnetwork(promenade_way)
plot(p_sfn)
i = sfn_network2graph(p_sfn)
b = igraph::edge.betweenness(i)
p_sfn$edges$b = b
plot(p_sfn, lwd = b / mean(b))
Route networks with spnetwork
Route networks with osmnx
Route networks with tidygraph
rtg = as_tbl_graph(x = rstp@g)
class(rtg)
#> [1] "tbl_graph" "igraph"
length(rtg)
#> [1] 10
rtg$geometry = promenade_min$geometry
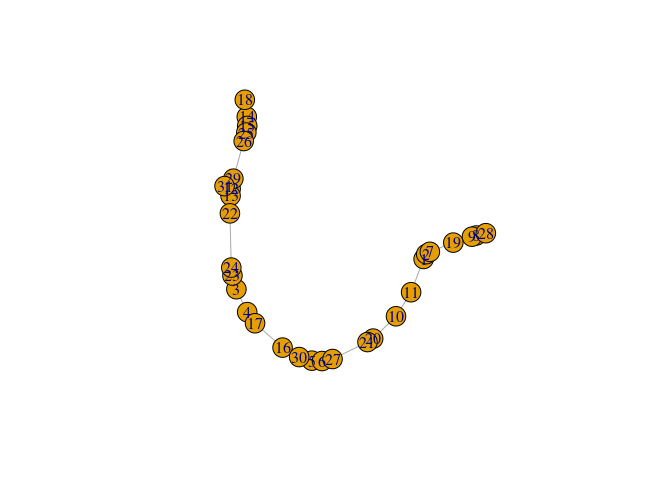
plot(rtg)plot(rtg$geometry)# But fails with subsetting...
rtg_sub = rtg[1:5, ]
rtg_sub
#> 5 x 31 sparse Matrix of class "dgCMatrix"
#>
#> [1,] . 388.3444 . . . . . . . .
#> [2,] 388.3444 . . . . . 663.5711 . . .
#> [3,] . . . 25.28429 . . . . . .
#> [4,] . . 25.28429 . . . . . . .
#> [5,] . . . . . 155.1238 . . . .
#>
#> [1,] 6.592897 . . . . . . . . . . . . . . . . . . . .
#> [2,] . . . . . . . . . . . . . . . . . . . . .
#> [3,] . . . . . . . . . . . . 84.70141 . . . . . . . .
#> [4,] . . . . . . 83.52986 . . . . . . . . . . . . . .
#> [5,] . . . . . . . . . . . . . . . . . . . 87.09183 .Converting tidygraph into sf objects
rtg_edges = activate(rtg,edges) %>% mutate(geometry = promenade_min$geometry)

st_as_sf(as.tibble(rtg_edges))
Benchmark
system.time({rnet1 = SpatialLinesNetwork(promenade_way)})
class(rnet1)
system.time({
  rnet2 = sfn_asnetwork(promenade_way)
  i = sfn_network2graph(rnet2)
})
object.size(rnet1)
object.size(rnet2)


