In this code pattern, we will use a Jupyter notebook to glean insights from a vast body of unstructured data. We'll start with data exported from Facebook Analytics. We'll enrich the data with Watson’s Natural Language Understanding (NLU), Tone Analyzer and Visual Recognition. Credit goes to Anna Quincy and Tyler Andersen for providing the initial notebook design.
We'll use the enriched data to answer questions like:
What sentiment is most prevalent in the posts with the highest engagement performance?
What are the relationships between social tone of article text, the main article entity, and engagement performance?
These types of insights are especially beneficial for marketing analysts who are interested in understanding and improving brand perception, product performance, customer satisfaction, and ways to engage their audiences.
It is important to note that this code pattern is meant to be used as a guided experiment, rather than an application with one set output. The standard Facebook Analytics export features text from posts, articles, and thumbnails, along with standard Facebook performance metrics such as likes, shares, and impressions. This unstructured content was then enriched with Watson APIs to extract keywords, entities, sentiment, and tone.
After data is enriched with Watson APIs, there are several different types of ways to analyze it. Watson Studio provides a robust, yet flexible method of exploring the unstructured, enriched Facebook content.
This code pattern provides mock Facebook data, a notebook, and comes with several pre-built visualizations to jump start you with uncovering hidden insights.
When the reader has completed this code pattern, they will understand how to:
- Read external data in to a Jupyter Notebook via Object Storage and pandas DataFrames.
- Use a Jupyter notebook and Watson APIs to enrich unstructured data using:
- Write data from a pandas DataFrame in a Jupyter Notebook out to a file in Object Storage.
- Visualize and explore the enriched data with PixieDust.

- A CSV file exported from Facebook Analytics is added to Object Storage.
- Generated code makes the file accessible as a pandas DataFrame.
- The data is enriched with Natural Language Understanding.
- The data is enriched with Tone Analyzer.
- The data is enriched with Visual Recognition.
- The enriched data can be explored with PixieDust to uncover hidden insights and create graphics to highlight them.
- IBM Watson Studio: Analyze data using RStudio, Jupyter, and Python in a configured, collaborative environment that includes IBM value-adds, such as managed Spark.
- IBM Cloud Object Storage: An IBM Cloud service that provides an unstructured cloud data store to build and deliver cost effective apps and services with high reliability and fast speed to market.
- Watson Natural Language Understanding: Natural language processing for advanced text analysis.
- Watson Tone Analyzer: Uses linguistic analysis to detect communication tones in written text.
- Watson Visual Recognition: Understand image content.
- Jupyter Notebooks: An open-source web application that allows you to create and share documents that contain live code, equations, visualizations and explanatory text.
- PixieDust: PixieDust is an open source helper library that works as an add-on to Jupyter notebooks to improve the user experience of working with data.
- pandas: A Python library providing high-performance, easy-to-use data structures.
- Beautiful Soup: Beautiful Soup is a Python library for pulling data out of HTML and XML files.
Follow these steps to setup and run this code pattern. The steps are described in detail below.
- Create a new Watson Studio project
- Add services to the project
- Create the notebook in Watson Studio
- Add credentials
- Add the CSV file
- Run the notebook
- Analyze the results
- Save your work
-
Log into IBM's Watson Studio. Once in, you'll land on the dashboard.
-
Create a new project by clicking
New project +and then click onCreate an empty project. -
Enter a name for the project name and click
Create.NOTE: By creating a project in Watson Studio a free tier
Object Storageservice andWatson Machine Learningservice will be created in your IBM Cloud account. Select theFreestorage type to avoid fees. -
Upon a successful project creation, you are taken to the project
Overviewtab. Take note of theAssetsandSettingstabs, we'll be using them to associate our project with any external assets (datasets and notebooks) and any IBM cloud services.
-
Associate the project with Watson services. To create an instance of each service, go to the
Settingstab in the new project and scroll down toAssociated Services. ClickAdd serviceand selectWatsonfrom the drop-down menu. Add the service using the freeLiteplan. Repeat for each of the services used in this pattern:- Visual Recognition
- Natural Language Understanding
- Tone Analyzer
-
Once your services are created, copy the credentials and save them for later. You will use them in your Jupyter notebook.
- Use the upper-left
☰menu, and selectServices > Watson Services. - Use the 3-dot actions menu to select
Manage in IBM Cloudfor each service. - Copy each
API KeyandURLto use in the notebook.
- Use the upper-left
-
From the new project
Overviewtab, click+ Add to projecton the top right and choose theNotebookasset type.
-
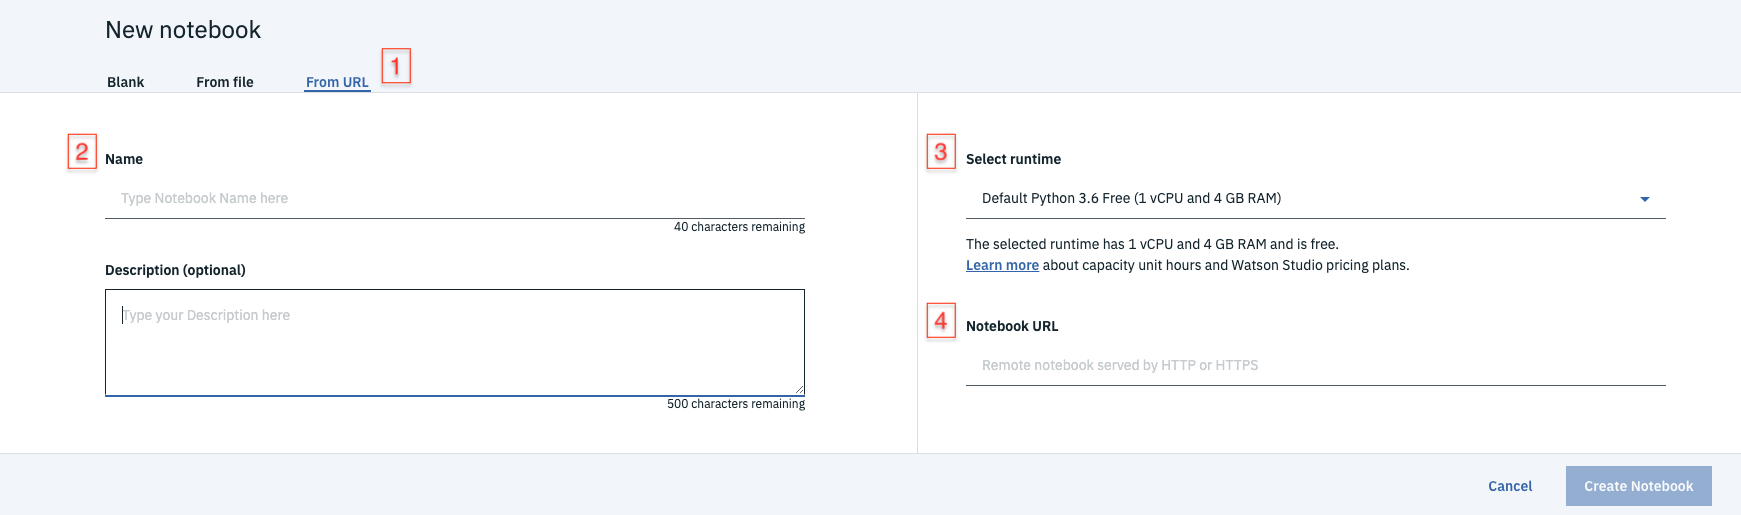
Fill in the following information:
- Select the
From URLtab. [1] - Enter a
Namefor the notebook and optionally a description. [2] - For
Select runtimeselect theDefault Python 3.6 Freeoption. [3] - Under
Notebook URLprovide the following url [4]:https://raw.githubusercontent.com/IBM/pixiedust-facebook-analysis/master/notebooks/pixiedust_facebook_analysis.ipynb
- Select the
-
Click the
Create Notebookbutton.TIP: Your notebook will appear in the
Notebookssection of theAssetstab.

Find the notebook cell after 1.5. Add Service Credentials From IBM Cloud for Watson Services.
Replace the six placeholder values with information from the Service Credentials tab for each service.

Note: This cell is marked as a
hidden_cellbecause it will contain sensitive credentials.
Use Find and Add Data (look for the 10/01 icon) and its Files tab. From there you can click browse and add a .csv file from your computer.

Note: If you don't have your own data, you can use our example by cloning this git repo. Look in the
datadirectory.
Find the notebook cell after 2.1 Load data from Object Storage. Place your cursor after # **Insert to code > Insert pandas DataFrame**. Make sure this cell is selected before inserting code.
Using the file that you added above (under the 10/01 Files tab), use the Insert to code drop-down menu. Select Insert pandas DataFrame from the drop-down menu.

Note: This cell is marked as a
hidden_cellbecause it contains sensitive credentials.

The inserted code includes a generated method with credentials and then calls the generated method to set a variable with a name like df_data_1. If you do additional inserts, the method can be re-used and the variable will change (e.g. df_data_2).
Later in the notebook, we set df = df_data_1. So you might need to fix the variable name df_data_1 to match your inserted code or vice versa.
We want to write the enriched file to the same container that we used above. So now we'll use the same file drop-down to insert credentials. We'll use them later when we write out the enriched CSV file.
After the df setup, there is a cell to enter the file credentials. Place your cursor after the # insert credentials for file - Change to credentials_1 line. Make sure this cell is selected before inserting credentials.
Use the CSV file's drop-down menu again. This time select Insert Credentials.

Note: This cell is marked as a
hidden_cellbecause it contains sensitive credentials.
The inserted code includes a dictionary with credentials assigned to a variable with a name like credentials_1. It may have a different name (e.g. credentials_2). Rename it or reassign it if needed. The notebook code assumes it will be credentials_1.
When a notebook is executed, what is actually happening is that each code cell in the notebook is executed, in order, from top to bottom.
Each code cell is selectable and is preceded by a tag in the left margin. The tag format is In [x]:. Depending on the state of the notebook, the x can be:
- A blank, this indicates that the cell has never been executed.
- A number, this number represents the relative order this code step was executed.
- A
*, this indicates that the cell is currently executing.
There are several ways to execute the code cells in your notebook:
- One cell at a time.
- Select the cell, and then press the
Playbutton in the toolbar.
- Select the cell, and then press the
- Batch mode, in sequential order.
- From the
Cellmenu bar, there are several options available. For example, you canRun Allcells in your notebook, or you canRun All Below, that will start executing from the first cell under the currently selected cell, and then continue executing all cells that follow.
- From the
- At a scheduled time.
- Press the
Schedulebutton located in the top right section of your notebook panel. Here you can schedule your notebook to be executed once at some future time, or repeatedly at your specified interval.
- Press the
If you walk through the cells, you will see that we demonstrated how to do the following in Part I:
- Install external libraries from PyPI
- Create clients to connect to Watson cognitive services
- Load data from a local CSV file to a pandas DataFrame (via Object Storage)
- Do some data manipulation with pandas
- Use BeautifulSoup
- Use Natural Language Understanding
- Use Tone Analyzer
- Use Visual Recognition
- Save the enriched data in a CSV file in Object Storage
In Part II, we used pandas to create multiple DataFrames from our main enriched DataFrame. After slicing and dicing and cleaning, these new DataFrames are ready for PixieDust to use.
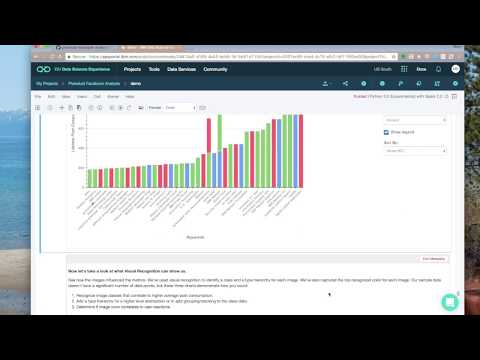
In Part III, we analyze the results by exploring and visualizing the metrics with PixieDust.
After all the prep work done earlier, you'll see that there is almost no code needed here (thanks to PixieDust). We just use one-liners like this:
display(<data-frame>)You should also notice that we used display(tones) in two different cells, but the result was two different charts. How can that happen? Well, we used cell metadata to tell PixieDust how to display the data. Notice the Edit Metadata button on each cell. If you don't see it, use the menu View > Cell Toolbar > Edit Metadata to make it visible. If you look at the metadata for the first two charts, you'll see how we got a bar chart and a pie chart.
PixieDust is interactive! This is where we explore to find out what the enriched data will tell us.
Use the Options button to change the chart settings. The first chart shows post consumption by the detected emotion in the article. Notice how changing the aggregation type from SUM to AVG gives you a very different conclusion. You can also change it to COUNT to see the frequency of each emotion, but when you do that the metric no longer matters.
Explore by trying the following:
- Use social tone as the key instead of emotion tone (or both).
- Try other metrics such as lifetime negative feedback from users.
- Try the different renderers.
- Try different chart types (and a grid).
The right combination will give you insights into the impact of your facebook posts. Once you uncover the insights, find the best presentation to convince others.
Under the File menu, there are several ways to save your notebook:
Savewill simply save the current state of your notebook, without any version information.Save Versionwill save your current state of your notebook with a version tag that contains a date and time stamp. Up to 10 versions of your notebook can be saved, each one retrievable by selecting theRevert To Versionmenu item.
The example output in examples has embedded JavaScript for PixieDust charts. View it via nbviewer
Note: Some interactive functionality might not work in the saved example. Run the notebook for full functionality. To see the code and markdown cells without output, you can view notebooks/pixiedust_facebook_analysis.ipynb with the Github viewer.
- Artificial Intelligence Code Patterns: Enjoyed this Code Pattern? Check out our other AI Code Patterns
- Data Analytics Code Patterns: Enjoyed this Code Pattern? Check out our other Data Science Code Patterns
- AI and Data Code Pattern Playlist: Bookmark our playlist with all of our Code Pattern videos
This code pattern is licensed under the Apache License, Version 2. Separate third-party code objects invoked within this code pattern are licensed by their respective providers pursuant to their own separate licenses. Contributions are subject to the Developer Certificate of Origin, Version 1.1 and the Apache License, Version 2.