The goal of this lab is to use machine learning techniques to build models that allow to recognize patterns of technical analysis within a series of prices. In its simplest form these models can be approached as a binary classification task in which the model is capable of identify:
- Positive class: There is a pattern in a time window. Example a double bottom pattern.
- Negative class: The pattern of interest does not exist in the indicated time window.
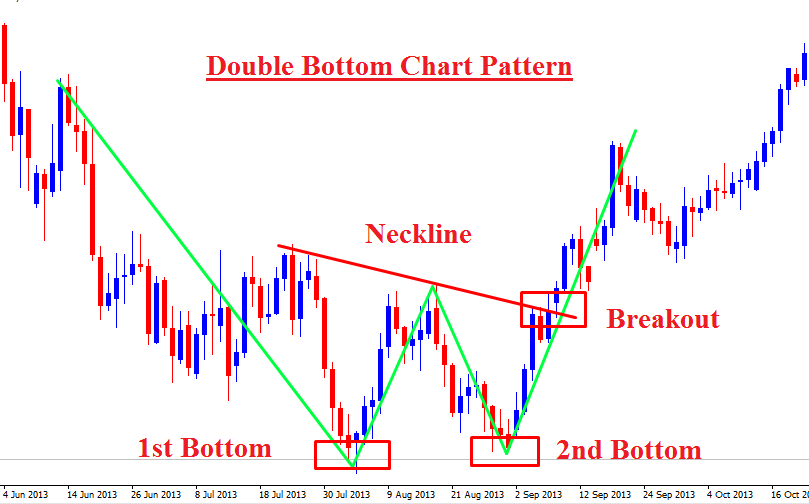
An example of a positive class would be:
The lab should be done in Python notebooks using the sklearn library. It can be used any other library deemed necessary.
In this version it is required to generate a model that classifies a double bottom pattern and show the results that show that said model is better than randomness. Optionally, the student can choose a different technical pattern that is of interest to you. The suggested steps are:
- Label the temporary windows of the IBEX as positive and negative examples with the notebook of labeling. It is suggested to have at least 60 plots.
- Extract the OHLC strings from the labeled windows.
- Generate features that are considered interesting to recognize the pattern from the data of the temporary window (see comments below).
- Train a model of those seen in class by separating the data in train/test.
- Report the evaluation results that can be included in a notebook with the code for generate them. The evaluation should include:
- A confusion matrix
- Accuracy and AUROC results
- A ROC curve
Regarding the generation of characteristics, it is recommended to generate simple functions that calculate values that help to distinguish some series from others, regardless of the pattern that is being searched for. What the windows would have a different price scale, it is necessary that the characteristics are normalized. Some examples can be:
- Number of days that pass between the maximum and the minimum of the window
- If the maximum or minimum occurs first
- Number of times in the window that a certain threshold is reached
In this part, it is requested to address the problem as a multiclass classification so that they can be recognized at the same time several technical figures. A simple scheme would be to have, for example, a double bottom, a double top and without pattern. Suggested tasks are:
- Carry out steps 1 to 3 of the first iteration, but taking into account the required considerations for the multiclass problem.
- Train classifiers using 3 different algorithms, and choose the best one based on accuracy estimated with cross validation.
- Report the evaluation of the best model on a separate test set. Here should be included precision and sensitivity, by class and in their micro-average and macro-average versions.
The submitted file must contain:
- The notebooks that generate the models and report the results of the practice.
- The series of manually labeled windows, saved in CSV format.