When making trading decisions, we can utilize several different information sources on our technical analysis. One of these sources is OHLC (open, high, low, close) data. Candlestick charts can be plotted to extract patterns from OHLC data for any tradable instrument.
A candlestick pattern is a movement in prices shown graphically on a candlestick chart that some believe can predict a particular market movement.
For each asset, each day, buy at the opening price and sell when the first of the following events occurs:
-
Assets go up 3 cents (stop profit)
-
The asset falls 10 cents (stop loss)
If none of the above occurs, sell at closing price.
Be careful, there will be positive and negative days at the same time, in these cases, we suppose that you play the stop loss first.
The capital that we invest in each asset, every day, must be € 30,000.
The commission for each purchase and sale will be 0.0003 * capital.
A R script that generates a dataframe with the following structure (for all assets) with the following indexes per row:
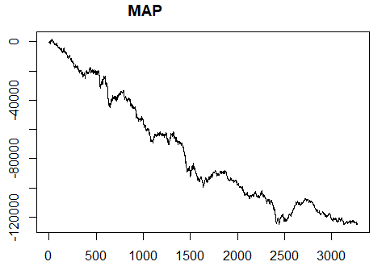
And plot the accumulated profit per asset. For example:


