In recent months Florian Wetschoreck published a story on Toward Data Science's Medium channel that attracted the attention of many data scientists on LinkedIn thanks to its very provocative title: "RIP correlation. Introducing the Predictive Power Score".
The Predictive Power Score (PPS) is a normalized index (it ranges from 0 to 1) that tells us how much the variable x (be it numerical or categorical) could be used to predict the variable y (numerical or categorical). The higher the PPS index, the more the variable x is decisive in predicting the variable y.
I wrote a blog a post to summarize the pros and cons of this new index:
Using The Predictive Power Score in R
I also collected all the R code needed to reproduce the examples shown in the blog post into this repository.
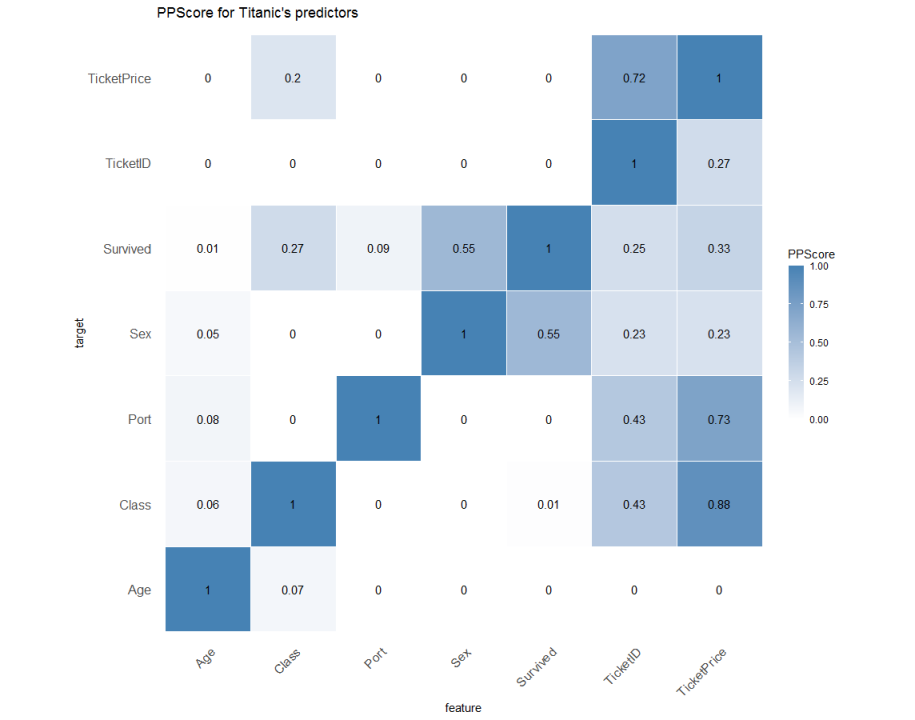
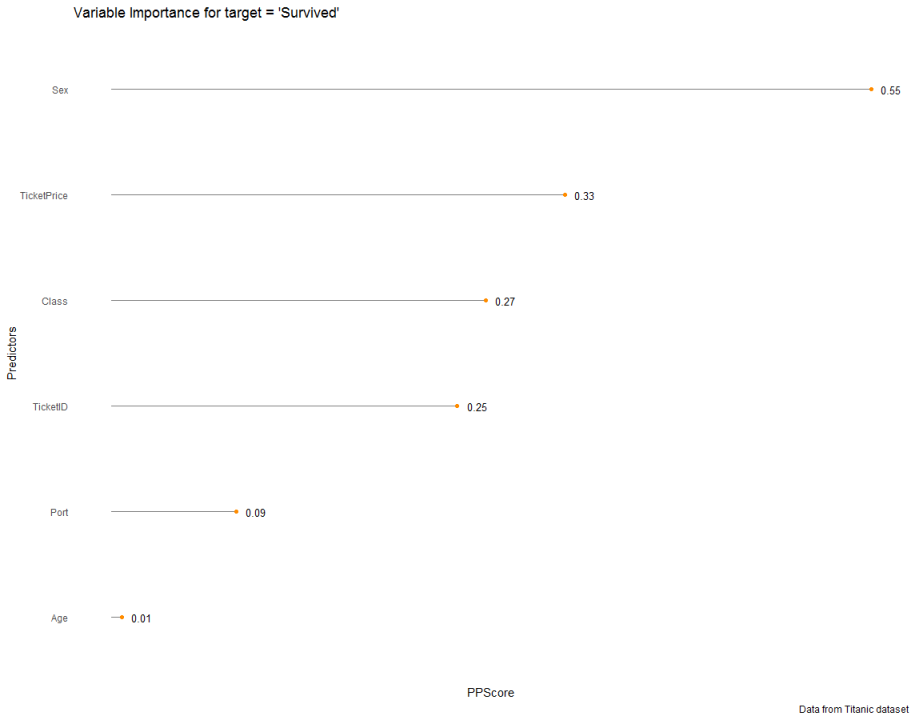
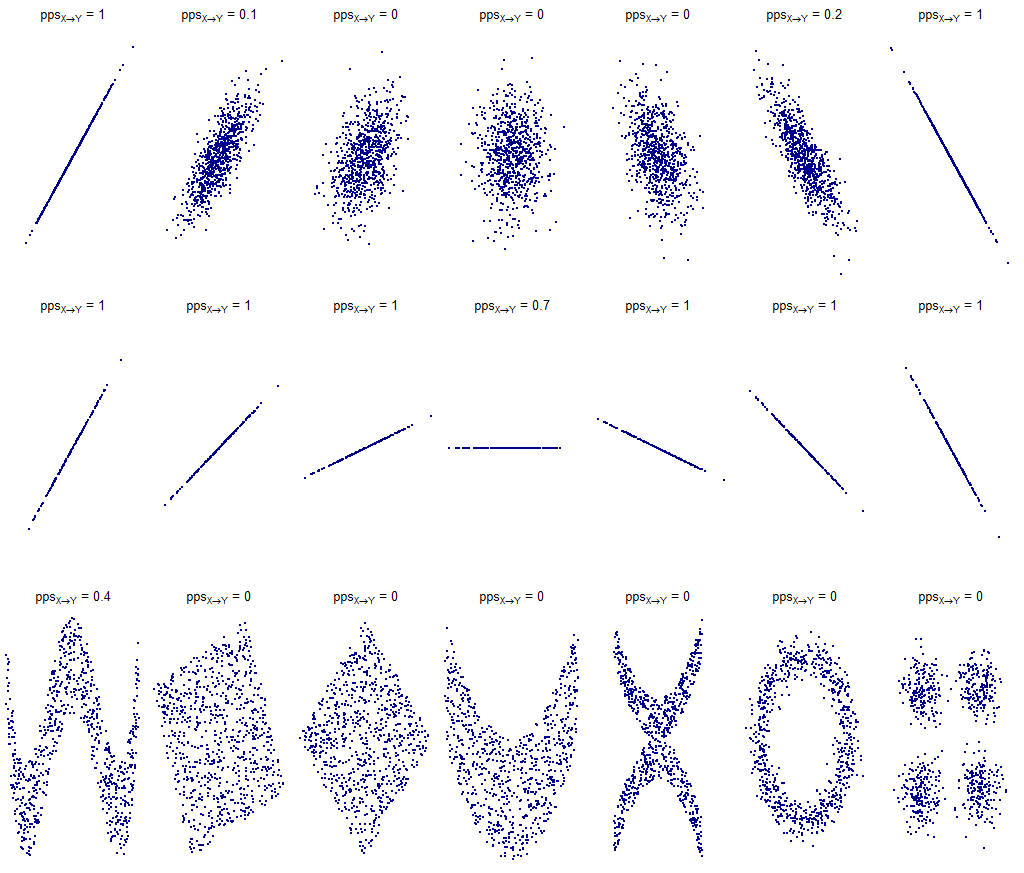
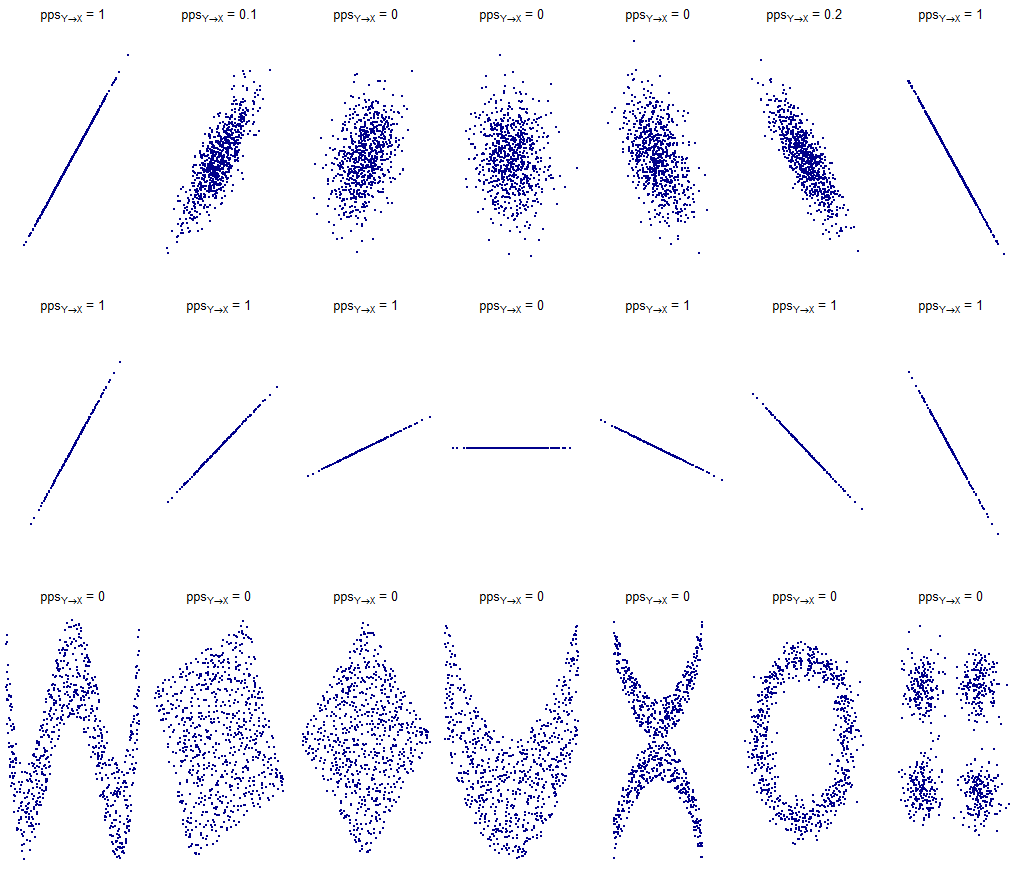
Here are some graphs obtained thanks to the aforementioned R code. The PPScore version used to get the shown results is 1.1.0.


