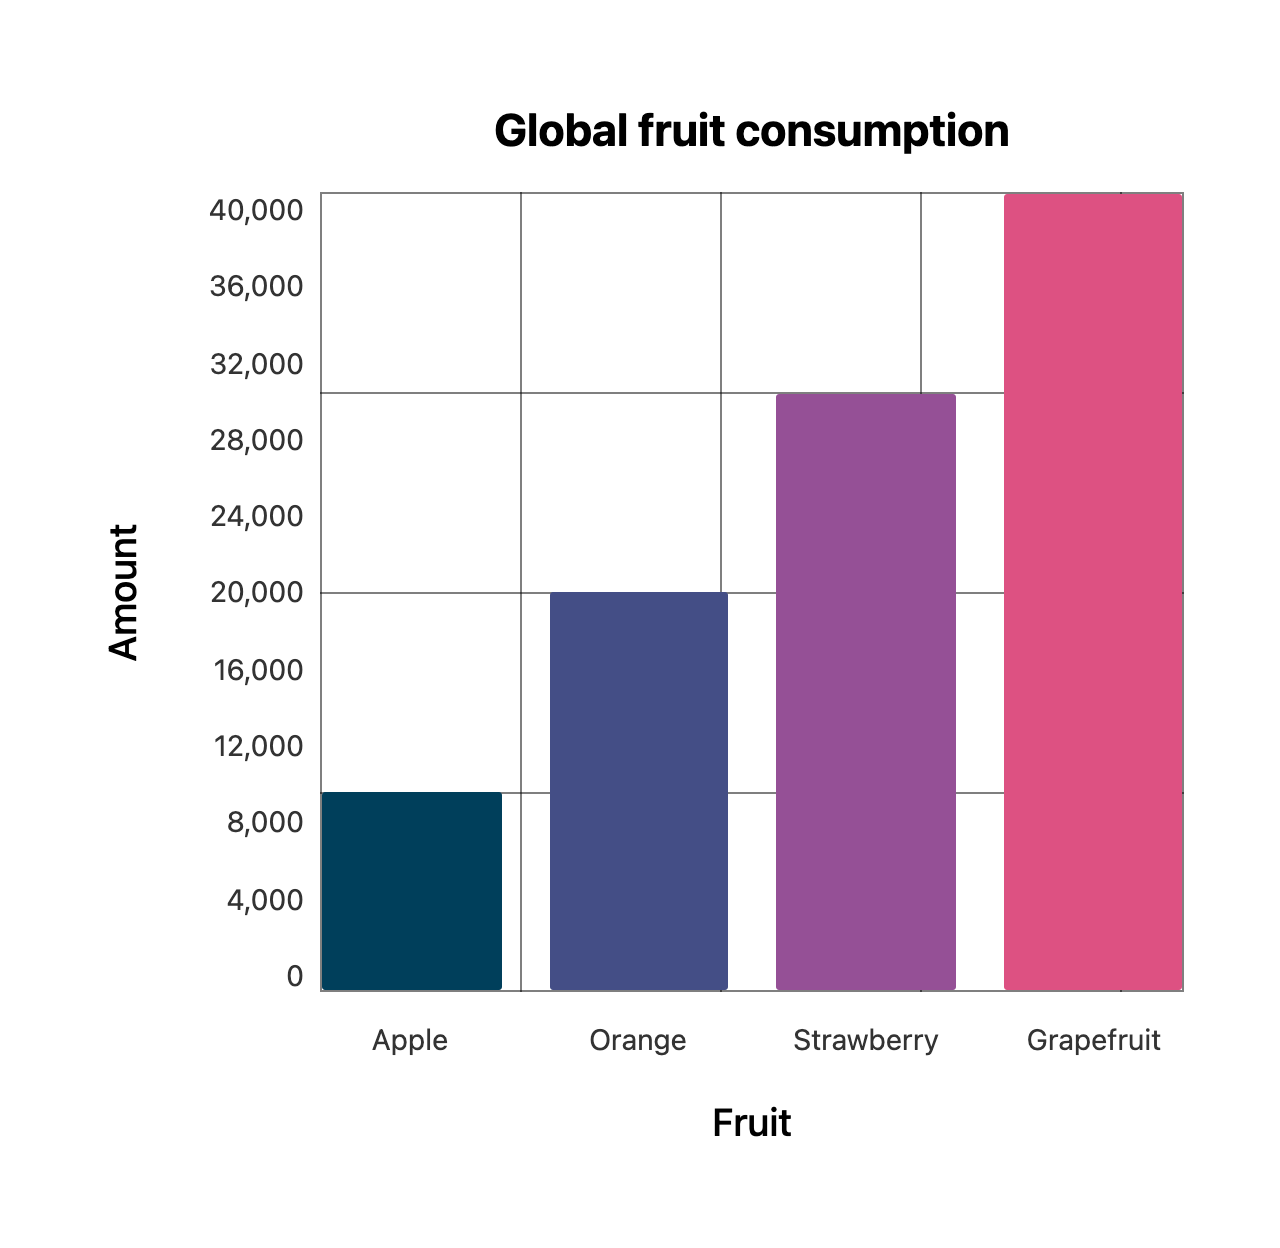
A flexible, composable data visualisation library for React.
You want to display a chart in your application, but you want to have full control over the markup. styling and functionality.
The library exposes a hook for each type of chart. You then consume this hook in your application and compose your own graph using the information supplied by the hook.
useBarChart
const series = [
  { label: "Apple", value: 100, colour: "#003f5c" },
  { label: "Orange", value: 200, colour: "#444e86" },
  { label: "Strawberry", value: 300, colour: "#955196" },
  { label: "Grapefruit", value: 400, colour: "#dd5182" },
];

// ...

const { augmentedSeries, xAxisLabels, yAxisLabels, getBarChartProps } =
  useBarChart({
    series,
    height: 300,
});-
series: { label: string; value: number; colour: string; }[]- The series of chart data.label- The label of the bar on the chart.value- The value of the bar on the chart.colour- The colour of the bar on the chart.
-
height: number;- The height of the chart.
-
augmentedSeries- An augmented/enriched version of the series data with additional properties needed to compose the chart.{ getBarProps: <TElement extends unknown>({ onClick, style, ...additionalBarProps }?: DetailedHTMLProps<HTMLAttributes<TElement>, TElement>) => DetailedHTMLProps<HTMLAttributes<TElement>, TElement>; label: string; value: number; colour: string; }[]getBarProps- A function that returns the necessary collection of properties for the bar on the chart.label- The label of the bar on the chart.value- The value of the bar on the chart.colour- The colour of the bar on the chart.
-
xAxisLabels: string[];- An array of the x axis labels. -
yAxisLabels: string[];- An array of the y axis labels. -
getBarChartProps- A function that returns the necessary collection of properties for the parent chart element.
const series = [
  { label: "Apple", value: 100, colour: "#003f5c" },
  { label: "Orange", value: 200, colour: "#444e86" },
  { label: "Strawberry", value: 300, colour: "#955196" },
  { label: "Grapefruit", value: 400, colour: "#dd5182" },
];

const BarChart = () => {
  const { augmentedSeries, getBarChartProps } = useBarChart({
    series,
    height: 300,
  });

  return (
    <div {...getBarChartProps()}>
      {augmentedSeries.map(({ getBarProps }) => (
        <div {...getBarProps()} />
      ))}
    </div>
  );
};
