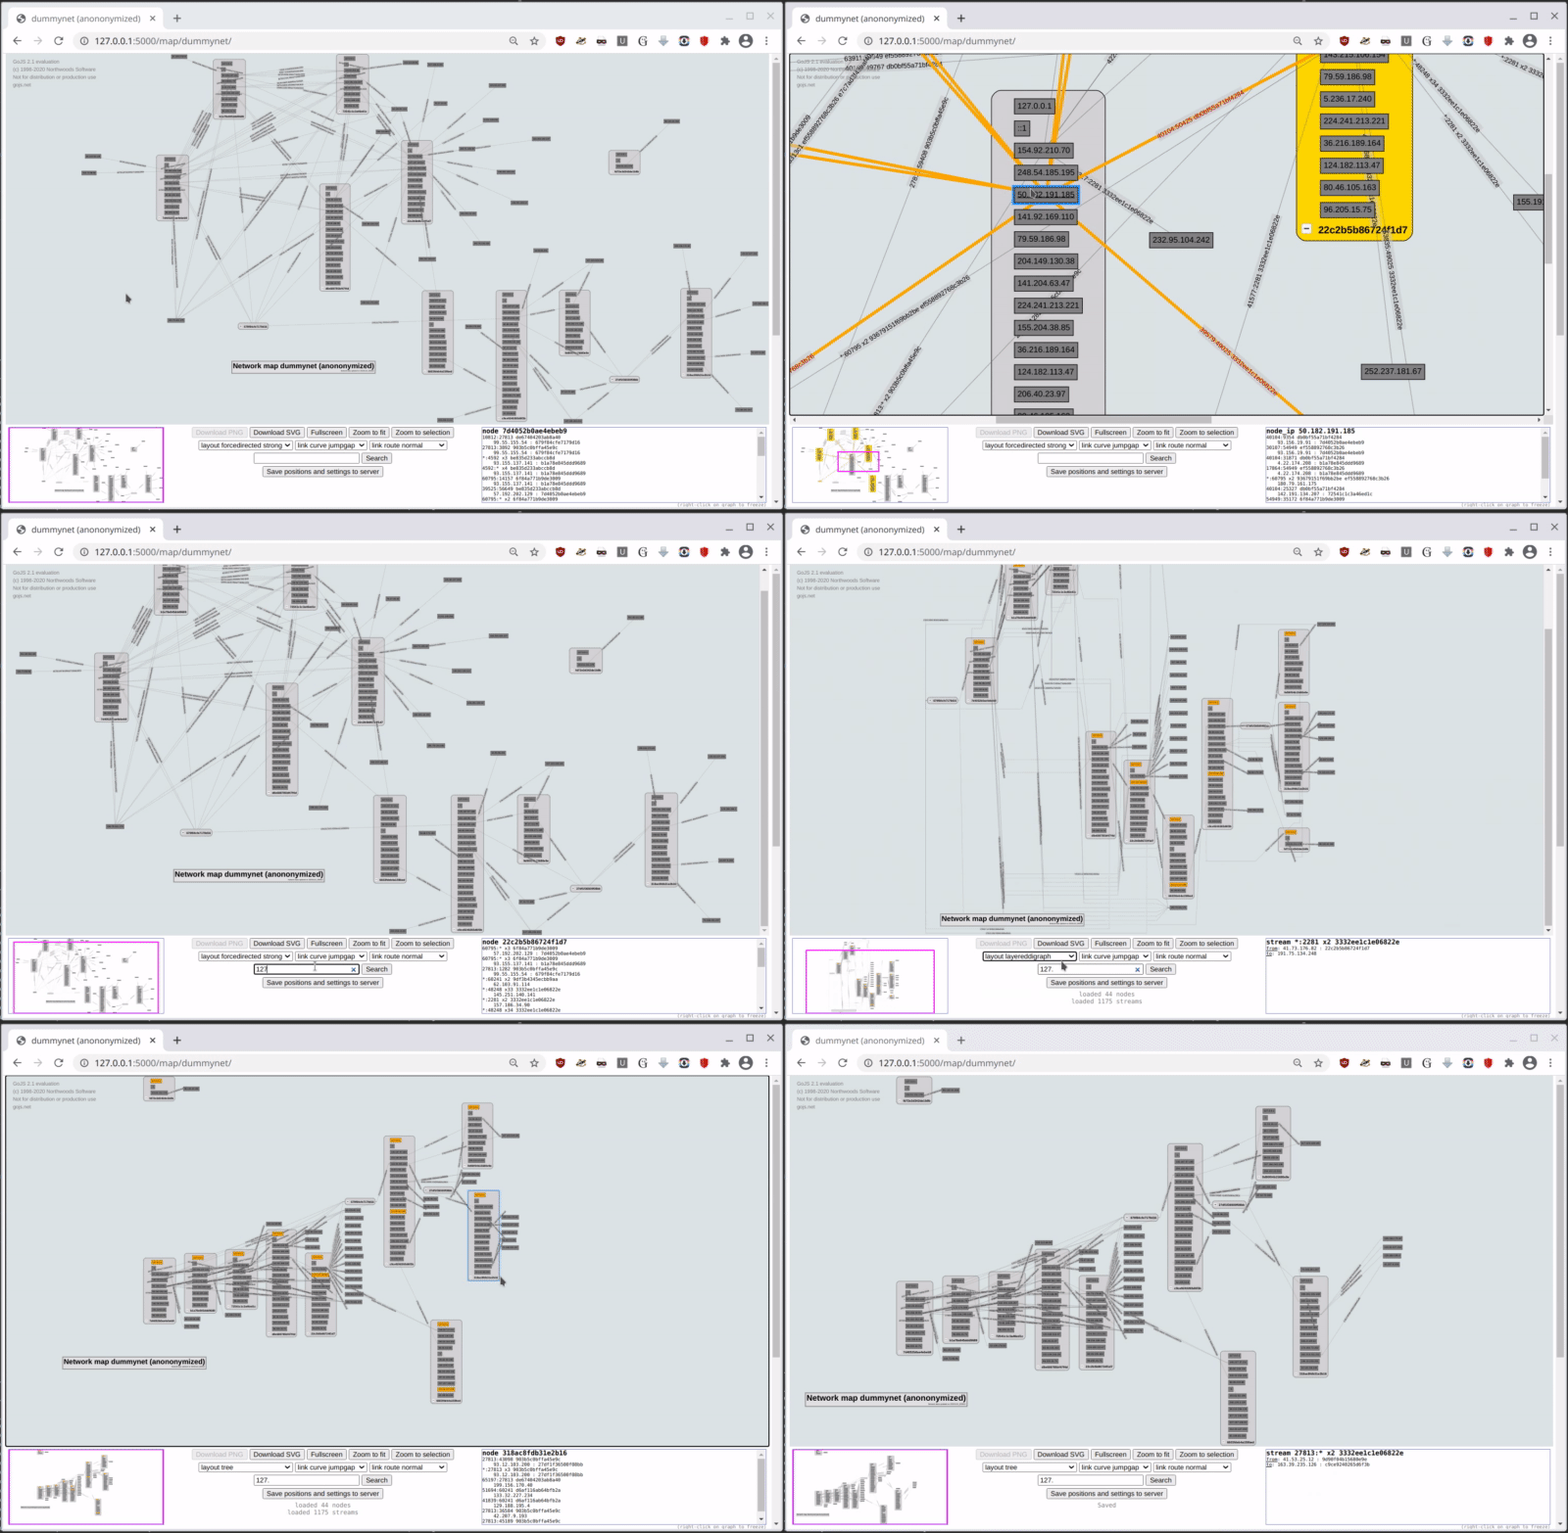
netmap generates text analysis and interactive graphical map of a network from system commands output and pcap traces from multiple nodes.
Features:
- Input from simple system commands output text files (
ip a s,ss -anp,kubectl...) and standard networkpcaptraces - Text output analysis gives a quick overview of nodes and network streams
- Graphical map output showing network nodes helps understand visually the architecture of a network
- Interactivity of the map allows to place network nodes manually in a fashion where it makes best sense for understanding
- Network streams between nodes show application-level communications
- Access to the source information file/pcap from the WebUI for a given node/stream
1. Create a directory for the network data
$ mkdir -p netmap_data/network1/2. Gather commands output and pcap traces from the nodes in your network
2.a. On the local node, here 192.168.0.1, collect.sh will execute various system commands (ip, ss, ...) to get network configuration and store output in text files:
$ ./collectors/collect.sh netmap_data/network1/ 192.168.0.1On Kubernetes cluster, you can use collect_k8s.sh which collects informations from all your pods from the master node, to make the pods appear in the network map.
2.b. From remote notes, remote_collect.sh will connect via SSH to the nodes, run the above script and fetch results:
./collectors/remote_collect.sh netmap_data/network1/ 192.168.0.250 10.10.10.12.c. You can also collect data from your own scripts and store the result to netmap_data/network1/ following Data input format naming.
3. Run the command-line tool to have an overview of the collected data
$ ./netmap_cli.py netmap_data/ network14. Run the webserver and connect to http://127.0.0.1:5000/ to view the network map
$ ./webserver.sh netmap_data/For demo purposes you can run ./webserver.sh ./demo_data/ and click on network1 that will show you a network map from the data used for unit tests.
netmap_cli.py [options] <input_data_directory> [<network_name>]
	generate text output analysis about the network
webserver.sh <input_data_directory>
	start the webserver to generate an interactive graphical map of the network
collectors/
	example scripts for data collection on local and remote hosts
demo_data/
	dummy system commands output and pcap traces for demo purposes and unit tests
flask/
	webapp for network map visualisation
lib/
	network data processing libraries
test/
	unit tests code for processing commands output and pcaps
- On monitored machines
- Linux with
iproute2installed, optionallytcpdumpandnetstat - Supports Kubernetes pods, executes commands from the master in all pods, see collect_k8s.sh
- Linux with
- On visualisation machine (where webserver/netmap_cli runs)
python3andpython3-flask- optionally
python3-dpkt(pip install dpkt) for pcap parsing support
- On web browser
- Tested with chromium 87,105 on Linux, Firefox 83,105 on Linux
netmap takes as input a directory containing the network data to analyse, each network in it's own directory.
A network directory can contain 2 types of files:
- system commands output such as
ip address show,ss -anp,cat /etc/hosts - network captures in
pcapformat fromtcpdumpor alike
netmap_data/network1/
netmap_data/network1/host_<host_ip>_cmd_etc_hosts.txt
netmap_data/network1/host_<host_ip>_cmd_ip-address-show.txt
netmap_data/network1/host_<host_ip>_cmd_ss-anp.txt
netmap_data/network1/host_<host_ip>_cmd_netstat-anp.txt
netmap_data/network1/host_<host_ip>_cmd_netmap_k8s_services_list.txt
netmap_data/network1/host_<host_ip>_pcap_<interface>.pcap
On host 192.168.0.1:
$ cd netmap_data/network1/
$ ip address show > host_192.168.0.1_cmd_ip-address-show.txt
$ sudo ss -anp > host_192.168.0.1_cmd_ss-anp.txt
$ cat /etc/hosts > host_192.168.0.1_cmd_cat_etc_hosts.txt
$ sudo tcpdump -ni enp0s31f6 -c 100 -w host_192.168.0.1_pcap_enp0s31f6.pcap
The network map is generated from commands output files and network traces files from the input_data_directory.
Refreshing the web page will give you an up-to-date map from the current data. A cache file is generated and used if the input_data_directory has not been modified.
You can export the graph to PNG or SVG by clicking the "Download" buttons on the web interface.
See help at the bottom of the network map web page.
Unit tests include multiple iproute2 command output parsing as well as pcap and network processing tests.
make testsBoth netmap_cli.py and webserver.sh can be passed a -d flag:
$ ./netmap_cli.py -d demo_data/ network1$ ./webserver.sh -d ./demo_data/Passing -d twice increases verbosity.
= first =
* show that we are in freeze mode
	red border around target information box
* fix duplicated links (ss + pcap)
* option to make link size change depending on traffic amount
* option to make node size change depending on traffic amount
* fix Network.to_map.peers_streams_reduce() to handle proto

= second =
* URL link to highlight a specific node / links
* simple UI modes
    * Map: tree view, orthogonal links
    * Graph: forcelayout-strong, normal links
    * Graph traffic: forcelayout-strong, normal links, link and node size shows traffic amount
* select multiple nodes nodes highlights links only between the selected nodes
* add versions of a network
    * generating more data adds information, not removing old one
    * possibility to view versions independently
* maybe when highlight node make the other nodes/links more transparent

= later =
* provide connectivity to users
	* scripts/deploy_connectivity.sh _my_host
		deploy public ssh key to the different nodes
		prepare ssh config for users
	* provide access in UI
		"connectivity requiremenents" link
			show private ssh key
			show ssh config
		button in information box that shows + copy to clipbuffer
				specific info info for the targeted node
			ssh command to log-in to data repository
			ssh command to log-in to node
* visualdiff between network versions
* save to named profile on server
* color link label background depending on port, choose color dynamically
