IMAGE QUALITY ASSESSMENT APPLICATION (IQA) FROM NARROW-BANDING-IMAGING (NBI) ENDOSCOPY CAMERAS DEPLOYED ON K8S
This repository serve as the final project for Module 1 of the Machine Learning Engineer (MLE) Course
Gastrointestinal diseases have a significant impact on human well-being, and among them, gastrointestinal tumors have particularly high rates of occurrence and death. Besides traditional endoscopy, with the advancements in technology, endoscopic techniques nowadays such as the Narrow-banding-imaging (NBI) technique play a fundamental role in the quality of life for individuals by providing numerous imaging information for accurate diagnosis of gastrointestinal diseases. Although the amount of image data is abundant, most of it is substandard due to many external factors, such as motion blur or harsh and unevenly distributed light in the endoscopic environment. Therefore, based on the characteristics of the gastroscopy environment, we built an application that applies AI to evaluate image quality from NBI endoscopy cameras, helping to eliminate poor quality images, thereby shortening the time required for searching the frames that meet standards. After removing images that didn't match the requirements, we also developed an additional feature to assist physicians in labelling areas that showed signs of stomach damage. This allowed us to collect a large amount of data about the areas that showed signs of damage, which we could then utilize to train an AI model to recognize those signs automatically.
 The application is built based on the following technologies:
- Model: The Resnet18 model with pretrained weights from ImageNet dataset is utilized for finetuning with our own dataset for IQA module.
- Web API: The backend is built based on Flask, which is a lightweight and flexible web framework, in terms of frontend, we use HTML, CSS with JavaScript. About the database, we utilize object storage namely Minio, mounted to the Filestore storage from Google Cloud Storage (GCP), which completely decouples from the web server, allowing flexibility and scalability.
- Containerization: The application is containerized using Docker, which allows for easy deployment and scalability.
- Deployment: The model is deployed on Google Kubernetes Engine (GKE), a managed environment for deploying, managing, and scaling containerized applications using Kubernetes. The GKE cluster is provisioned using Terraform, an infrastructure as code tool.
- Monitoring: Prometheus, an open-source monitoring and alerting toolkit, along with Grafana, a popular visualization tool, are used to monitor the deployed application and gather performance metrics.
- CI/CD Pipeline: The project includes a CI/CD pipeline implemented with Jenkins. Jenkins is installed on Google Compute Engine (GCE) using Ansible to automate image pushes to Docker Hub and streamline the model deployment process on GKE.


docker compose -f docker-compose.yaml up -dYou can access the Web and Minio UI through port 6789 and 9000 respectively:
- Web UI:
localhost:6789 - Minio:
localhost:9000
-
Install gke-gcloud-auth-plugin
sudo apt-get install google-cloud-cli-gke-gcloud-auth-plugin -
Setup Gcloud Project
- Authorizes gcloud and other SDK tools to access Google Cloud and setup configuration
gcloud init - Login to GCP
gcloud auth application-default login
- Authorizes gcloud and other SDK tools to access Google Cloud and setup configuration
- Install Terraform
- Create a GKE cluster using Terraform by the following commands:
cd iac/terraform
terraform init
terraform plan
terraform apply
After a while, we should see this if the cluster and filestore storage are successfully created:


- Update the Filestore storage IP address in
helm/datalake/values.yamlfile

-
Connect to the cluster using
gcloudcommand.
-
Enable the Filestore CSI driver
gcloud container clusters update YOUR_CLUSTER_NAME --update-addons=GcpFilestoreCsiDriver=ENABLED --zone=YOUR_DEFINED_ZONE- Deploy NGINX-ingress:
helm upgrade --install nginx-ingress helm/nginx-ingress-
Deploy all three main components: iqa-ingress, iqa-datalake, iqa-app by these commands:
helmfile init
helmfile apply -f helmfile.yaml- Get External IP of NGINX-ingress:
kubectl get svc
- Adding the
NGINX-ingressExternal IPNGINX_EXTERNAL_IP iqa.system.comabove to the/etc/hostsfile:
sudo nano /etc/hosts
-
Now you can access the IQA app UI by these domains:
iqa.system.com
-
You can also access the Minio UI through
localhost:9091by this command:
kubectl port-forward svc/iqa-datalake 9091:9090To access the Minio UI, you need the username and password:
- Username: minio_access_key
- Password: minio_secret_key

All the images and their label information are stored in the userData bucket

To be able to execute the CI/CD pipeline using Jenkins, we need to create a Virtual Machine (VM) instance and install jenkins on it using Ansible:
-
Create a new service account with Compute Admin role. In this project, the service account is named
ansible-sa. -
Navigate to Service accounts section, select action Manage keys.

-
Create new key of the created service account and download it as JSON file.
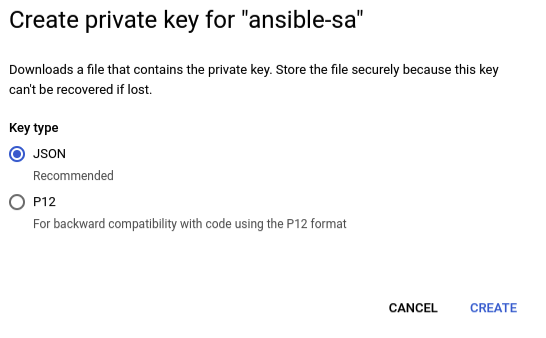
-
Save the downloaded JSON key in
iac/ansible/secrets. -
Update the
service_account_filefield inansible/playbooks/create_compute_instance.ymlwith your new path to the new JSON key. -
Install ansible on your local machine

pip install ansible==8.3.0
pip install requests==2.31.0
pip install google-auth==2.28.1- Create a VM instance
cd ansible/deploy_jenkins
ansible-playbook create_compute_engine.yaml
After a while, we should see this if the VM instance is successfully created (iqa-vm-instance)

Then, we need to change the IP address in the /iac/ansible/inventory file with the external IP address of the created VM instance

- Install jenkins
ansible-playbook -i ../inventory deploy_jenkins.yaml-
Connect to Jenkins UI
-
Checking Jenkins installed successfully on GCE
- Access the GCE instance
ssh YOUR_USERNAME@INSTANCE_EXTERNAL_IP -i PATH_TO_PRIVATE_SSH_KEY
- Verify if Jenkins is running in the Compute Engine instance
sudo chmod 777 /var/run/docker.sock
docker ps

- Access the GCE instance
-
Access Jenkins UI via
INSTANCE_EXTERNAL_IP:8081. -
Follow the instruction to log in into Jenkins.
-
The password can be retrieved by
# inside GCE instance
docker exec -it jenkins bash
cat /var/jenkins_home/secrets/initialAdminPassword
-
Install required plugins

-
-
Connect Jenkins to GitHub Repo
-
Add Jenkins to Repo Webhook
- Payload URL would
http://INSTANCE_EXTERNAL_IP:8081/github-webhook/

- Event Trigger can be set to: Pushes and Pull Requests
- Payload URL would
-
Add GitHub Repo to Jenkins
- Create new Multibranch Item in Jenkins
- Create a new Personal Access Token. In this project we will generate a classic token.

- Connect Repo to Jenkins
- Add credentials with your Github
usernameand password is just-createdPersonal Access Token - Copy the URL to your Github repo.
- Click
Validateto see whether Jenkins successfully connect to your Github repo or not.
- Add credentials with your Github
-
-
Add DockerHub Token to Jenkins Credential
- Create a new DockerHub Token
- Add the token to Jenkins' Credentials
- Note: ID must be
dockerhubto match theregistryCredentialinJenkinsfile.
- Note: ID must be
-
Setup Cloud Connection
-
Create
clusterrolebindingkubectl create clusterrolebinding model-serving-admin-binding \ --clusterrole=admin \ --serviceaccount=default:default \ --namespace=default kubectl create clusterrolebinding anonymous-admin-binding \ --clusterrole=admin \ --user=system:anonymous \ --namespace=default
-
Grant permissions for Jenkins to access the GCP Filestore storage
kubectl apply -f k8s/rbac
-
Configure clouds at
http://INSTANCE_EXTERNAL_IP:8081/manage/configureClouds/-
Get
Kubernetes URLandKubernetes server certificate keyby running the following in terminal of your local machine (I use Minikf in my local machine).cat ~/minikf-kubeconfigKubernetes URLisserverKubernetes server certificate keyiscertificate-authority-data


-
-
-
Build
- Whenever there are changes merged to
main, the Deploy pipeline will run, build and push the latest image to DockerHub. - After that, the pipeline will use Helm to pull and deploy the latest image in GKE cluster automatically including all three main components:
- IQA ingress rules
- IQA Datalake
- IQA App

- Whenever there are changes merged to
-
Create Custom Resource Definitions (CRDs) for Prometheus Operator
kubectl apply --server-side -f k8s/observable/prometheus-operator-crd
-
Create Node exporter, Cadvisor, Prometheus, Prometheus Operator and Grafana
kubectl apply -R -f k8s/observable/monitoring
-
To check if everything works fine, you can run this commands:
kubectl get pod --all-namespaces
If successful, we should see this message:

-
Adding the
NGINX-ingressExternal IPNGINX_EXTERNAL_IP iqa.monitoring.comto the/etc/hostsfile and you can visit the Grafana UI throughiqa.monitoring.com -
To access the Grafana UI, you need the username and password:
- Username: admin
- Password: devops123

-
To check everything connects to
Prometheussuccessfully:kubectl port-forward svc/prometheus-operated 9090:9090 -n monitoring
Access
PrometheusUI throughlocalhost:9090, at thehttp://localhost:9090/targets?search=, you shoud see all target are ready:
- Config Slack notifications
-
Create a channel name
alerts. -
Go to
https://api.slack.com/appsand create an app and the corresspond workspace.
-
Enable the
Incoming Webhooks, copy theWebhook URLand replace theapi_urlattribute in thek8s/ alertmanager/0-config.yamlfile
-
- Apply AlertManager
- To create an
AlertManagerinstance in kubernetes, run this command:kubectl apply -f k8s/alertmanager
- After a few minutes, at the
http://localhost:9090/alerts?search=, you should see:
- To create an
- Deploy Log and Traces Storage services such as Elasticsearch and Jaeger.