- Deploy Prometheus-Grafana-Alertmanager stack and Angular-Springboot web application
- Using docker, docker-compose, ansible to deploy
- Define alert rules to monitoring target hosts
- Configure Alertmanager to push alert to Telegram, Slack, Mail...
- Create Grafana dashboards to monitoring target hosts
- 2 machines on AWS to deploy web application.
- 1 machine on VMWare to deploy monitoring system.
- Using Ansible to deploy web app, monitoring system, package... on 3 above machines.
I will create a monitor machine on Vmware Workstation 17 Player (Ubuntu 20.04), then I deploy Prometheus-Grafana-Alertmanager stack using docker, docker-compose and Ansible on this machine
I will create 2 EC2 instances (Ubuntu 20.04) on AWS for worker nodes
-
Worker1 for deploy web application and Node exporter
- Web app: http://[worker1-AWS-EC2-Public-IPv4-DNS]:4200/#
- Node exporter: http://[worker1-AWS-EC2-Public-IPv4-DNS]:9100
-
Worker2 for only Node exporter
- Node exporter: http://[worker2-AWS-EC2-Public-IPv4-DNS]:9100
I use Ansible to deploy web app and node exporter on 2 ec2 worker. Because I will need to get the node_exporter metrics from port 9100, so I need to change the Inbound rules of security group to allow access our EC2 instances in port 9100.

Deployment diagram.
-
Run successfully
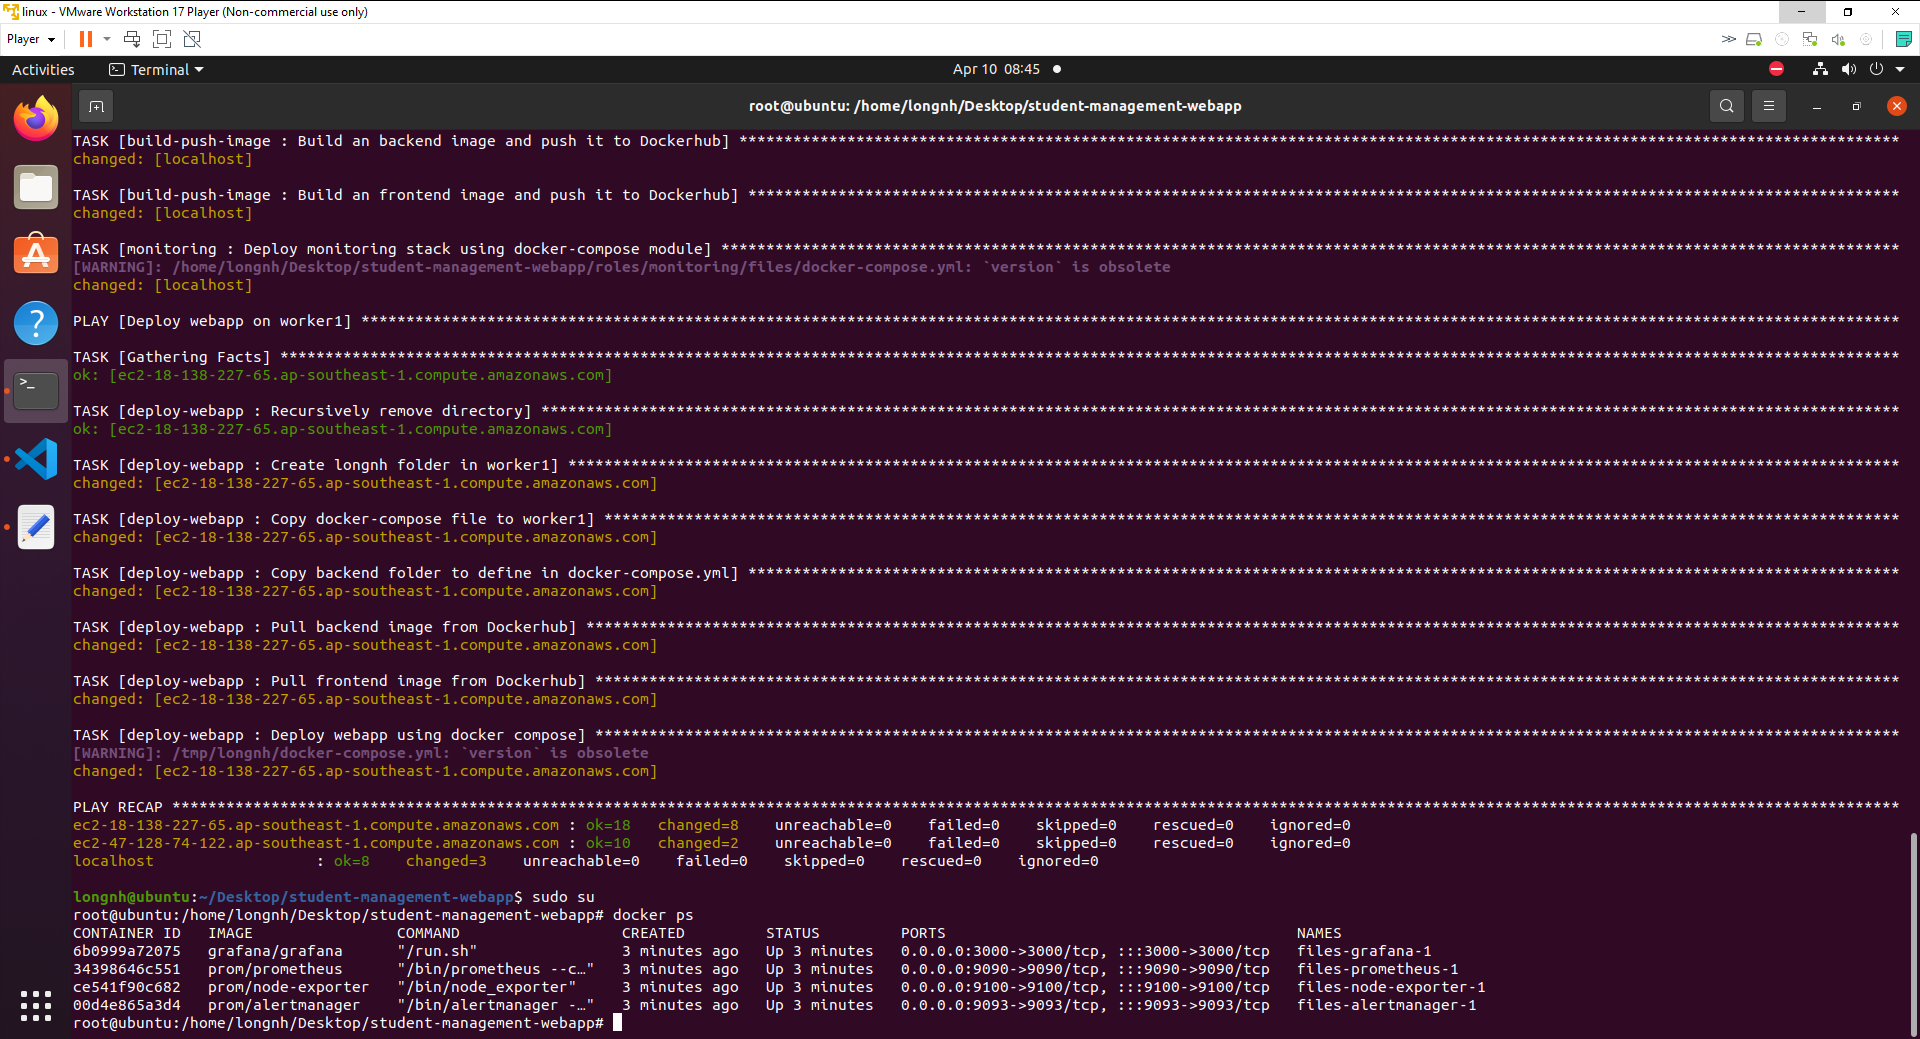

Result after run ansible-playbook
-
Check image on Dockerhub
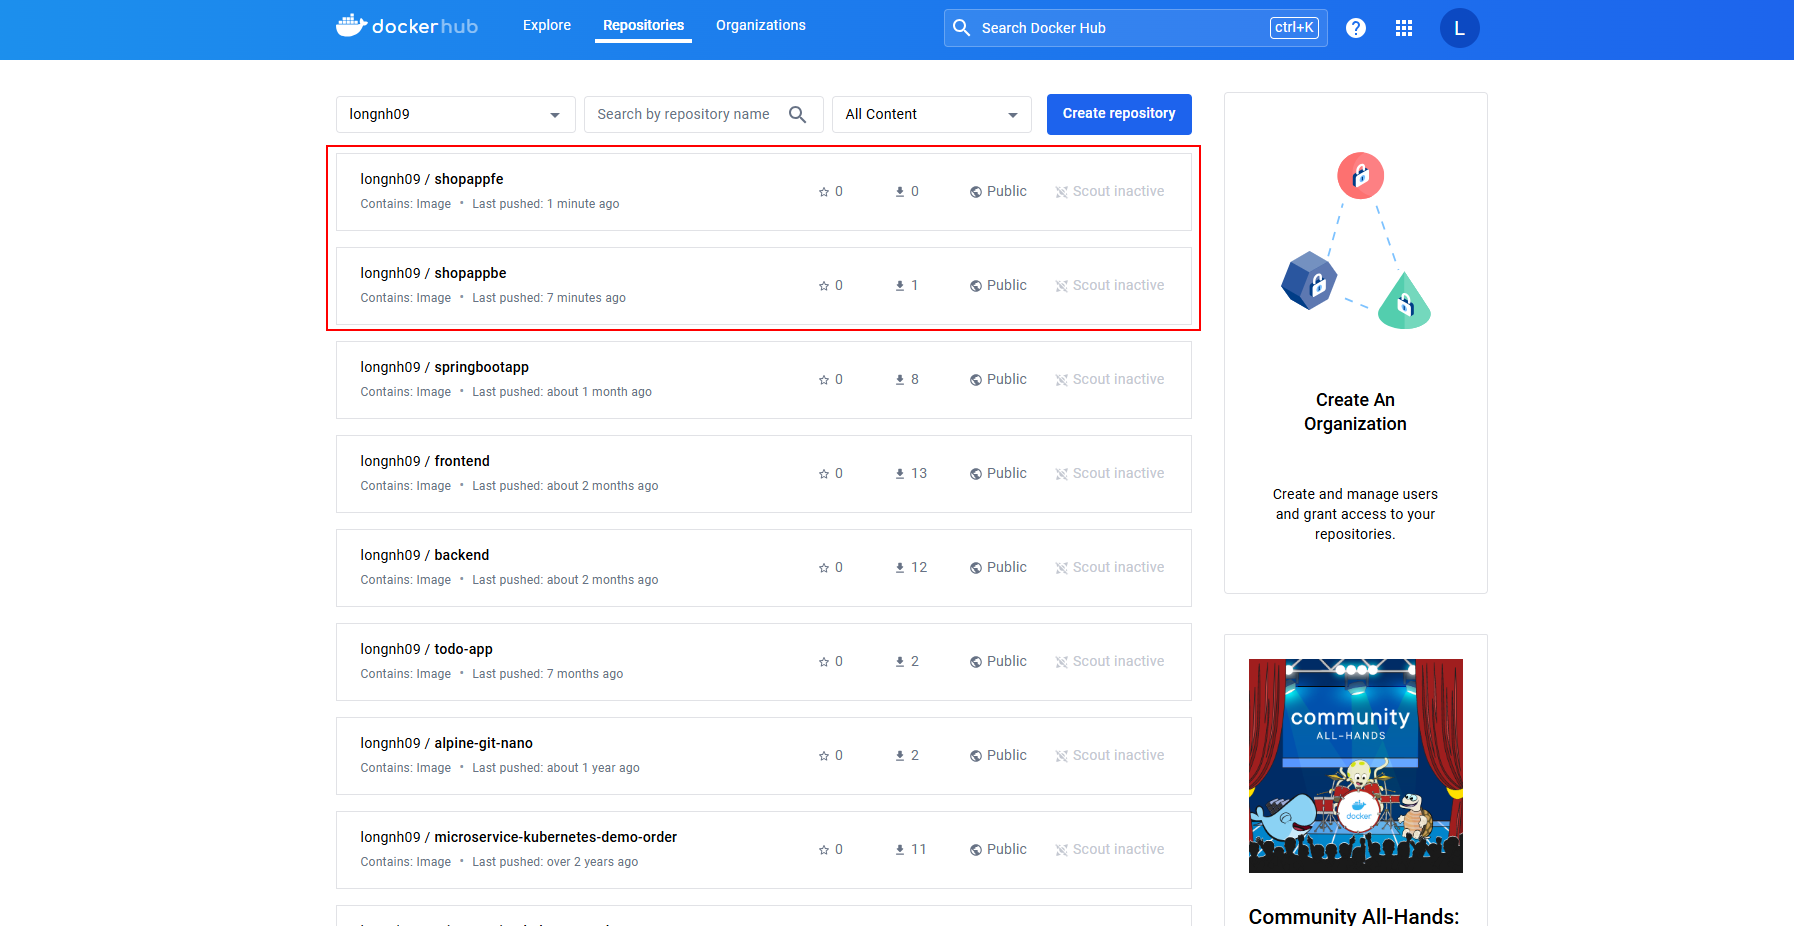

Backend image and Frontend image were pushed to Dockerhub
-
Test Webapp deployment on AWS EC2
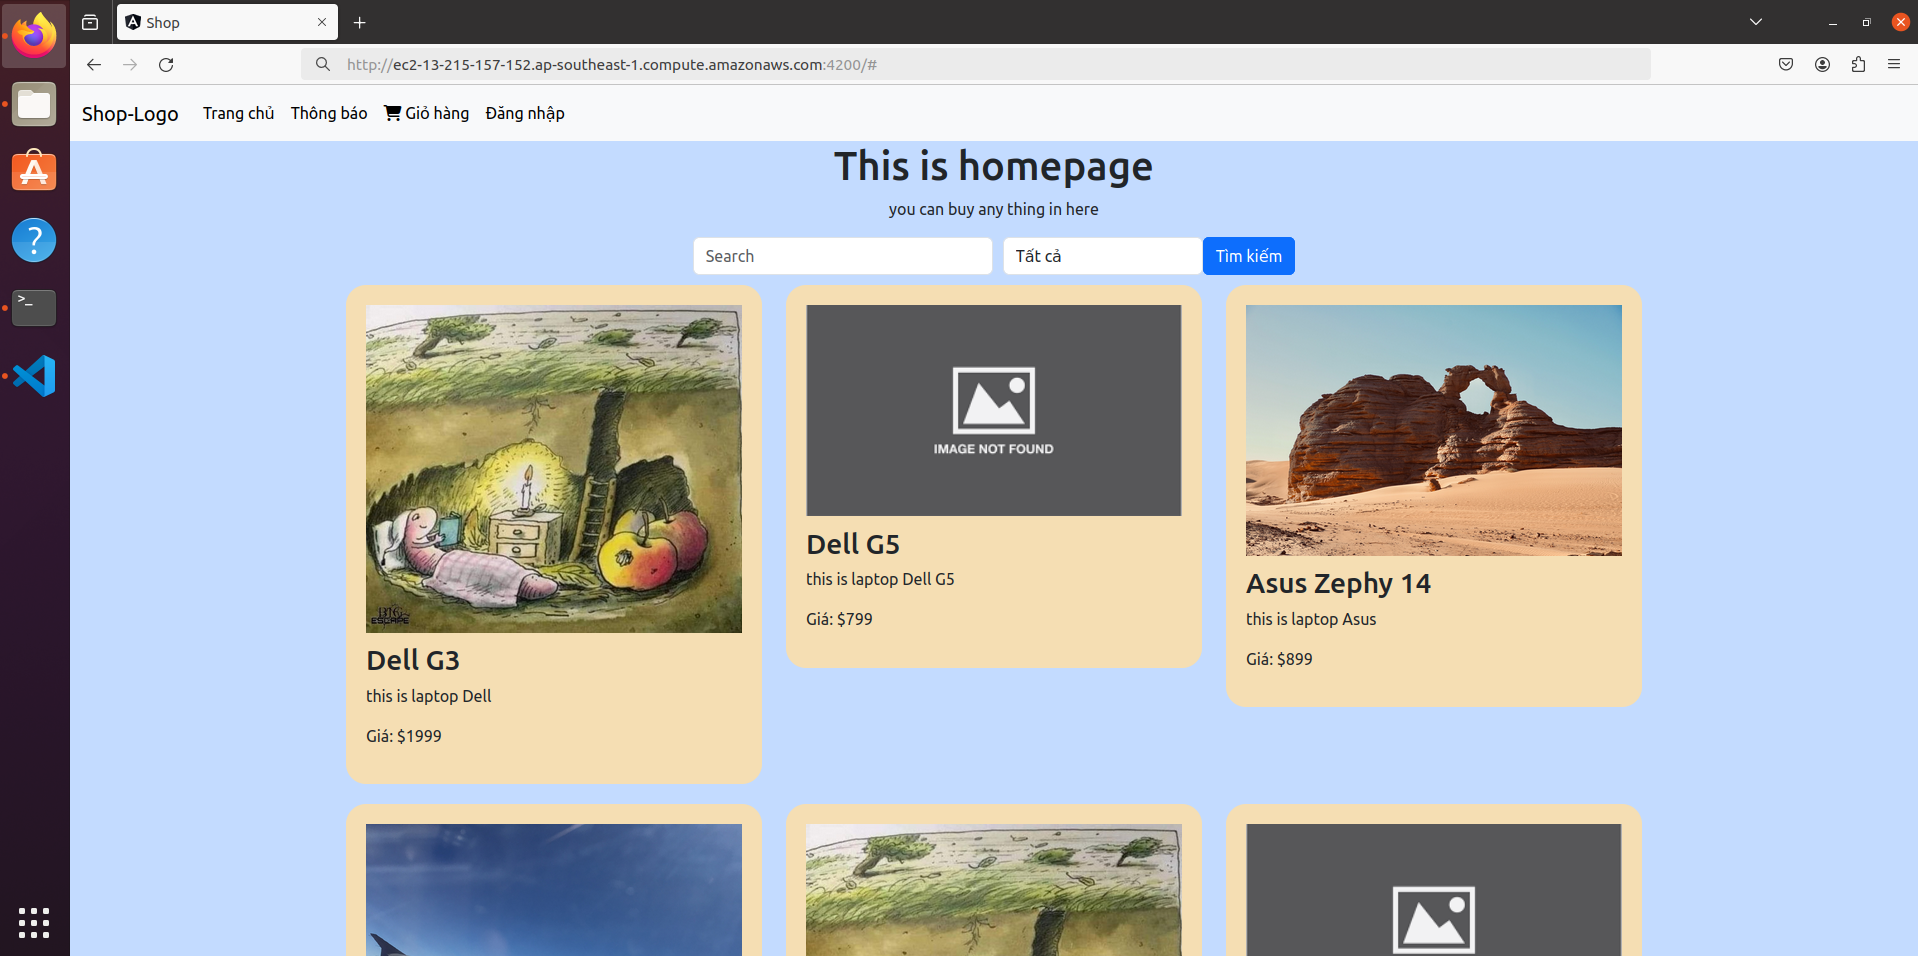
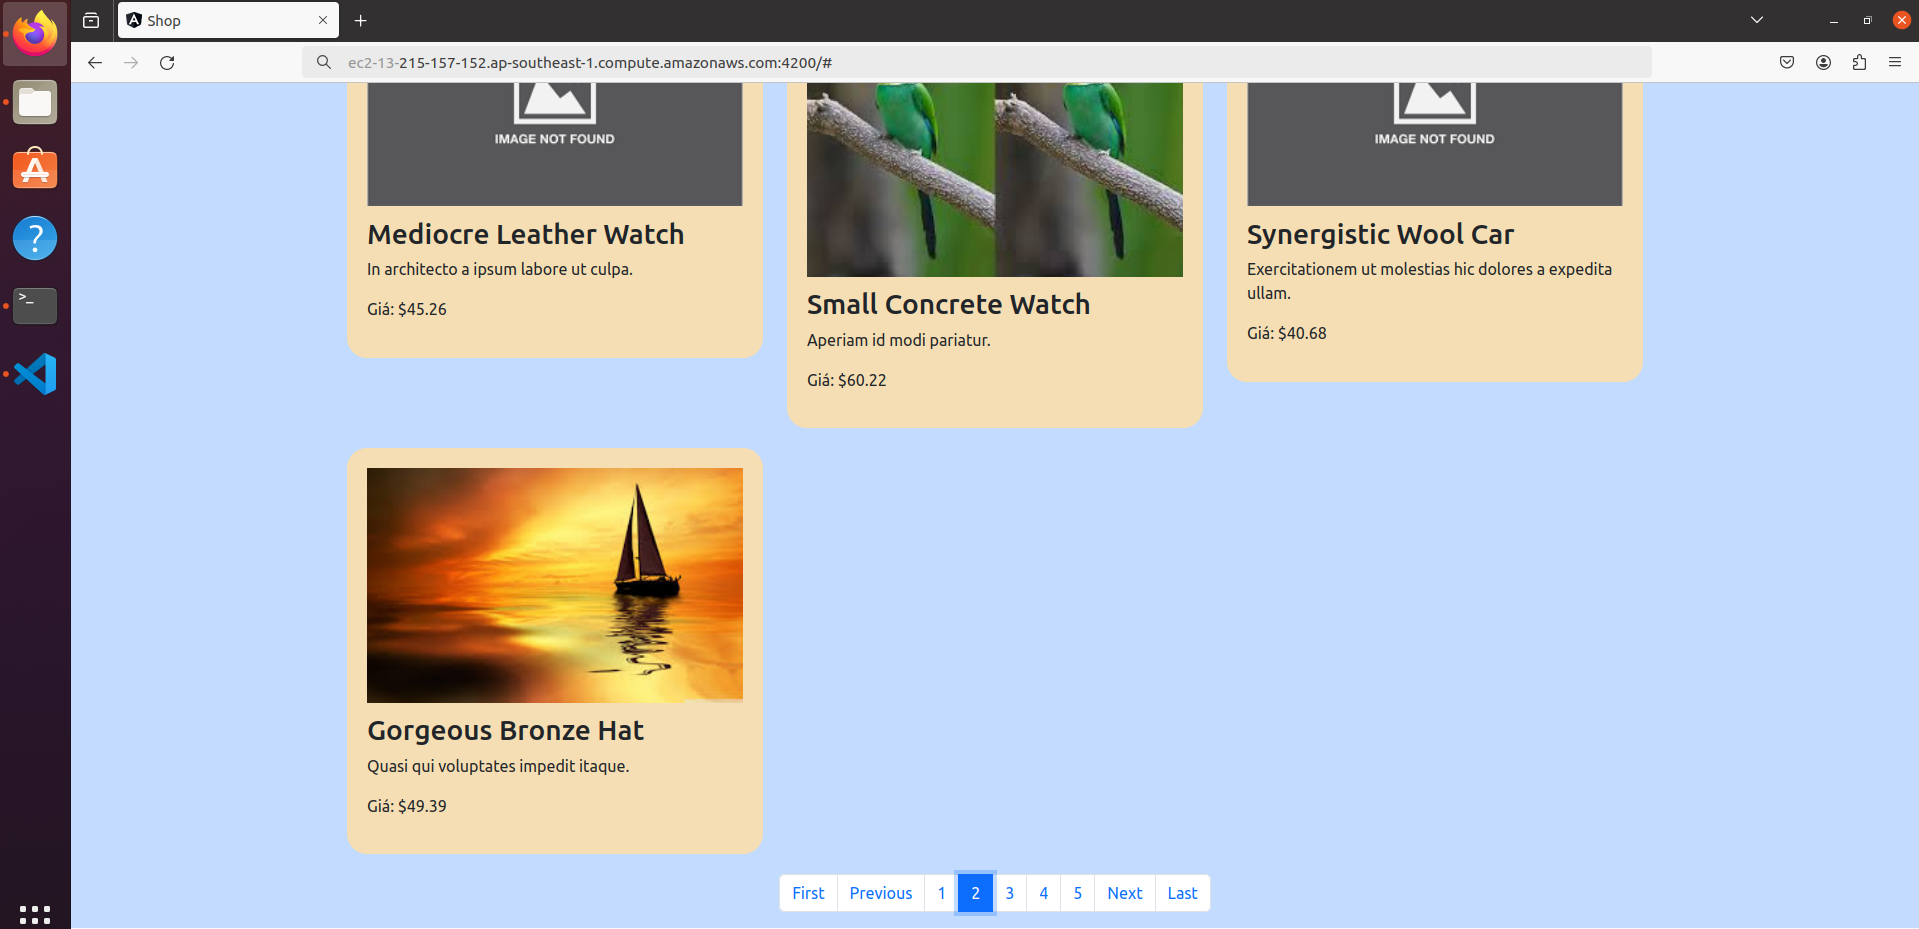


Web app is hosted at http://[worker1-AWS-EC2-Public-IPv4-DNS]:4200/#
In this case web app is hosted at http://ec2-13-215-157-152.ap-southeast-1.compute.amazonaws.com:4200/#
In this case web app is hosted at http://ec2-13-215-157-152.ap-southeast-1.compute.amazonaws.com:4200/#
-
Check Prometheus targets
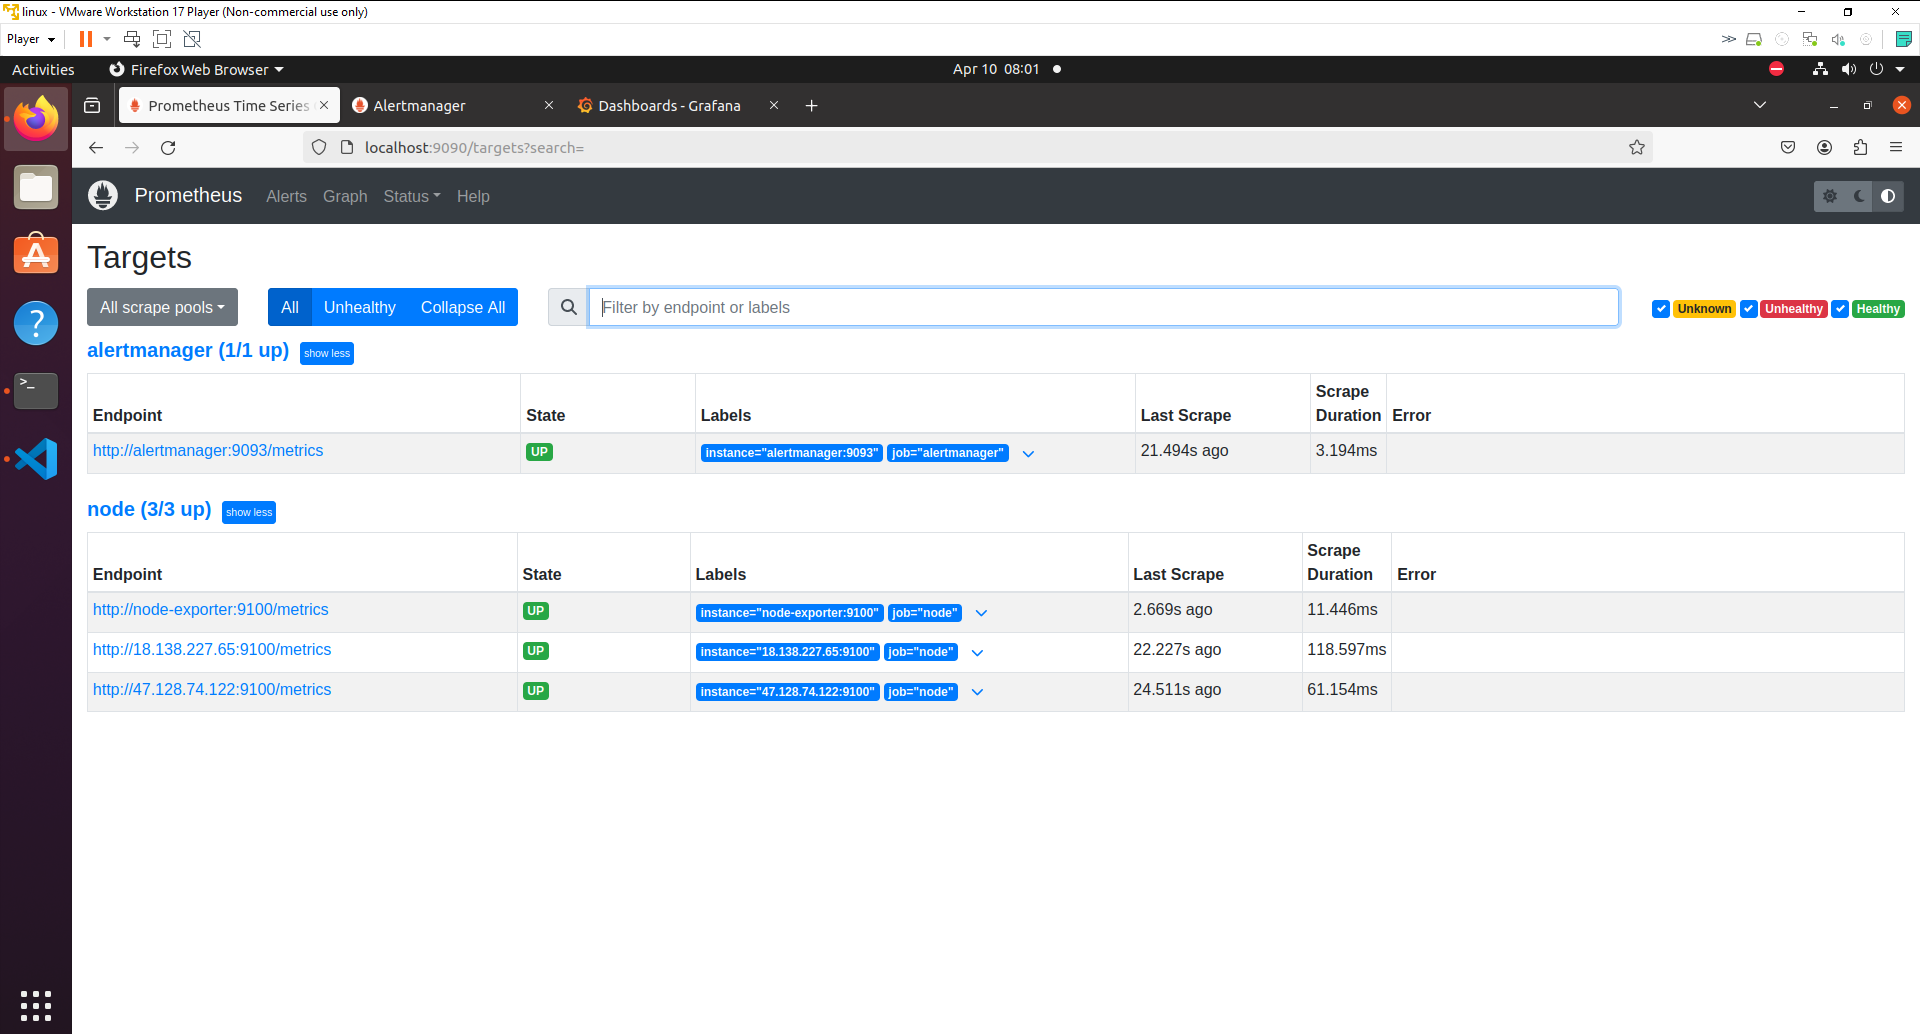

All targets are upped
-
Add Prometheus data source in Grafana
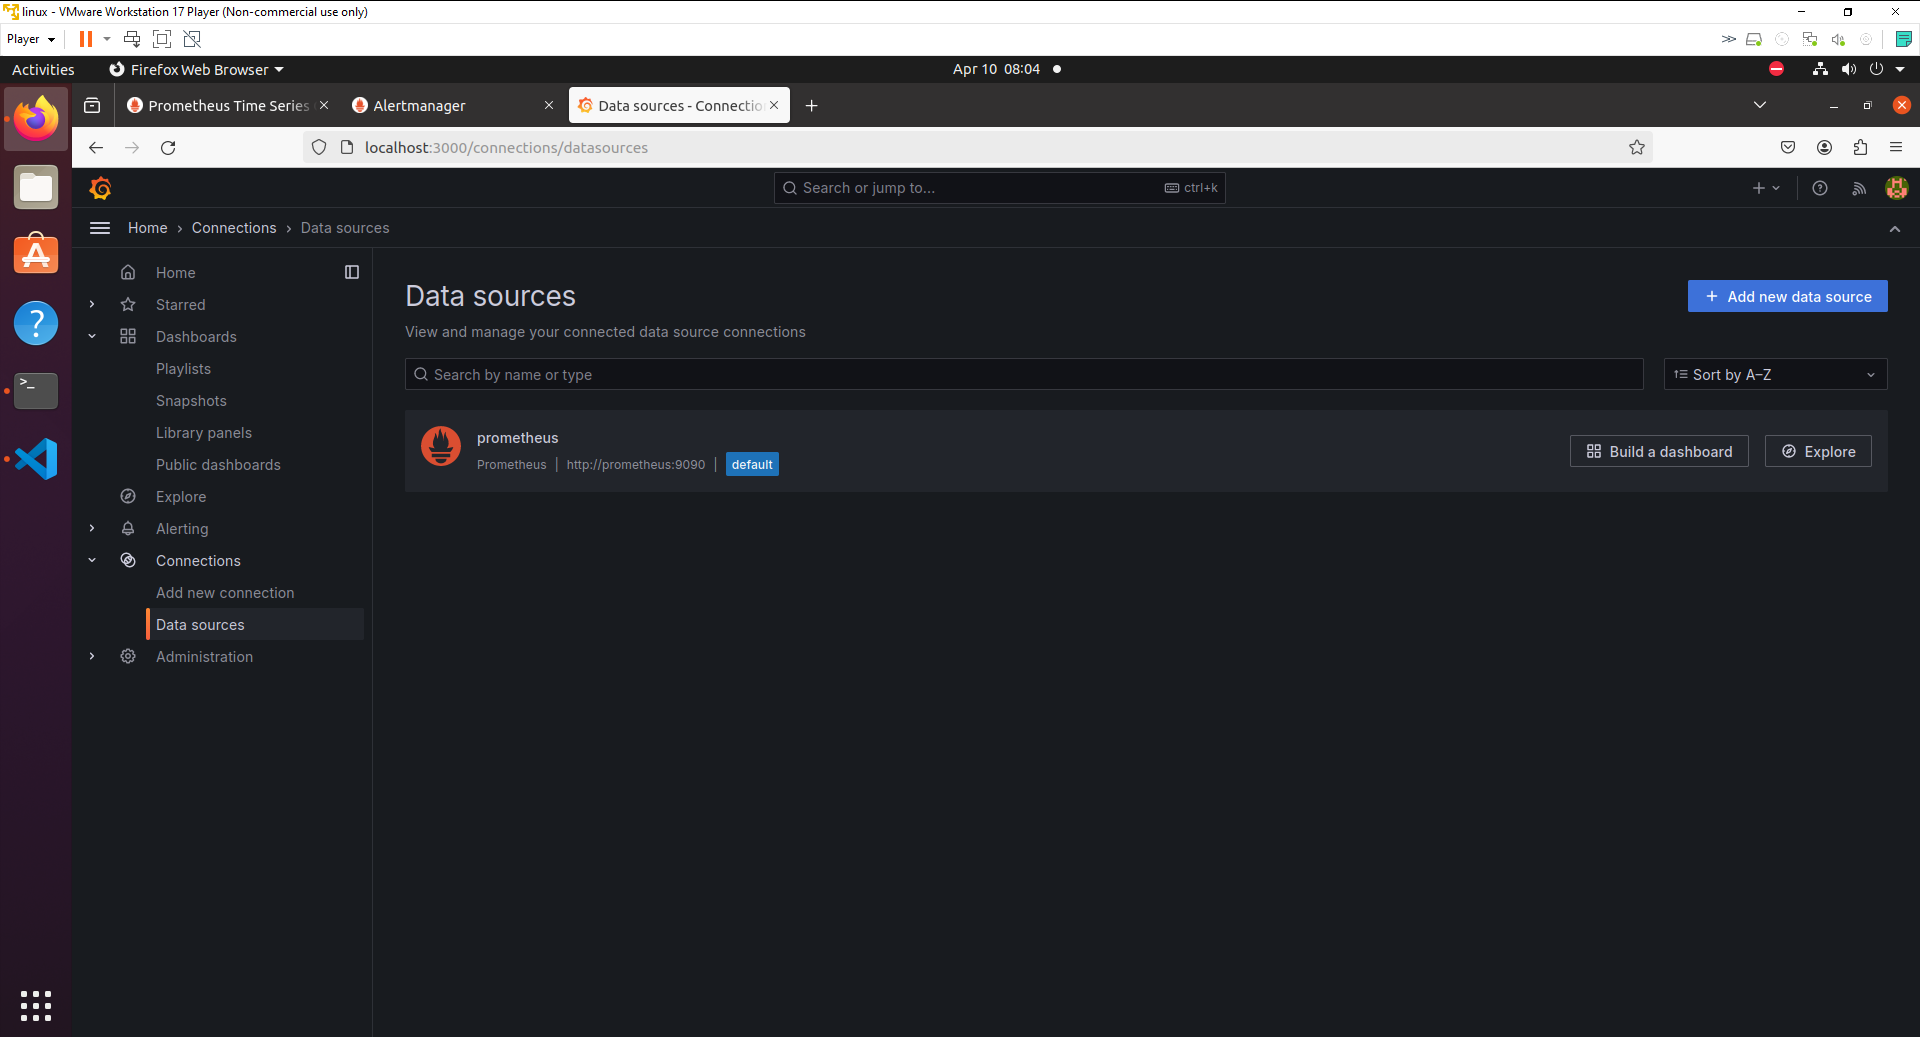

Assign data source in Grafana
- Grafana dashboards

Monitor machine dashboard

Worker1 dashboard

Worker2 dashboard
- When two worker have disconnected, status at Prometheus targets is Down

Workers are downed
- Alerts ares pushed to Alertmanager from Prometheus

Alerts about PrometheusTargetsMissing
- Alerts are sent to Telegram

- Alerts are sent to Slack

- Alerts are send to Gmail

| Software | Version |
|---|---|
| Ansible | 2.12.10 |
| Docker | 26.0.0 |
| Docker Compose | 1.25.0 |
| VMware Workstation Player | 17 |