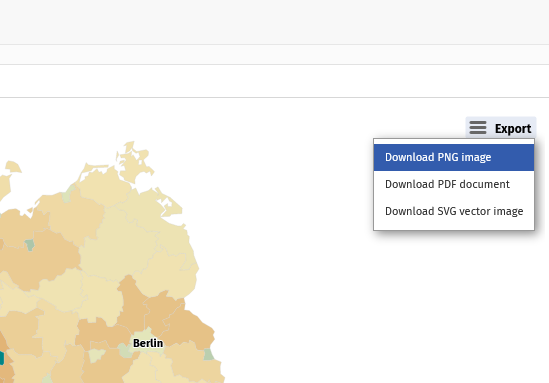
This interactive dashboard visualizes how many people have been commuting between states and districts in Germany. Data source: Bundesagentur für Arbeit; access via the datenguidepy package.
This is an entry for the CorrelAidX Challenge 2020 by CorrelAidX Bremen.
Dashboard on shinyapps.io (moderately mobile-friendly)
Clone this repository or download all files.
To get data using datenguidepy, run the Python script. This is only an interim solution. Ideally, the data would be queried directly when running the dashboard. That is technically doable with reticulate. However, using datenguidepy to query data inside hosted shiny apps/documents is not possible at the moment because the shinyapps.io server does not have Python>=3.6.1, which is a requirement for pandas>=1.0.0 and datenguidepy.
Having the datasets in the same directory as the pndl_dashboard.Rmd Rmarkdown file, it can be run in R with rmarkdown::run(file = "pndl_dashboard.Rmd") or using the "Run Document" button in RStudio.
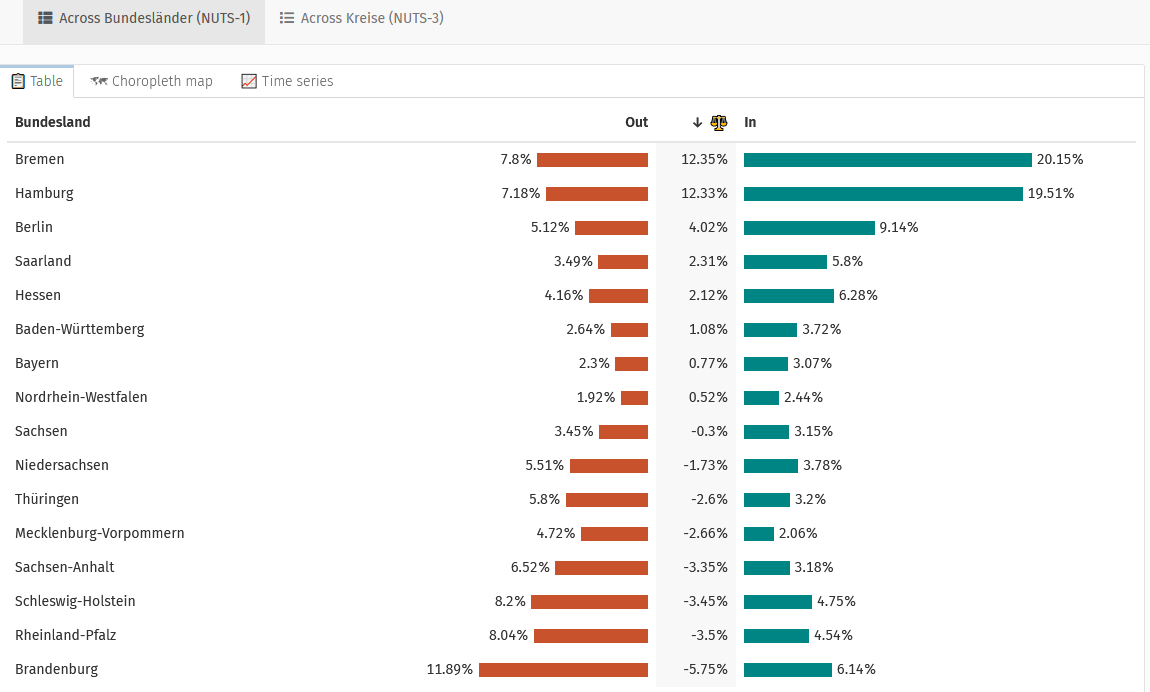
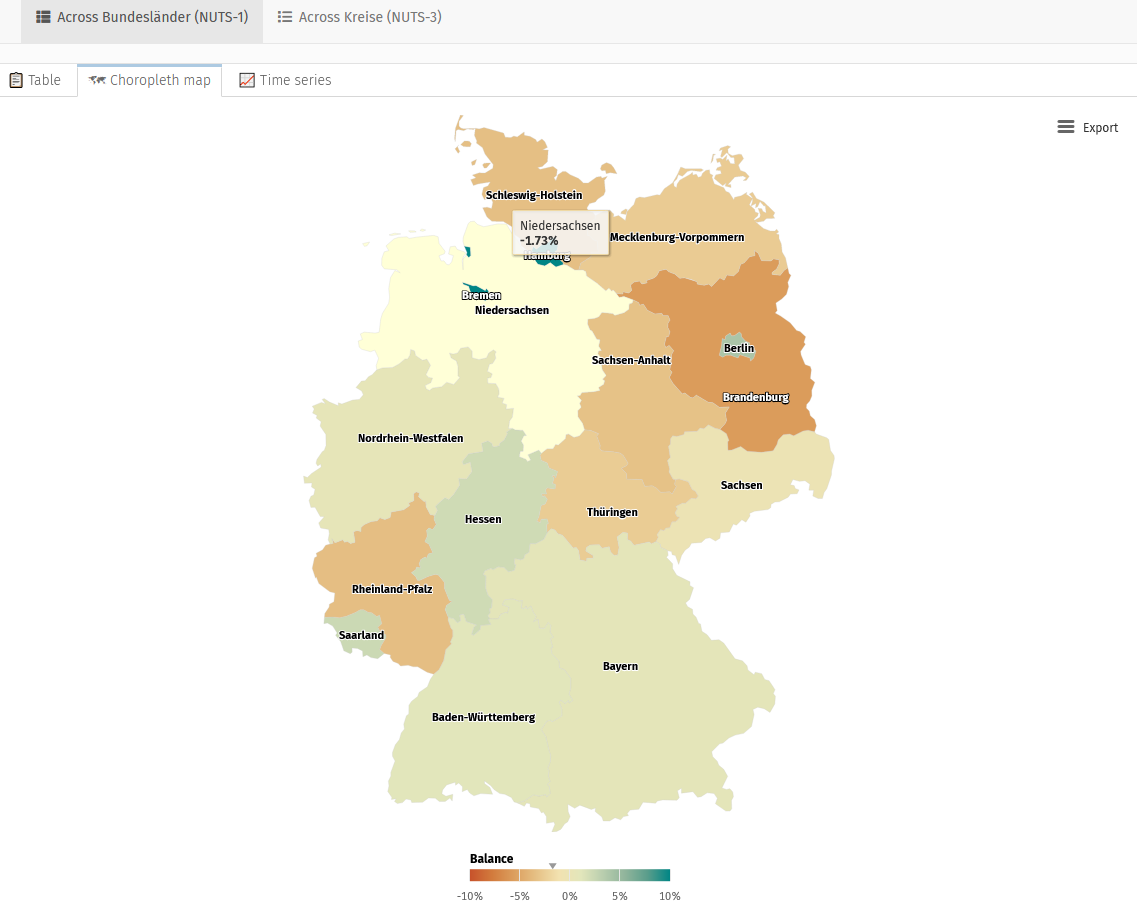
With our application you can gain insights into commuting behaviour in Germany, both on the level of "Länder" (NUTS-1) and "Kreise" (NUTS-3). You can visualize data as sortable tables with bar plots or presented as a map (zoomable for NUTS-3).
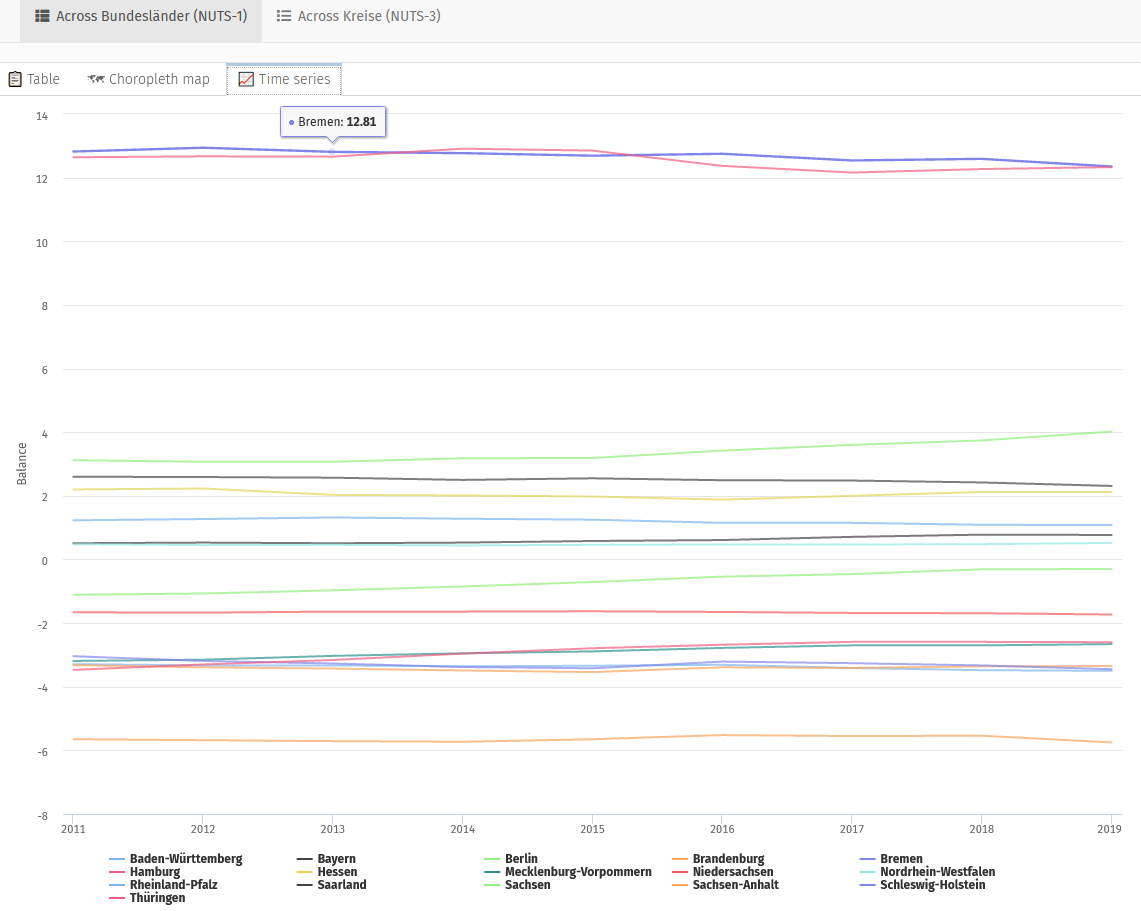
For NUTS-1 there is also a time-series graph available.
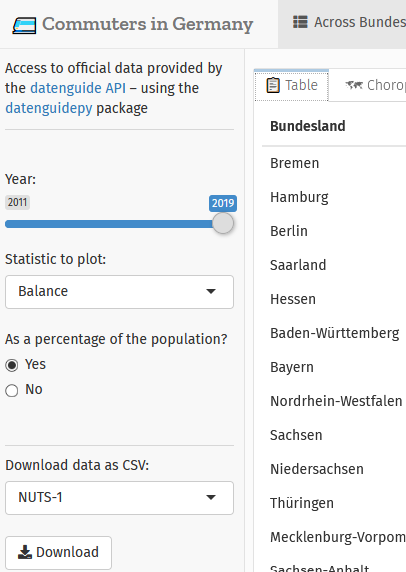
The panel on the left lets you choose
… a year between 2011 and 2019 for which numbers are shown
… whether to show commuter inflow, outflow, or balance
… whether numbers are absolute or in proportion to the regions populations
… and if you like to download the data as a .csv-file.
You can also download the maps as images in different file formats.
- Python:
- datenguidepy (access to official data)
- pandas (tidying/transforming data)
- R:
- flexdashboard, shiny, htmlwidgets (interactive web app framework)
- dplyr (transforming data)
- reactable (interactive data tables)
- highcharter (interactive plots)
- Fonts and icons: Fira Sans, Zilla Slab, Fira Code, emo(ji), Font Awesome
build the docker image
docker-compose build
run the container:
docker-compose up
or daemonized
docker-compose up
This will expose localhost:8383 (not the typical 3838)
