Python scripts to pull and, optionally, compare diurnal patterns of commonly measured pollutants
This project is licensed under the terms of the GNU General Public License v3.0, as provided with this repository.
The provided script works on the basis of requesting the existing R datafiles from the following URLS:
meta_data_url = "https://uk-air.defra.gov.uk/openair/R_data/AURN_metadata.RData" data_url = "https://uk-air.defra.gov.uk/openair/R_data/"
where the meta_data_url provides a meta-data file that is used to interpret the data_url provided files for each measurement site. This holds important information on the local authority under which the site is, or was, maintained and dates for which data is available. It also lists which parameters data is held for, such as Ozone [O3], Nitrogen Dioxide [NO2] and the mass of particulate matter smaller than 2.5 microns [PM2.5] and so on. Each site also records standard meteorological variables including wind speed, direction and temperature.
The script is run from the command line via the following:
python download_data.py
Within the Python script there are important options to make. For example:
download_path = "/AURN_data_download"This download path dictates where the R datafiles, and any subsequent .CSV files and images are stored. The top level folder structure is listed by local authority.
# In every case we need to specify a year or years to download as a list
years = [2016,2017,2018,2019,2020]
# If a single year is passed then convert to a list with a single value
if type(years) is int:
    years = [years]
current_year = datetime.datetime.now().year
years = sorted(years)

# List authorities manually, or fit to all?
manual_selection = False #This means we need to list our authorities.
                        # If in doubt, please check the name of the list_authorities in the metadata file above
                        # We again use a list of authorities as set out below
save_to_csv = False # We Concatenate dataframes into one file. If you would like to save this to a csv file, set to True

# I also provide the ability to plot diurnal comparions for O3, NO2, Ox, PM2.5 and PM10 where available
plot_diurnal_comparison = True
Here we define the list of years we want to download data for. If not this calendar year, and the data already exists in the destination folder, the script will use that existing file. For the current year [2020 or later], the script will delete and re-download the file as data is updated. If the option for manual_selection is set to 'True', you will need to specify the local authorities in a list. If you do not know what these are, you can interrogate the meta-data dataframe within the Python interpreter following, for example, the command:
print(metadata['AURN_metadata'][metadata['AURN_metadata'].local_authority)If manual_selection is set to 'True' then the script will download data from each authority IF it is available for the chosen years. Indeed, if you select a list of years for which no data is available, no datya can be downloaded. Whilst the script saves each individual R datafile, per year, there is also the option to save the concatenated dataframe for all years as a .CSV file in the relevant local authority folder. Each file also stores the latitude and longitude coordinates.
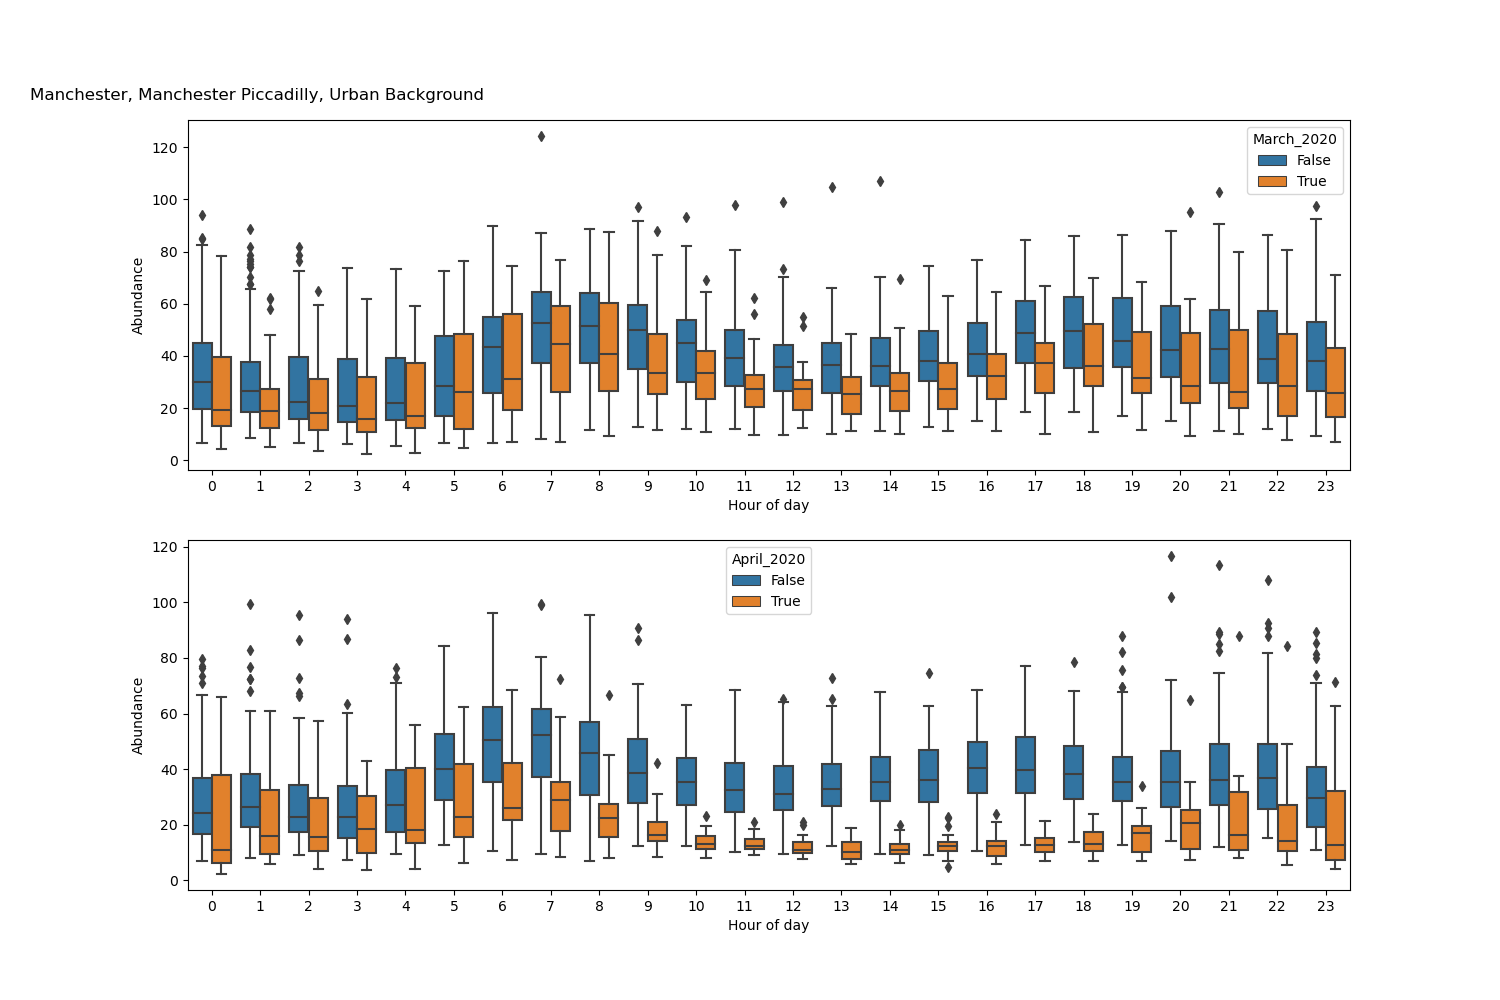
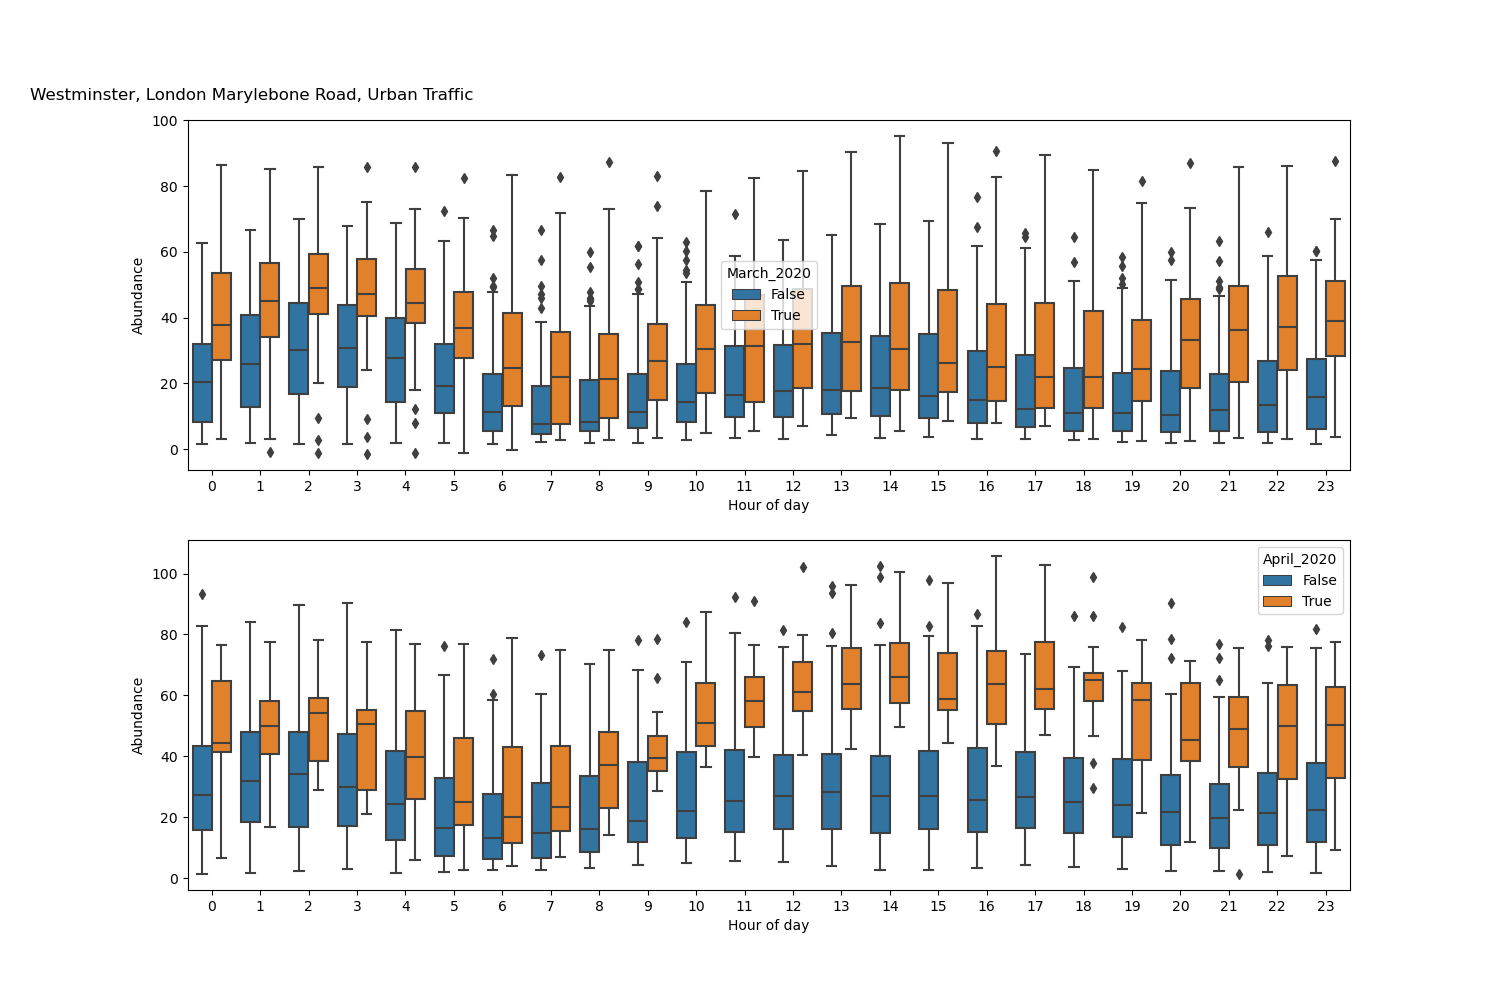
For plotting changes in diurnal profiles, if you set plot_diurnal_comparison to 'True' as per the above, the file will also produce a box-plot comparison of diurnal profiles for all available pollutant prodcuts, with examples given in the picture above. In the code, the default comparisons are for March and April in 2020 as compared with all previous years defined in the list 'years'. For example, you will find the following code:
for entry in site_data_dict[site].columns:
    if entry in ['O3', 'NO2', 'NO', 'PM2.5', 'Ox', 'NOx']:
        mask_march_tag_20 = (site_data_dict[site].index.month == 3) & (site_data_dict[site].index > '2019-12-30')
        mask_april_tag_20 = (site_data_dict[site].index.month == 4) & (site_data_dict[site].index > '2019-12-30')
        mask_march = (site_data_dict[site].index.month == 3)
        mask_april = (site_data_dict[site].index.month == 4)
        site_data_dict[site]['March_2020'] = mask_march_tag_20
        site_data_dict[site]['April_2020'] = mask_april_tag_20
where the box-plots are then produce using this True/False flag set within the new dataframe for each site. You can change the masks for other months by following the above example.
The current script relies on the following Python modules

