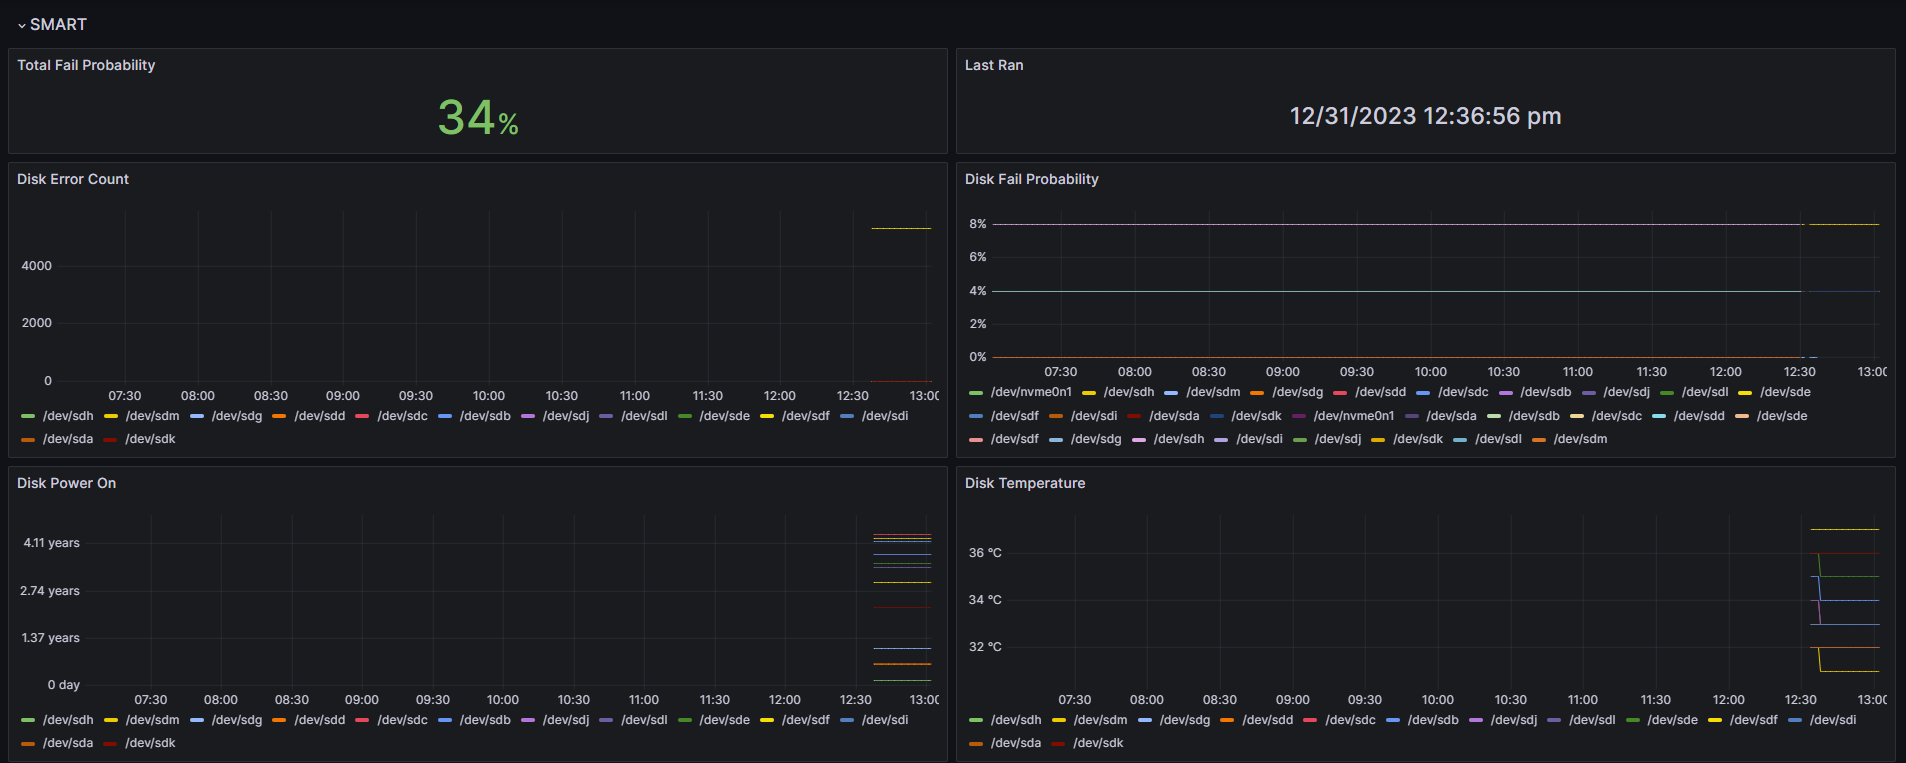
This script collects various metrics from SnapRAID operations like sync, scrub, and smart and outputs them in a format compatible with Prometheus's textfile collector.
You can find this dashboard here
- SnapRAID installed and configured
- Node Exporter with textfile collector enabled
To run the script, use the following command:
sudo ./snapraid_metrics_collector.sh [smart|scrub|sync]You can specify one or more arguments to execute specific operations. For example:
sudo ./snapraid_metrics_collector.sh smart # to run the smart operation.
sudo ./snapraid_metrics_collector.sh scrub # to run the scrub operation.
sudo ./snapraid_metrics_collector.sh sync # to run the sync operation.
sudo ./snapraid_metrics_collector.sh smart sync # to run both smart and sync operations.Place the script in a directory, e.g., /usr/local/bin.
Make it executable: chmod +x /usr/local/bin/snapraid_metrics_collector.sh.
Configure a cron job to run the script periodically and output to a textfile collector directory:
# Run snapraid sync every day at 1 AM
0 1 * * * /usr/local/bin/snapraid_metrics_collector.sh sync > /var/lib/node_exporter/textfile_collector/snapraid_sync.prom
# Run snapraid scrub once a week on Sunday at 3 AM
0 3 * * Sun /usr/local/bin/snapraid_metrics_collector.sh scrub > /var/lib/node_exporter/textfile_collector/snapraid_scrub.prom
# Run snapraid smart every day at 5 AM
0 5 * * * /usr/local/bin/snapraid_metrics_collector.sh smart > /var/lib/node_exporter/textfile_collector/snapraid_smart.prom
Adjust the cron schedule according to your requirements.
Configure Node Exporter to read metrics from this directory. This is usually done by passing the --collector.textfile.directory flag to Node Exporter with the path to the directory. Modify the Node Exporter service file accordingly.
For example, if you are using a systemd service to manage Node Exporter, edit the service file (typically located at /etc/systemd/system/node_exporter.service or /lib/systemd/system/node_exporter.service) and add the flag to the ExecStart line:
ExecStart=/usr/local/bin/node_exporter --collector.textfile.directory=/var/lib/node_exporter/textfile_collectorAfter modifying the service file, reload the systemd configuration and restart the Node Exporter service:
sudo systemctl daemon-reload
sudo systemctl restart node_exporterThe script generates the following metrics:
| Metric Name | Description |
|---|---|
snapraid_smart_exit_status |
Exit status of the last SnapRAID smart run. |
snapraid_smart_last_ran |
Timestamp of the last SnapRAID smart run. |
snapraid_smart_disk_temperature |
Disk temperature in degrees Celsius. |
snapraid_smart_disk_power_on_days |
Number of days the disk has been powered on. |
snapraid_smart_disk_error_count |
Number of errors reported by the disk. |
snapraid_smart_disk_fail_probability |
Fail probability for individual disks within the next year based on SMART values calculated by SnapRAID. |
snapraid_smart_total_fail_probability |
Fail probability for any disk failing within the next year based on SMART values calculated by SnapRAID. |
| - | - |
snapraid_scrub_exit_status |
Exit status of the last SnapRAID scrub run. |
snapraid_scrub_last_run |
Timestamp of the last SnapRAID scrub run. |
snapraid_scrub_scan_time_seconds |
Scan time for each item during SnapRAID scrub operation, in seconds. |
snapraid_scrub_file_errors |
Number of file errors found during SnapRAID scrub. |
snapraid_scrub_io_errors |
Number of I/O errors found during SnapRAID scrub. |
snapraid_scrub_data_errors |
Number of data errors found during SnapRAID scrub. |
snapraid_scrub_completion_percent |
Completion percentage of the SnapRAID scrub operation. |
snapraid_scrub_accessed_mb |
Amount of data accessed during the SnapRAID scrub operation, in MB. |
| - | - |
snapraid_sync_exit_status |
Exit status of the last SnapRAID sync run. |
snapraid_sync_last_run |
Timestamp of the last SnapRAID sync run. |
snapraid_sync_scan_time_seconds |
Scan time for each item during SnapRAID sync operation, in seconds. |
snapraid_sync_file_errors |
Number of file errors found during SnapRAID sync. |
snapraid_sync_io_errors |
Number of I/O errors found during SnapRAID sync. |
snapraid_sync_data_errors |
Number of data errors found during SnapRAID sync. |
snapraid_sync_completion_percent |
Completion percentage of the SnapRAID sync operation. |
snapraid_sync_accessed_mb |
Amount of data accessed during the SnapRAID sync operation, in MB. |
- name: Disk Alerts
  rules:
    - alert: Snapraid Disk Failure Probability
      expr: snapraid_sync_disk_fail_probability > 15
      for: 5m
      labels:
        severity: critical
      annotations:
        summary: Snapraid Disk Failure on {{ $labels.instance }} - {{ $labels.job }}
        description: "Snapraid Disk Failure (current value: {{ $value }})"

    - alert: Snapraid Total Failure Probability
      expr: snapraid_sync_total_fail_probability > 40
      for: 5m
      labels:
        severity: critical
      annotations:
        summary: Snapraid Total Failure on {{ $labels.instance }} - {{ $labels.job }}
description: "Snapraid Total Failure (current value: {{ $value }})"The script logs each SnapRAID command to a serperate file in the same directory a the script in smart.log, scrub.log, and sync.log files.
