A minimal GUI for a quick view of netCDF files. Aiming to be a drop-in replacement for ncview and panoply.
ncvue is a minimal GUI for a quick view of netCDF files. It is aiming to be
a drop-in replacement for ncview and panoply, being slightly more general than
ncview targeting maps but providing animations, zooming and panning capabilities
unlike panoply. If ncvue is used with maps, it supports mostly structured
grids, more precisely the grids supported by cartopy.
ncvue is a Python script that can be called from within Python or as a
command line tool. It is not supposed to produce publication-ready plots but
rather provide a quick overview of the netCDF file.
The complete documentation for ncvue is available from:
https://mcuntz.github.io/ncvue/
ncvue can be run from the command line:
ncvue netcdf_file.ncor from within Python:
from ncvue import ncvue
ncvue('netcdf_file.nc')
where the netCDF file is optional. The latter can also be left out and a netCDF
file can be opened with the "Open File" button from within ncvue.
Note, ncvue uses the TkAgg backend of matplotlib. It must be called
before any other call to matplotlib. This also means that you cannot launch it
from within iPython if it was launched with --pylab. It can be called from
within a standard iPython, though, or using ipython --gui tk.
When using ncvue with jupyter notebooks, one has to set %matplotlib
inline before the import and call of ncvue. You have set %matplotlib
inline again if you want to continue having inline plots in jupyter
afterwards.
%matplotlib inline
from ncvue import ncvue
ncvue('netcdf_file.nc')
%matplotlib inline
One can also install standalone macOS or Windows applications that come with
everything needed to run ncvue including Python:
- macOS app (macOS > 10.13 [High Sierra] on Intel)
- Windows executable (Windows 10)
The macOS app should work from macOS 10.13 (High Sierra) onward on Intel processors. There is no standalone application for macOS on Apple Silicon (M1) chips because I do not have a paid Apple Developer ID. Other installation options work, though.
A dialog box might pop up on macOS saying that the ncvue.app is from an
unidentified developer. This is because ncvue is an open-source software.
Depending on the macOS version, it offers to open it anyway. In later versions
of macOS, this option is only given if you right-click (or control-click) on the
ncvue.app and choose Open. You only have to do this once. It will open like
any other application the next times.
On opening, ncvue presents three panels for different plotting types:
Scatter or Line plots, Contour plots, and Maps. This is the look in macOS light
mode (higher resolution images can be found in the documentation):
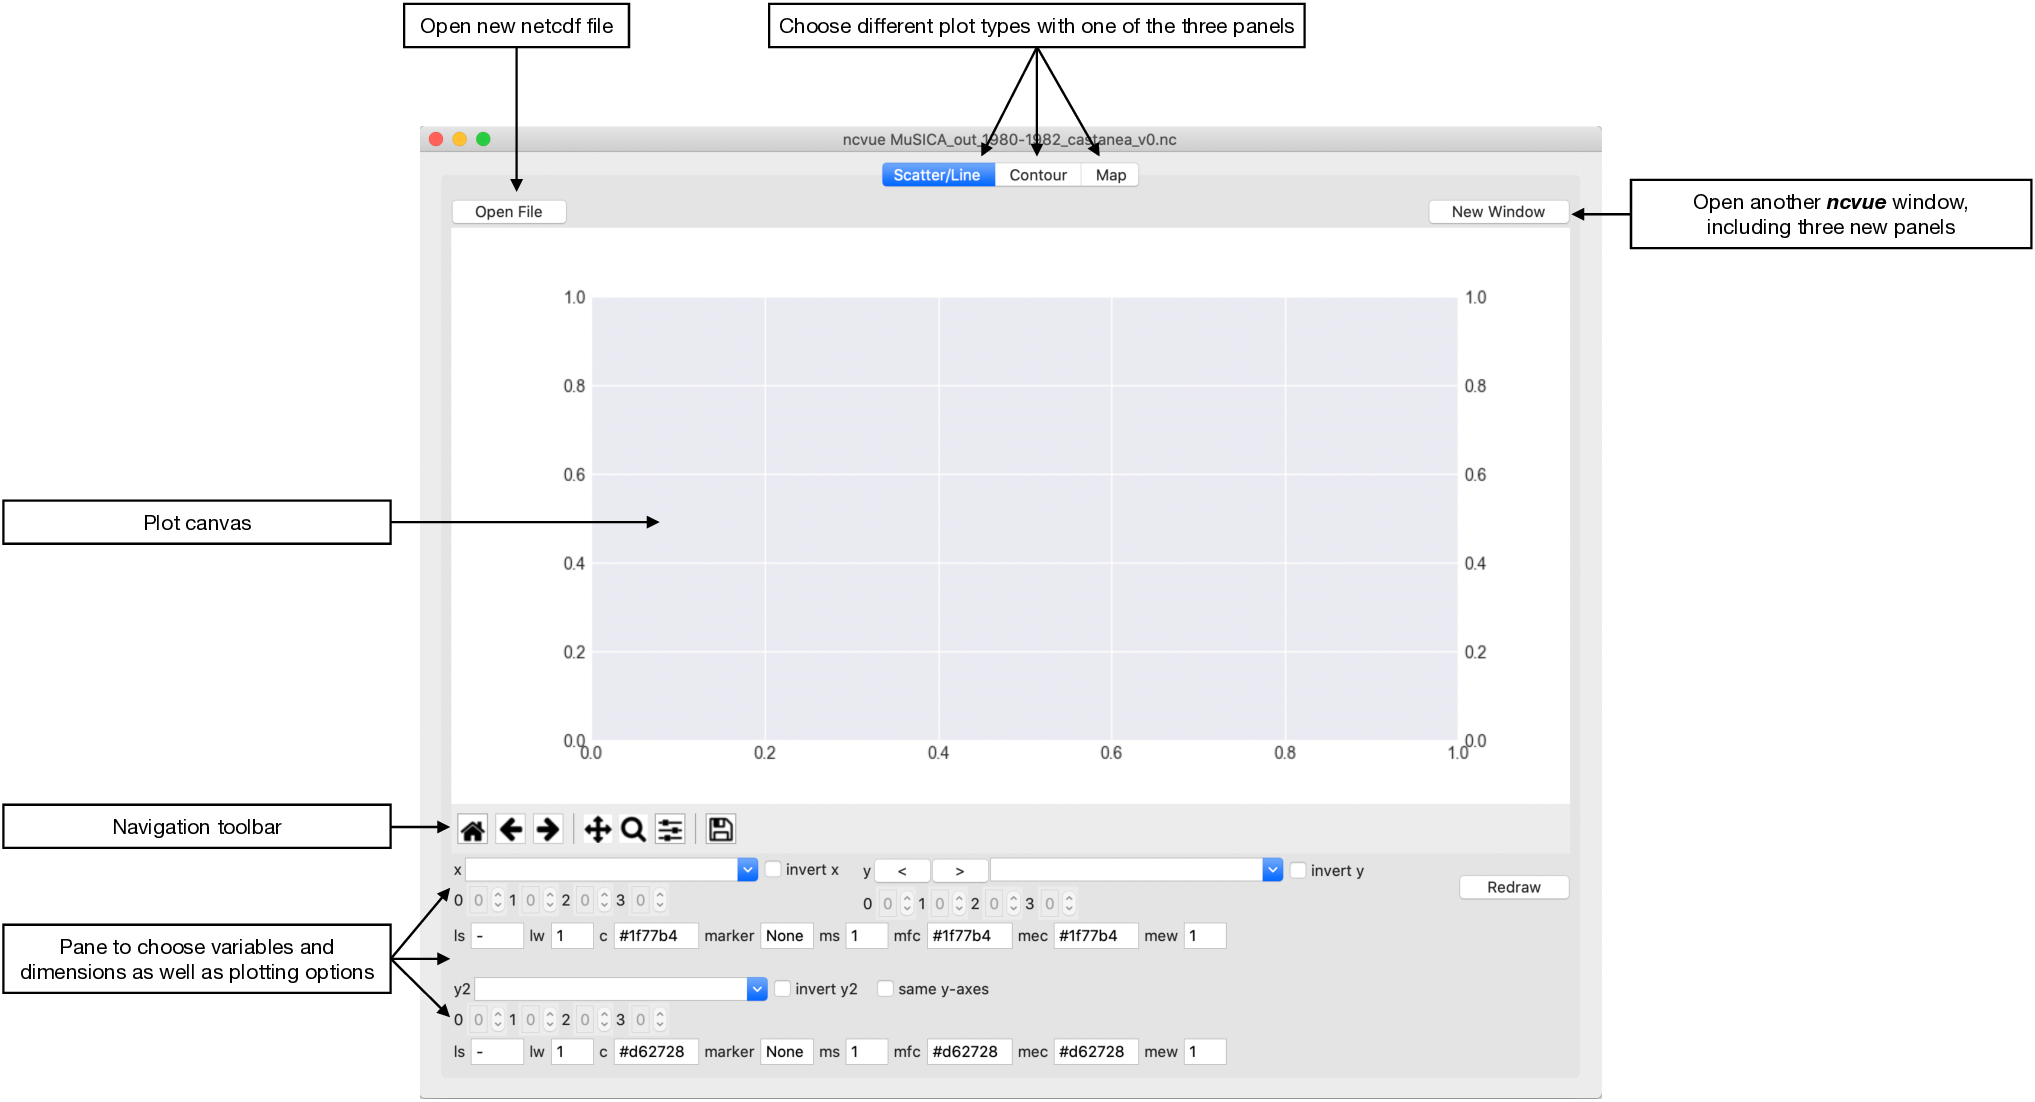
All three panes are organised in this fashion: the plotting canvas, the Matplotlib navigation toolbar and the pane, where one can choose the plotting variables and dimensions, as well as plotting options. You can always choose another panel on top, and open another, identical window for the same netCDF file with the button "New Window" on the top right.
If ncvue detects latitude and longitude variables with a size greater than
1, it opens the Map panel by default. This is the Map panel in macOS dark mode,
describing all buttons, sliders, entry boxes, spinboxes, and menus:

If it happens that the detection of latitudes and longitudes did not work automatically, you can choose the correct variables manually. Or you might use the empty entries on top of the dropdown menus of the latitudes and longitudes, which uses the index and one can hence display the matrix within the netCDF file. You might want to switch of the coastlines in this case.
You might want to switch off the automatically detected "global" option sometimes if your data is on a rotated grid or excludes some regions such as below minus -60 °S.
All dimensions can be set from 0 to the size of the dimension-1, to "all", or to any of the arithmetic operators "mean", "std" (standard deviation), "min", "max", "ptp" (point-to-point amplitude, i.e. max-min), "sum", "median", "var" (variance).
Be aware that the underlying cartopy/matplotlib may (or may not) need a long time to plot the data (with the pseudocolor 'mesh' option) if you change the central longitude of the projection from the central longitude of your data, which is automatically detected if "central lon" is set to None. Setting "central lon" to the central longitude of the input data normally eliminates the problem.
If ncvue does not detect latitude and longitude variables with a size
greater than 1, it opens the Scatter/Line panel by default. This is the
Scatter/Line panel in macOS dark mode, describing all buttons, sliders, entry
boxes, spinboxes, and menus:
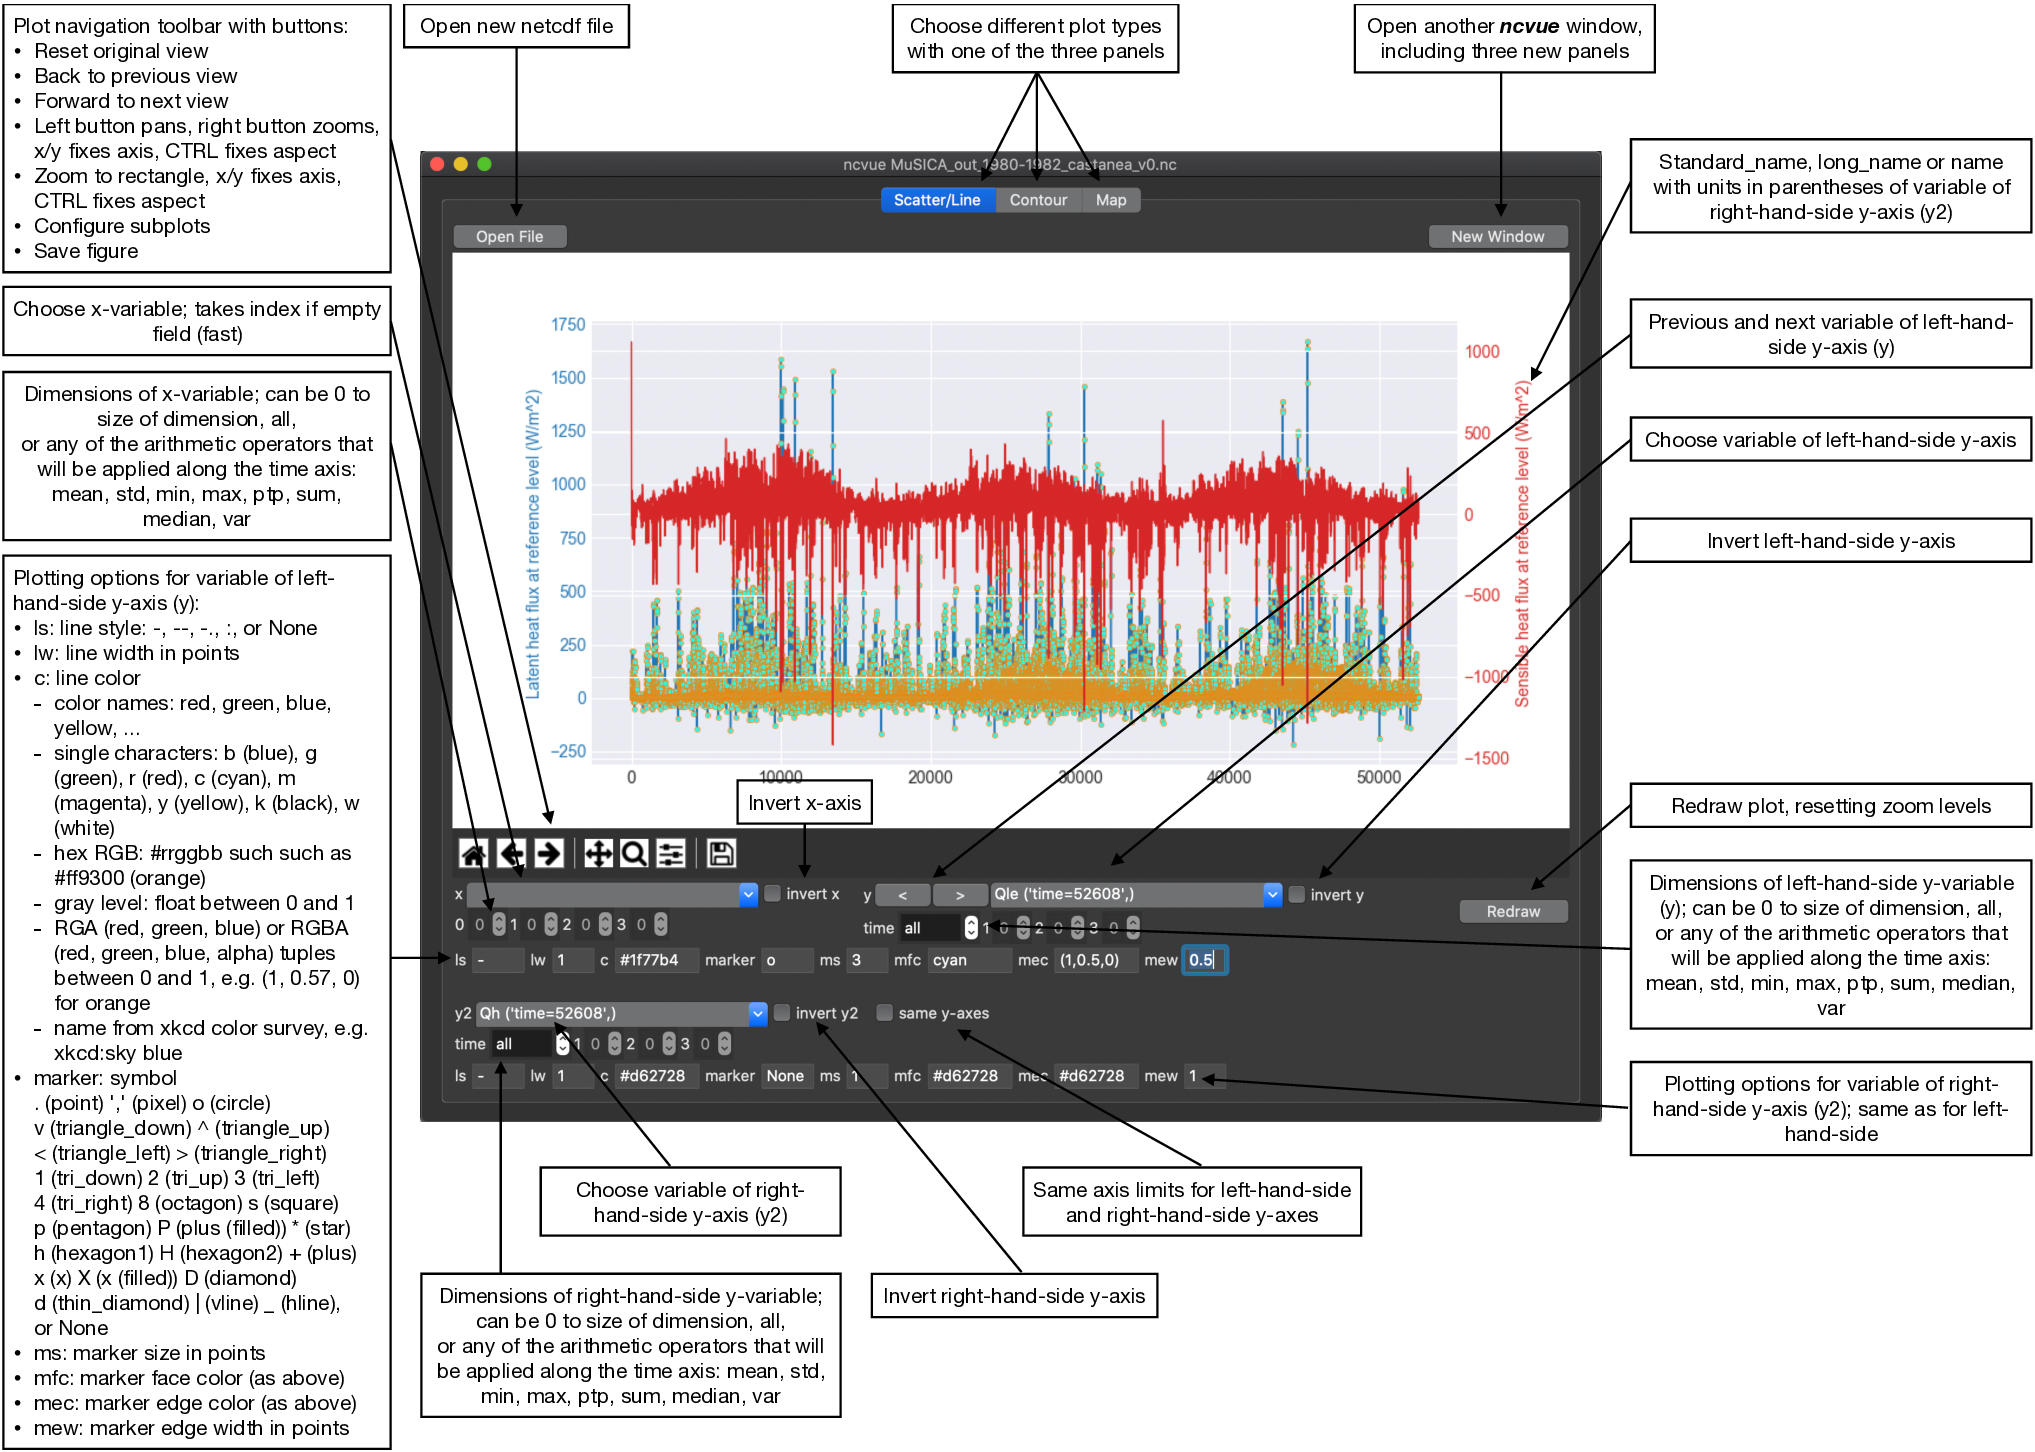
The default plot is a line plot with solid lines (line style 'ls' is '-'). One can set line style 'ls' to None and set a marker symbol, e.g. 'o' for circles, to get a scatter plot. A large variety of line styles, marker symbols and color notations are supported.
ncvue builds automatically a datetime variable from the time axis. This is
correctly interpreted by the underlying Matplotlib also when zooming into or
panning the axes. But it is also much slower than using the index. Selecting the
empty entry on top of the dropdown menu for x uses the index for the x-axis
and is very fast. Plotting a line plot with 52608 time points takes about 2.2 s
on my Macbook Pro using the datetime variable and about 0.3 s using the index
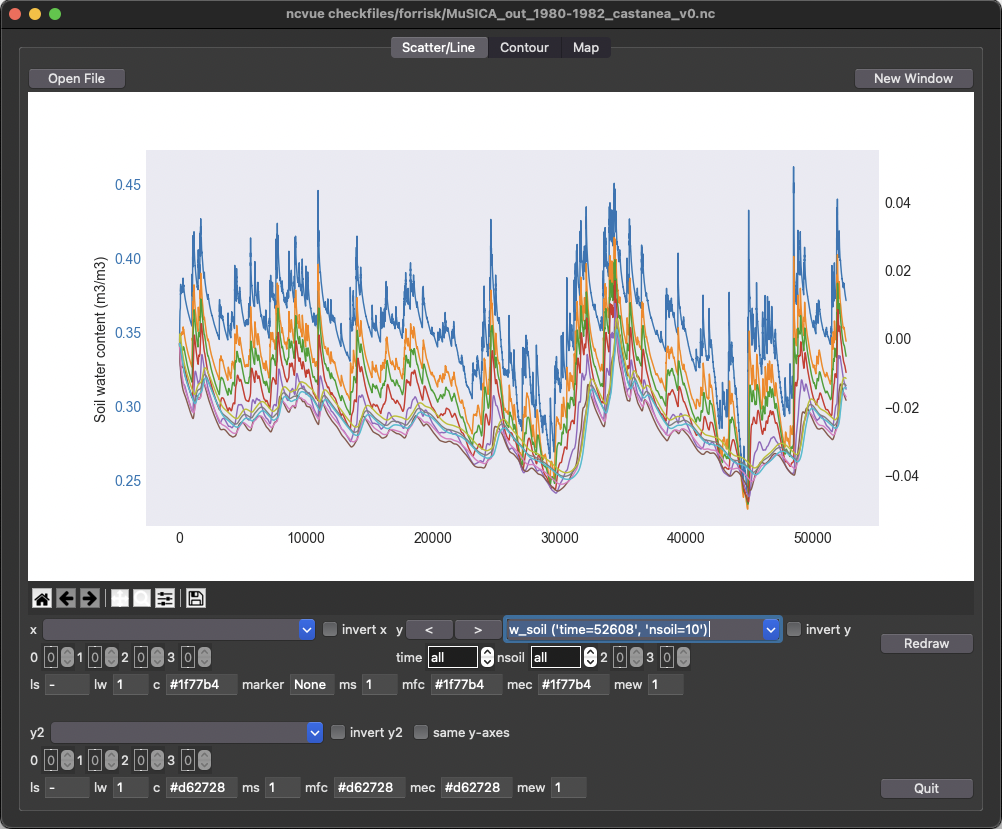
(i.e. empty x-variable). This is especially true if one plots multiple lines
with 'all' entries from a specific dimension. Plotting all 10 depths of soil
water content for the 52608 time points, as in the example below, takes also
about 0.3 s if using the index as x-variable but more than 11.1 s when using the
datetime variable.
The last panel provide by ncvue draws contour plots. This is the
Contour panel in macOS dark mode, describing all buttons, sliders, entry
boxes, spinboxes, and menus:
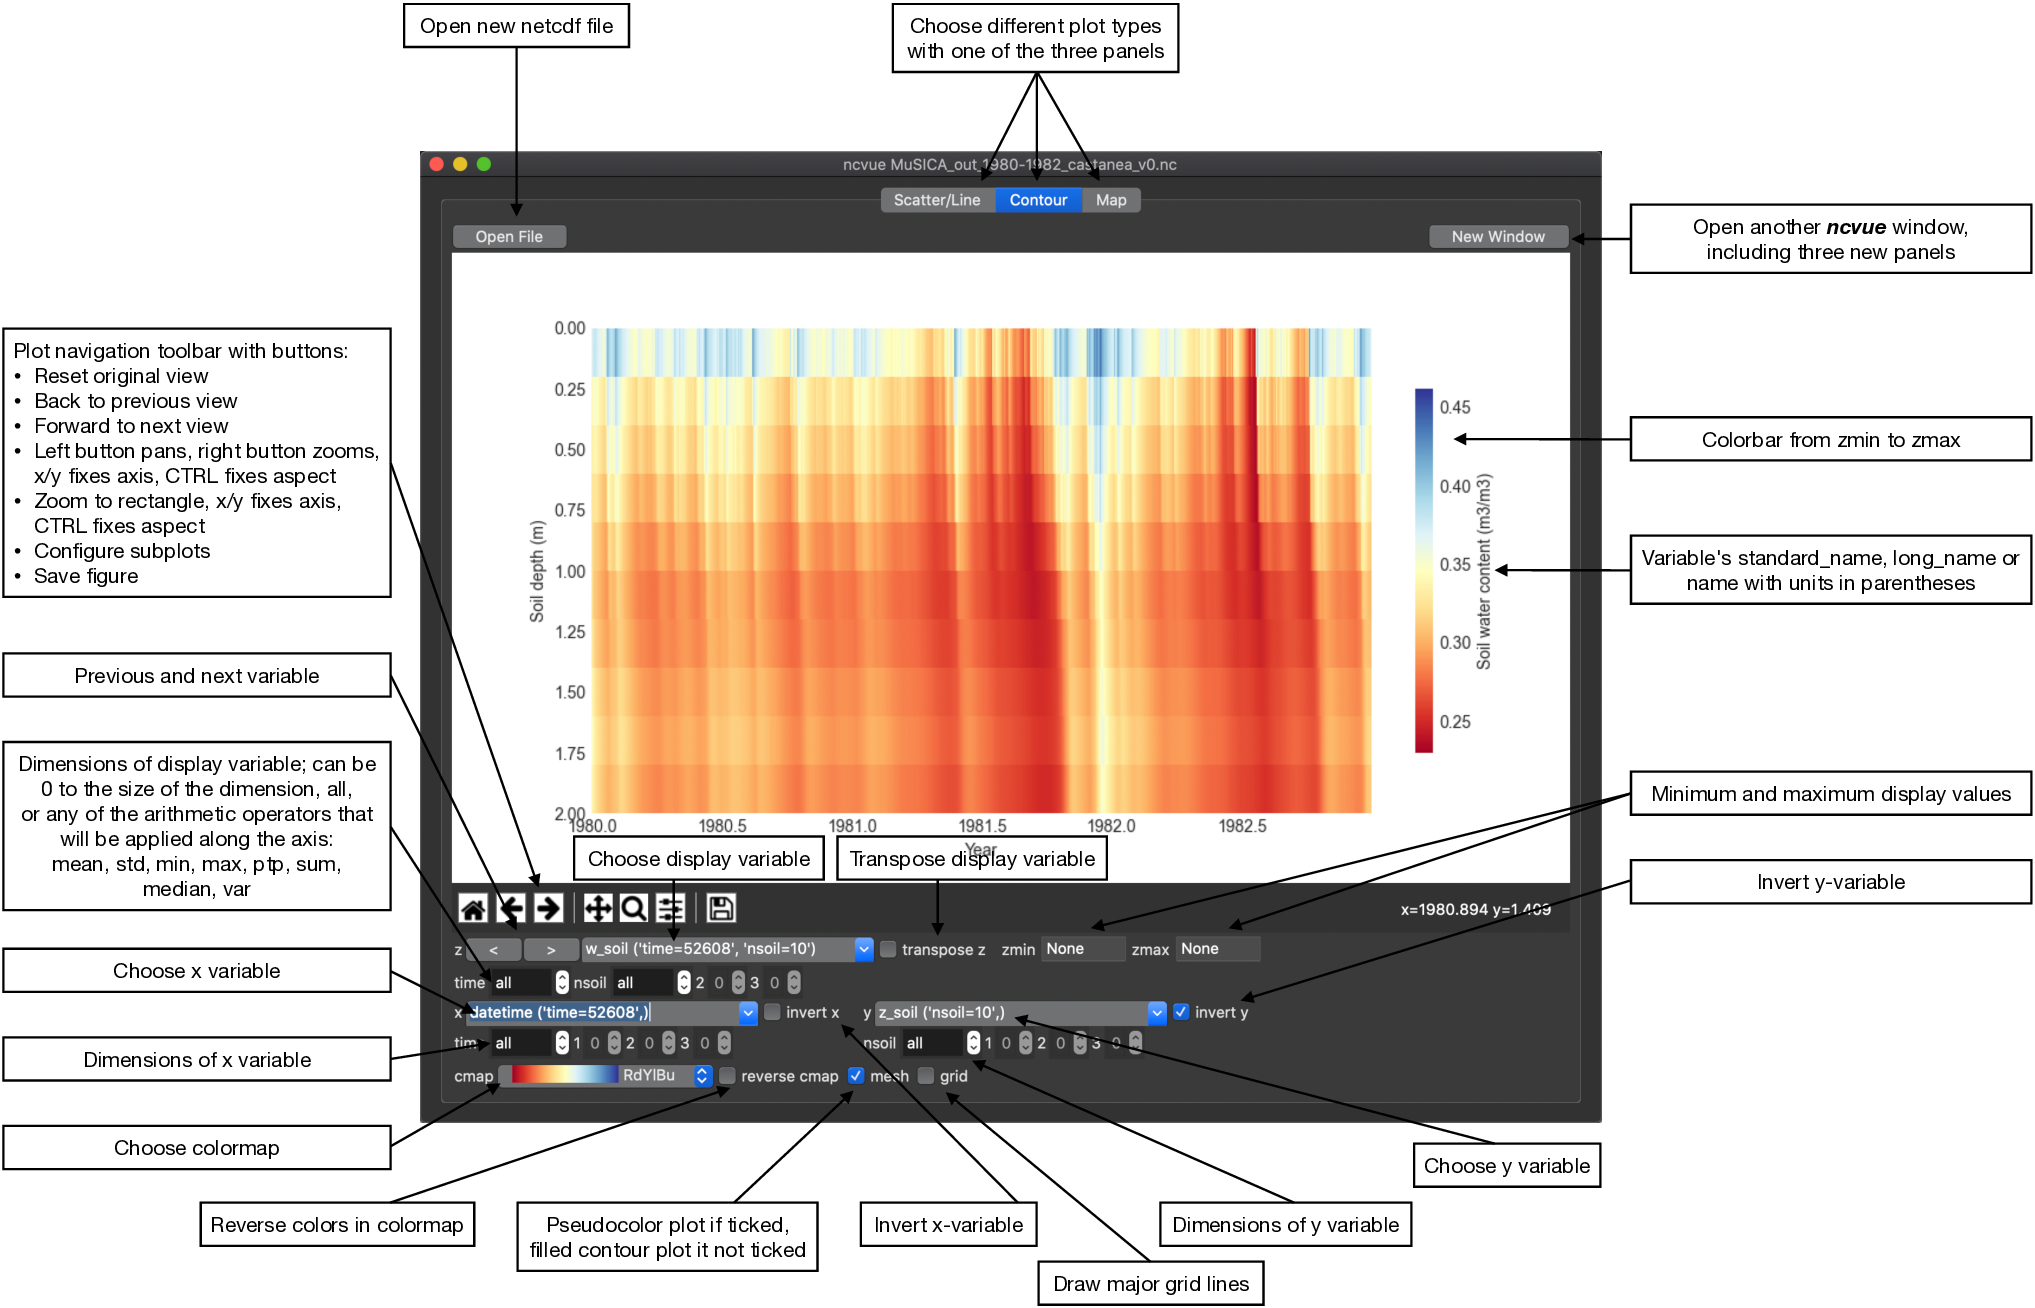
This produces also either pseudocolor plots ('mesh' ticked) or filled contour plots ('mesh' unticked) just as the Map panel but without any map projection.
ncvueis an application written in Python. If you have Python installed,- then the best is to install
ncvuewithin the Python universe. The easiest way to installncvueis thence via pip if you have cartopy installed already:
pip install ncvueCartopy can, however, be more elaborate to install. The easiest way to
install Cartopy is by using Conda and then installing ncvue by pip.
After installing, for example, Miniconda:
conda install -c conda-forge cartopy
pip install ncvue
We also provide a standalone macOS app and a Windows executable that come with
everything needed to run ncvue including Python. The macOS app should work
from macOS 10.13 (High Sierra) onward. It is, however, only tested on macOS
10.15 (Catalina). Drop me a message if it does not work on newer operating
systems.
See the installation instructions in the documentation for more information.
ncvue is distributed under the MIT License. See the LICENSE file for
details.
Copyright (c) 2020-2022 Matthias Cuntz
ncvue uses the Azure theme by rdbende on Linux and the Sun Valley theme
also by rdbende on Windows.
Standalone applications are produced with cx_Freeze, currently maintained by Marcelo Duarte.
The project structure of ncvue was very originally based on a template
provided by Sebastian Müller but has evolved considerably.
Different netCDF test files were provided by Juliane Mai.