More documentation about datasource plugins can be found in the Docs.
Clone this project into grafana plugin directory , then restart grafana.
In mac the plugin directory is /usr/local/var/lib/grafana/plugins.
After install the plugin ,restart grafana
brew services start grafana
In datasource management panel, add a datasource with the type "LogService".
In Http settings, set Url = http://${log_service_endpoint} . e.g. Your projectName is accesslog in qingdao region, then the url is http://cn-qingdao.log.aliyuncs.com.
Access : select Server(Default)
log service details:
set Project and logstore
AccessId and AccessKey : it is better to use a sub user accessId and accessKey.
To ensure data security, AK is saved and cleared without echo
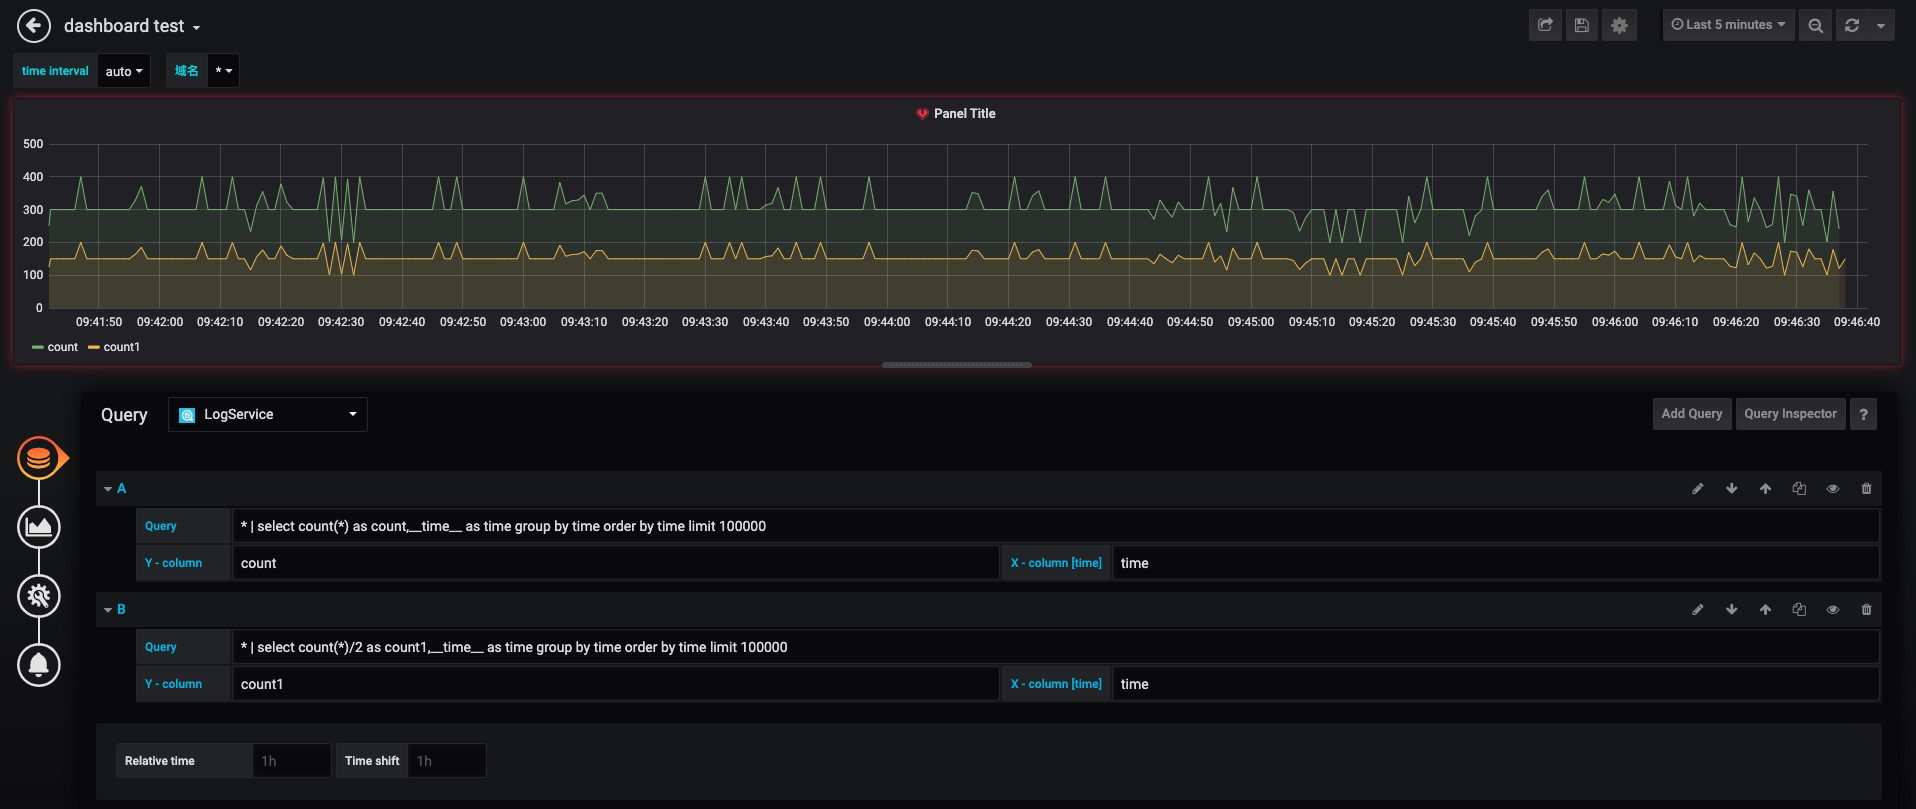
Add a panel, in the datasource option, choose the log service datasource that is just created.
In the query : insert your query , e.g.
*|select count(1) as c,count(1)/2 as c1, __time__- __time__%60 as t group by t limit 10000
The X column ,insert t (Second timestamp)
The Y column , insert c,c1 (Multiple columns are separated by commas)
Save the dashboard
In the top right corner of the dashboard panel, click dashboard Settings and select Variables.
Reference variables $VariableName
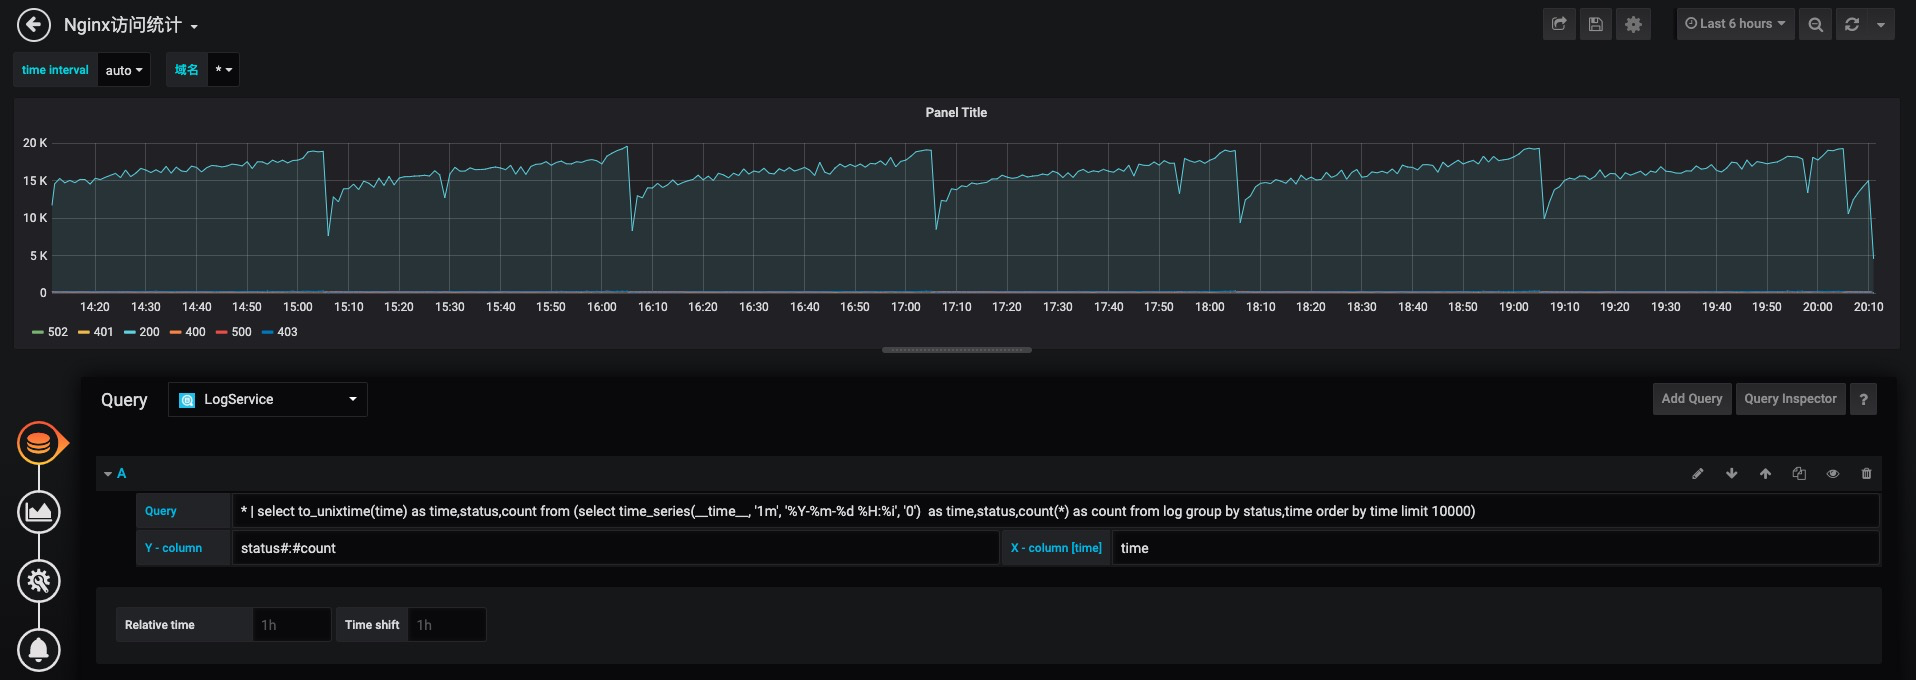
The X-axis is set to the time column
The Y-axis is set to the format col1#:#col2, where col1 is the aggregate column and col2 is the other columns
The Query sample is set to
* | select to_unixtime(time) as time,status,count from (select time_series(__time__, '1m', '%Y-%m-%d %H:%i', '0') as time,status,count(*) as count from log group by status,time order by time limit 10000)
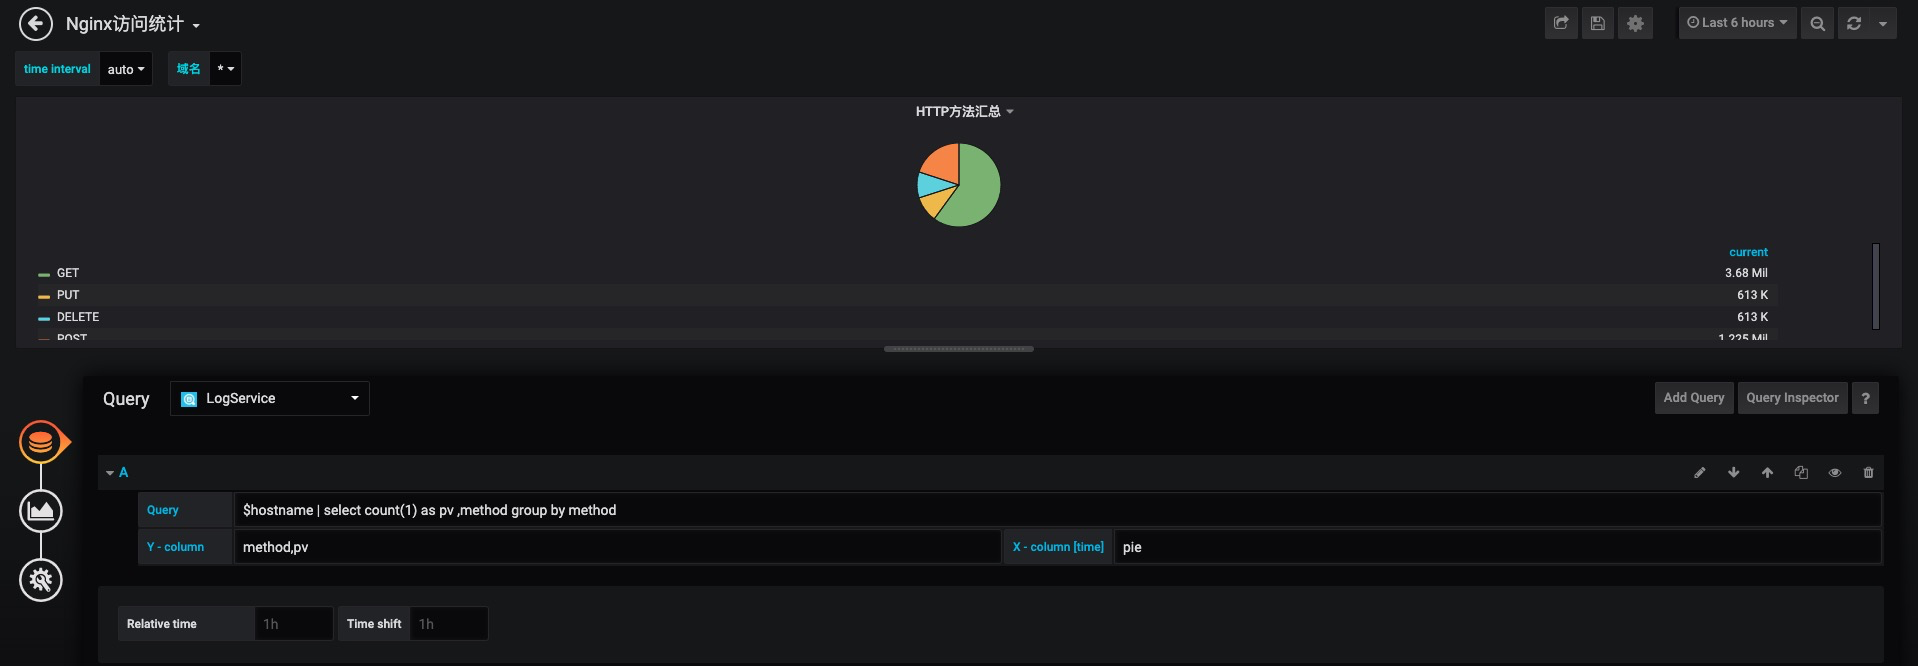
The X-axis is set to pie
The Y-axis is set to categories and numeric columns (example method,pv)
The Query sample is set to
$hostname | select count(1) as pv ,method group by method
The X-axis is set to table or null
The Y-axis is set to columns
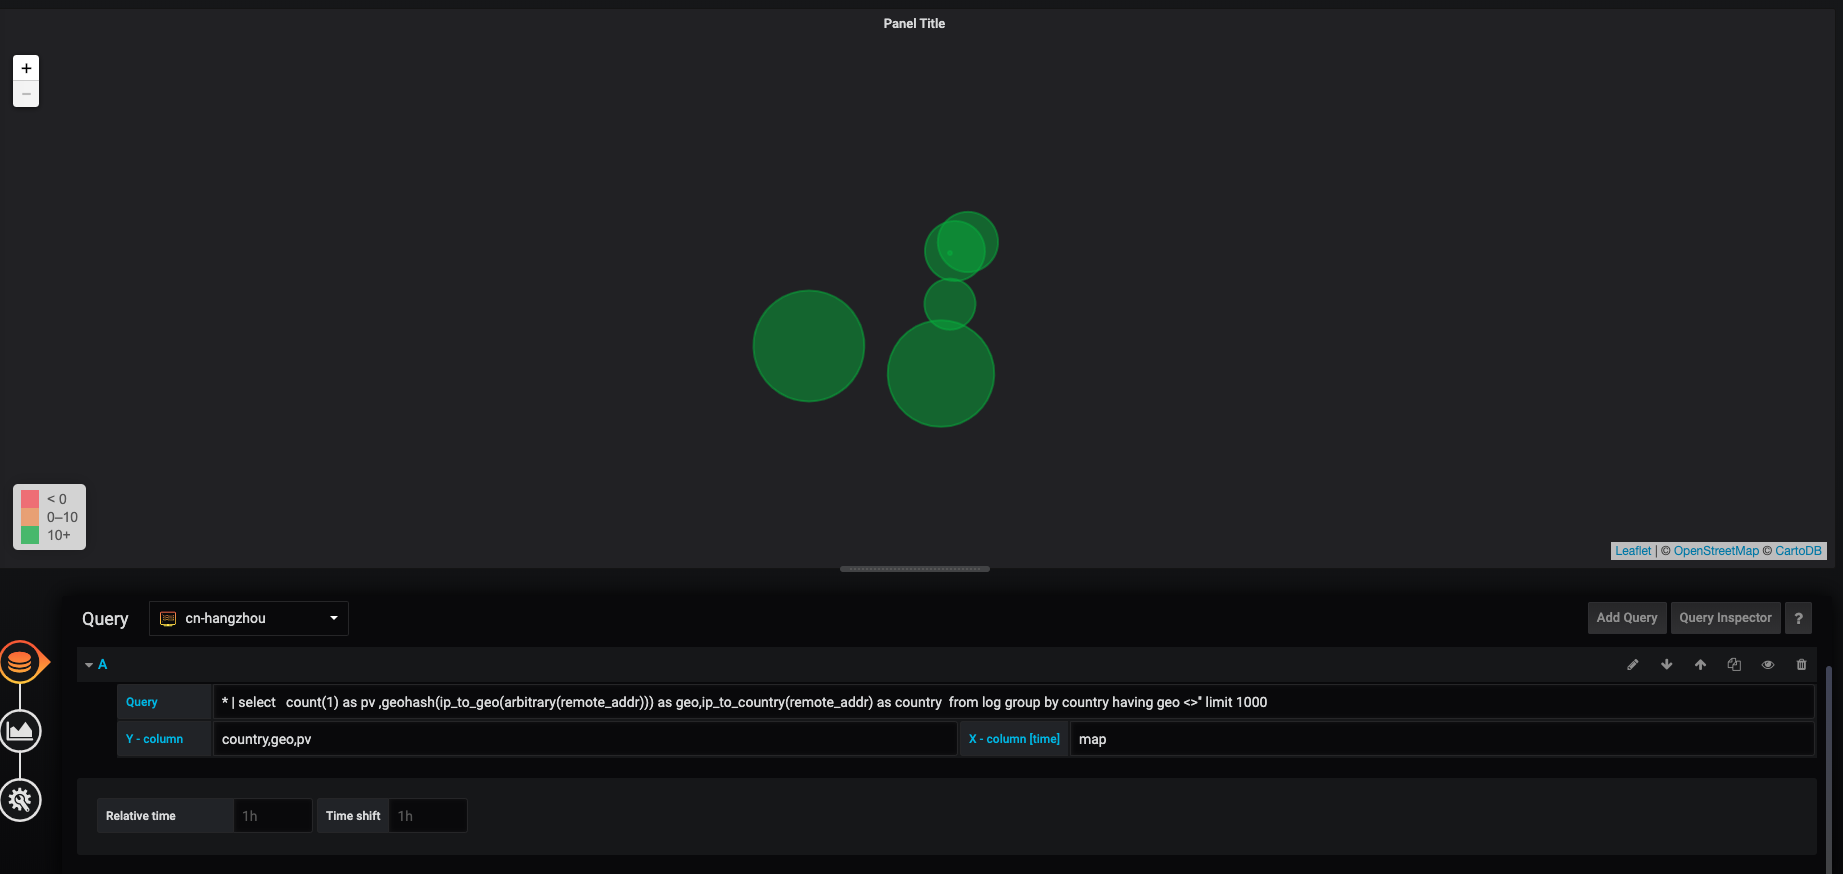
The X-axis is set to map
The Y-axis is set to country,geo,pv
The Query sample is set to
* | select count(1) as pv ,geohash(ip_to_geo(arbitrary(remote_addr))) as geo,ip_to_country(remote_addr) as country from log group by country having geo <>'' limit 1000
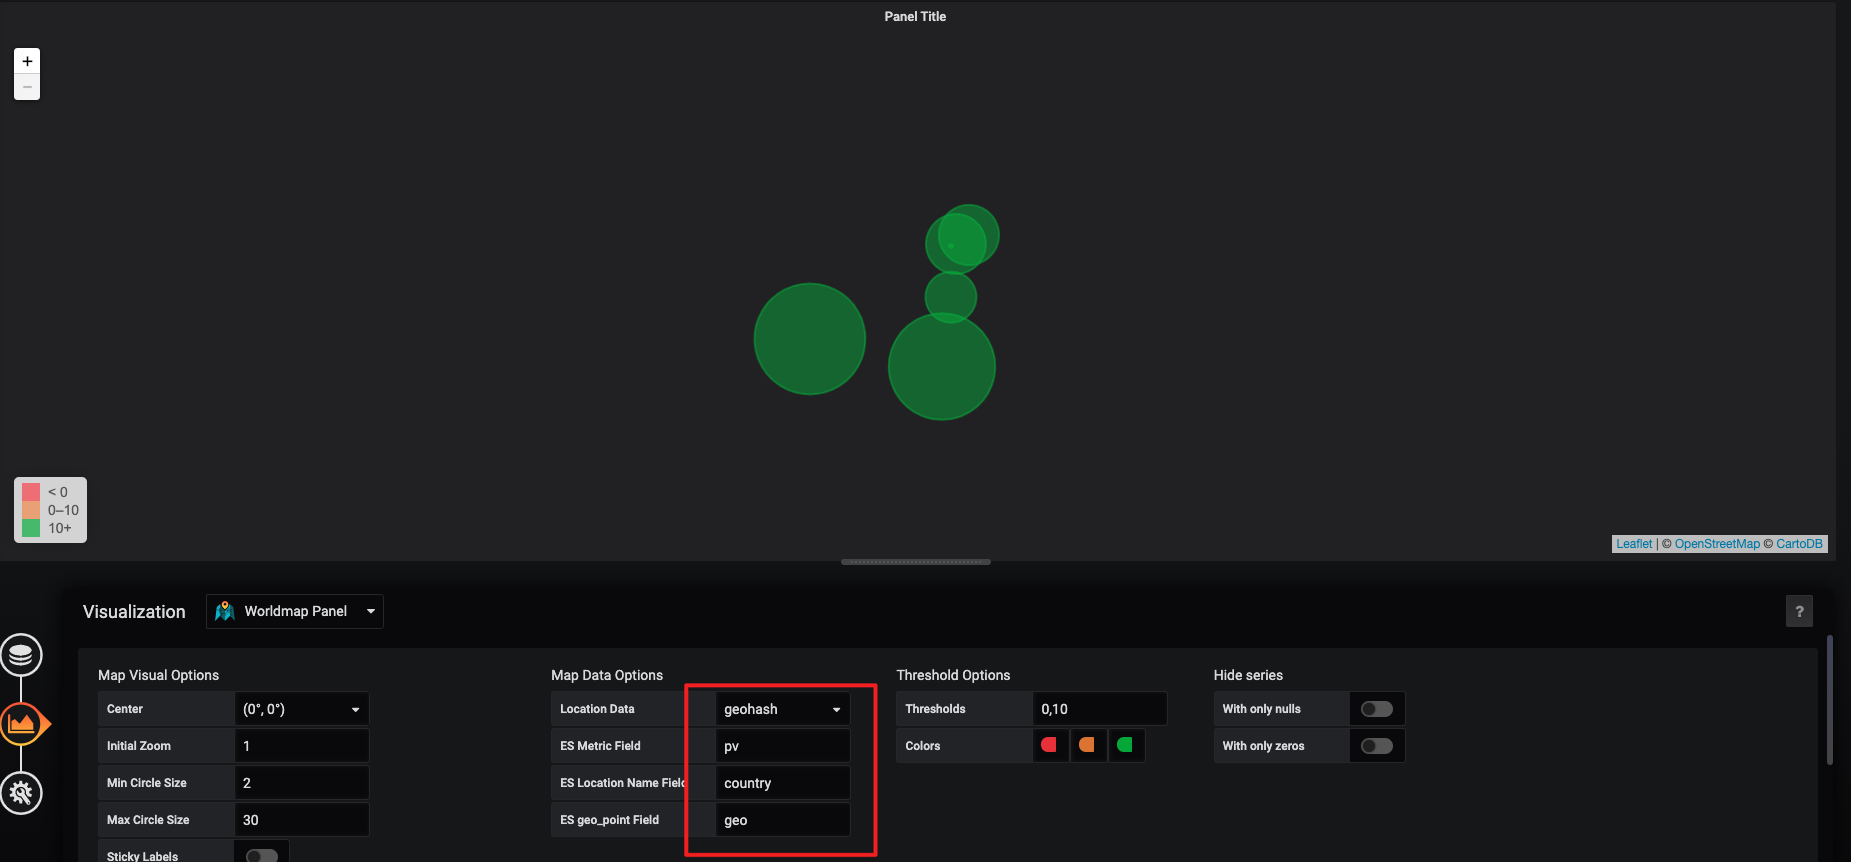
Location Data : geohash
Location Name Field : country
Geo_point/Geohash Field :" geo
Metric Field : pv
The query:
Parameter Settings:
In the alert notification panel, select New channel to add
Attention :Dashboard alert only, not plug-in alert
A sample of:
Add the alert panel:
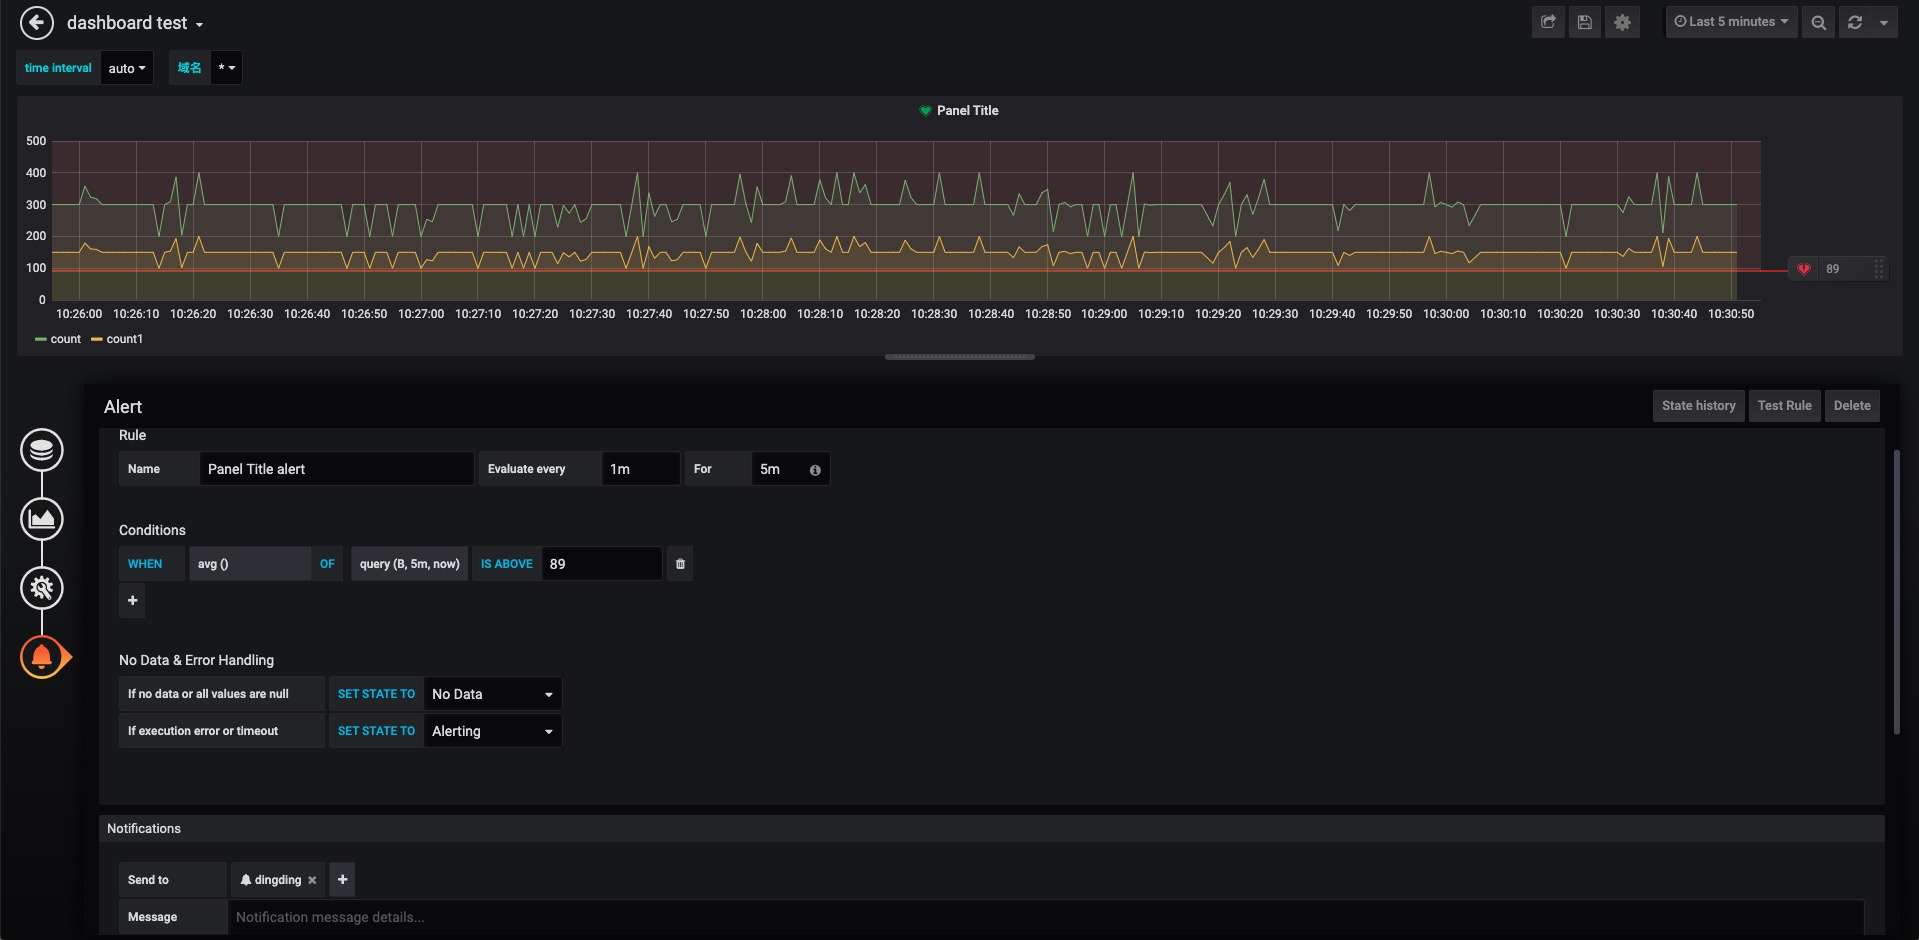
- The red line on the chart represents the set threshold. Click on the right side and drag it up and down.
- Evaluate every
1mfor5m, Is the result calculated every minute, and the threshold is exceeded for five consecutive minutes. - After setting for, if the state exceeds the threshold value and changes from Ok to Pending, the alarm will not be triggered. After continuously exceeding the threshold value for a period of time, the alarm will be sent. If the state changes from Pending to Alerting, the alarm will only be notified once.
- WHEN
avg ()OFquery (B, 5m, now)IS ABOVE89, That means line B has an average of more than 89 alarms in the last five minutes. - Add notification mode and notification information under Notifications.
Backend plugins: Unsigned external plugins should not be loaded by default #24027
@WPH95 made a great contribution to this project.
Thanks for the excellent work by @WPH95.