Aaaaall my talk slides
(Almost) all my talks as GIFs and PDFs. I update it from time to time.
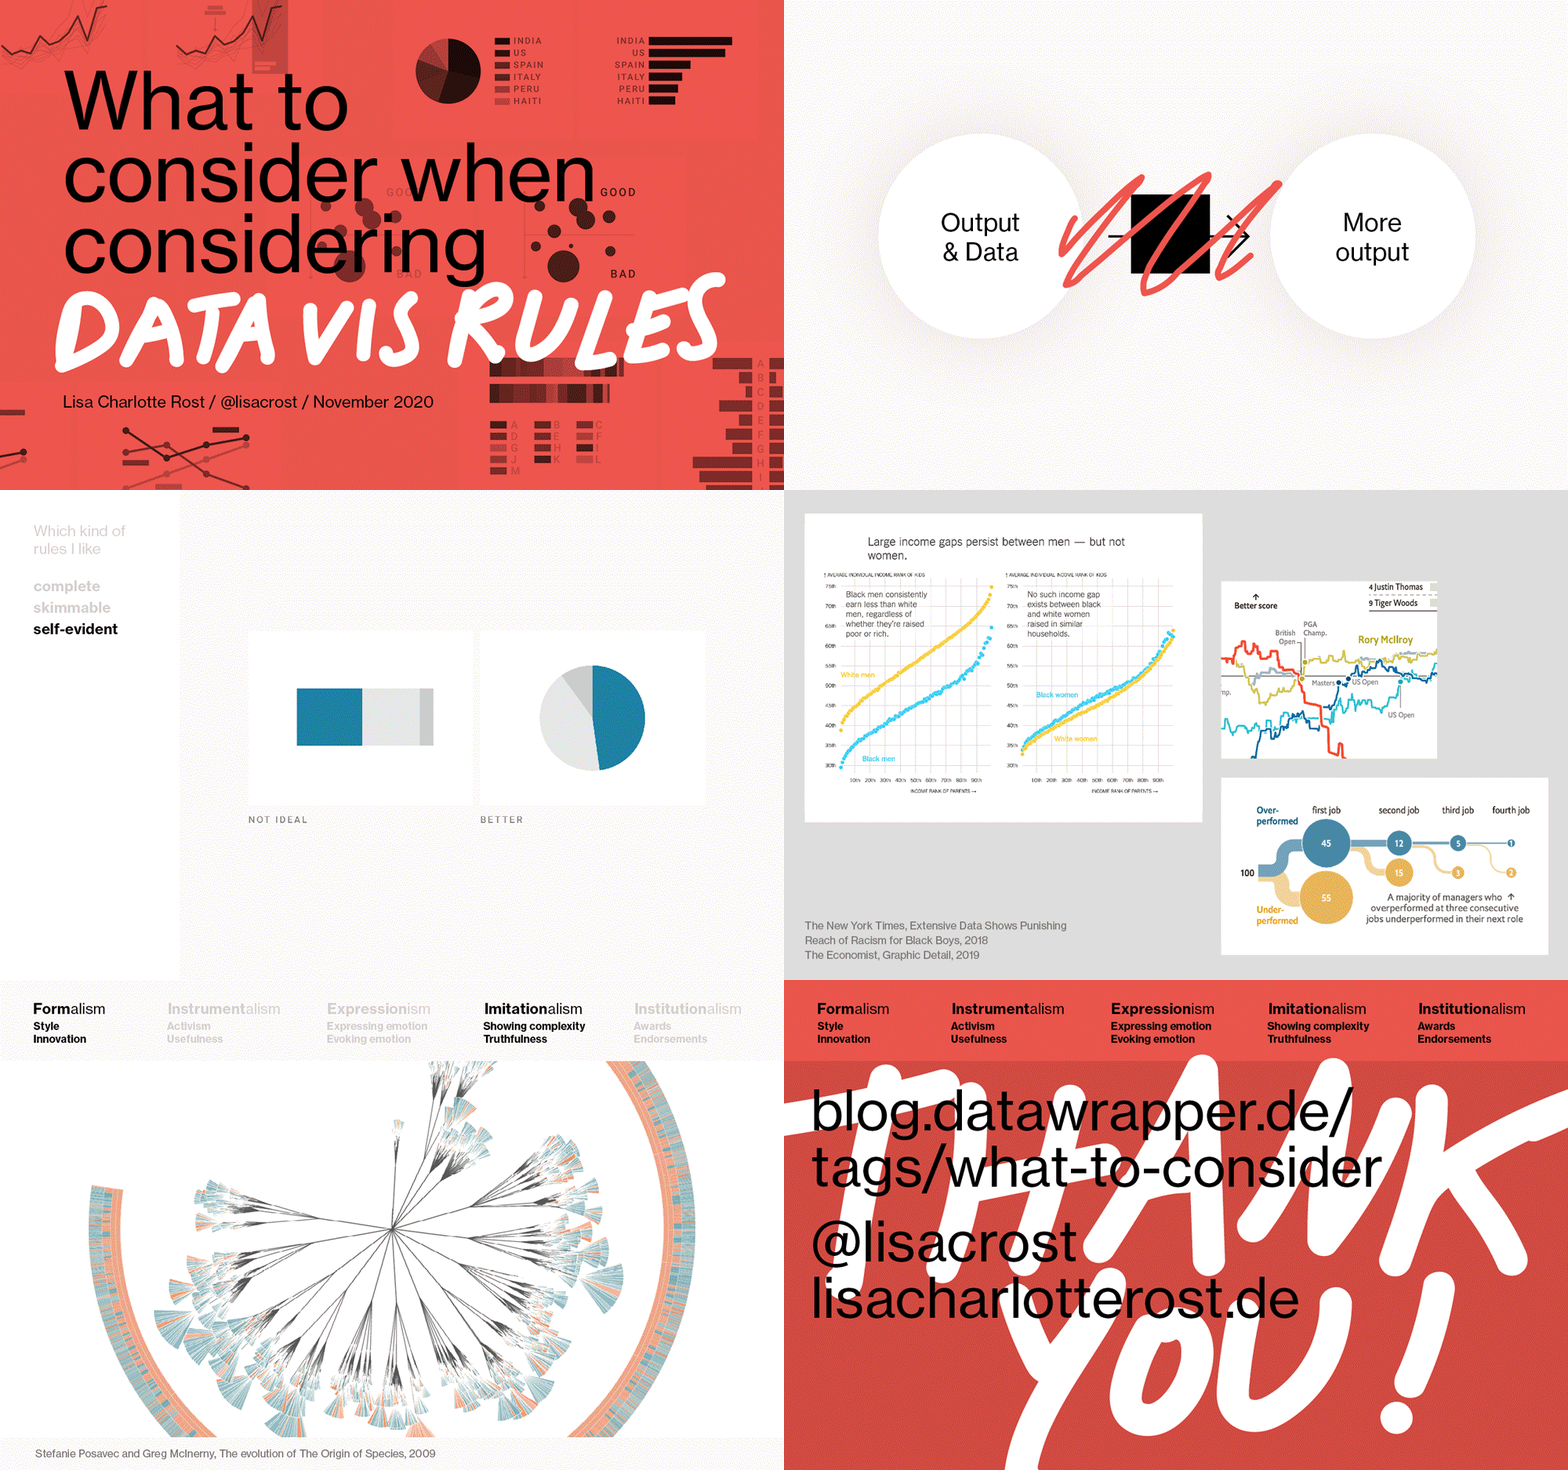
What to consider when considering data vis rules
PDF, Transcript, Recording (will follow)
Where? "S-H-O-W conference", organized online by Graphic Hunters
When? November 2020
How long? 40min
What? I talk about why I like rules, how I think that rules should look like, and I attempt to apply theories of art to data visualization, to explain how different goals can make rules contradict each other.
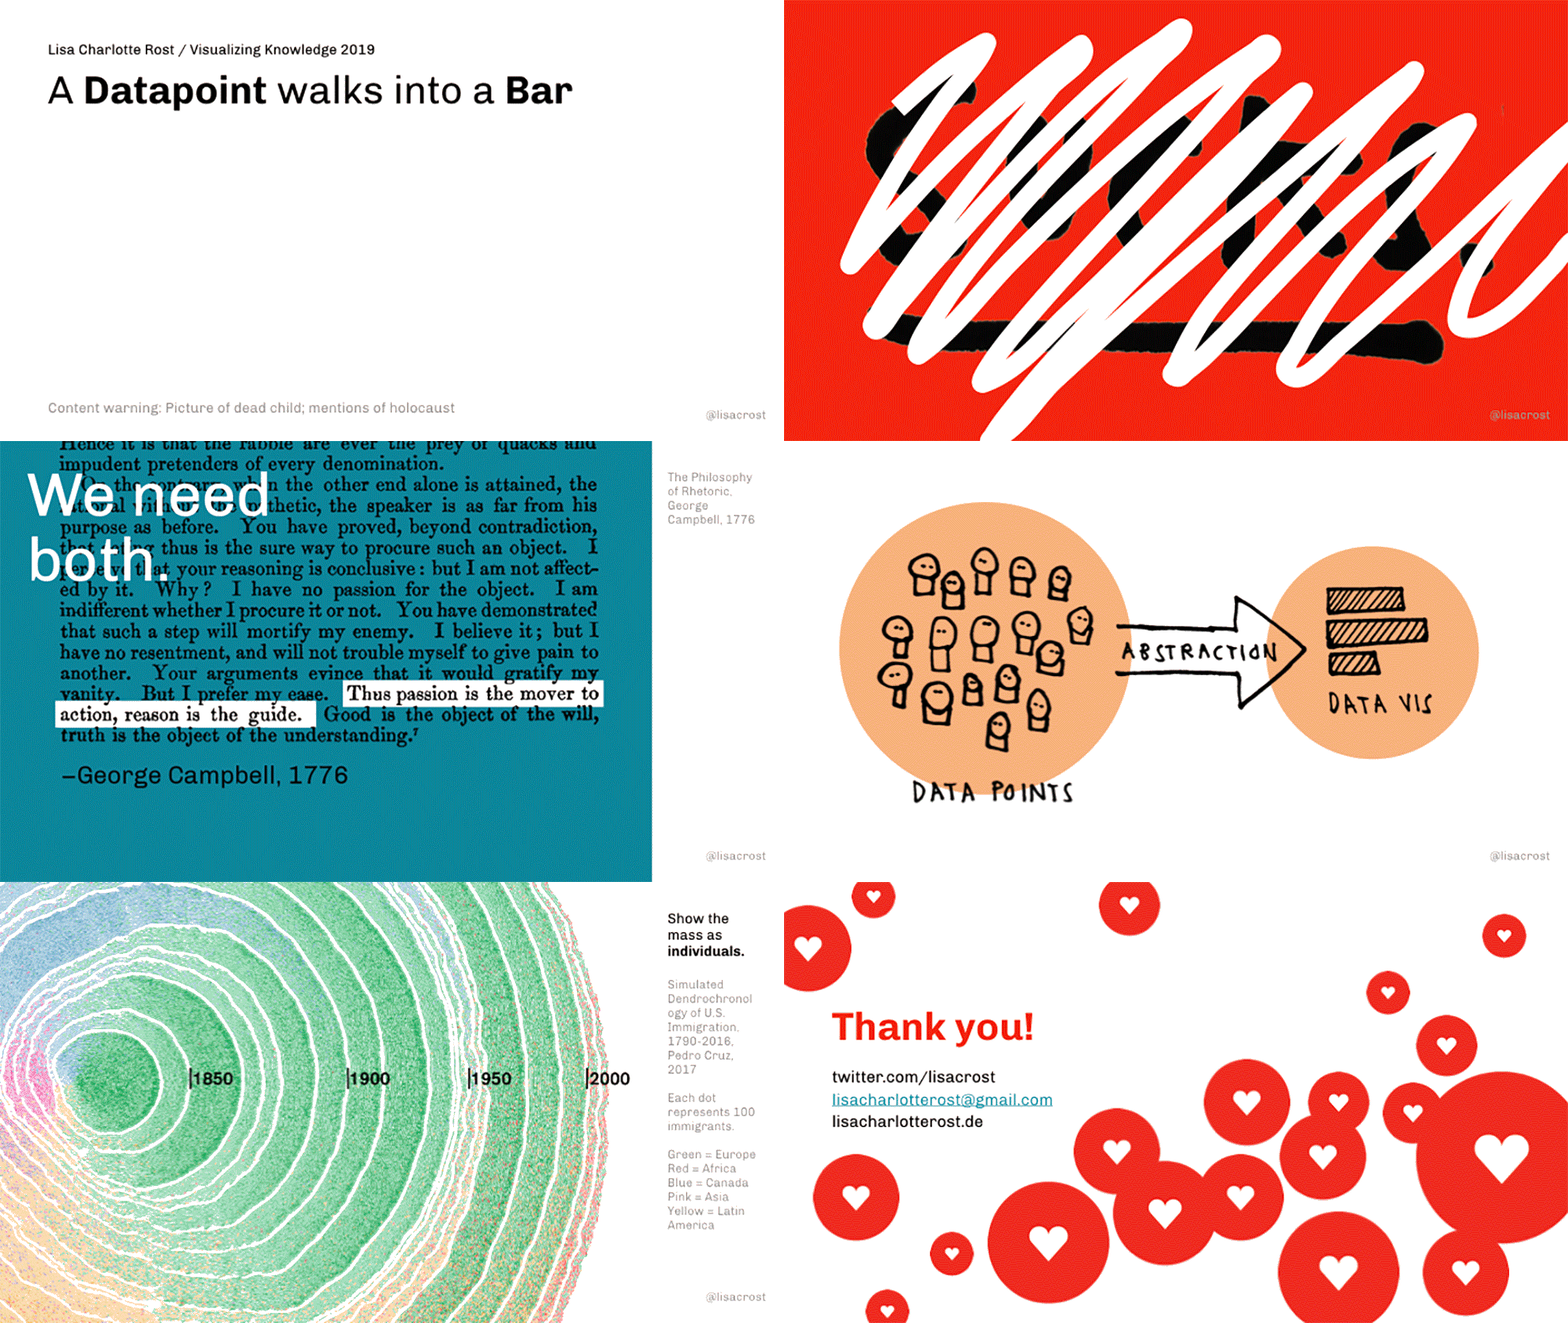
A data point walks into a bar
PDF, Transcript, Recording
Where? “Visualizing Knowledge" at Aalto University in Helsinki, Finland (“Visualizing Knowledge brings together a diverse group of practitioners to discuss data visualization from multiple perspectives.”)
When? May 2019
How long? 30min
What? Updating my talk from 2016/2017 (scroll down to see the original) with the same topic: Explaining why people are bad with high numbers, and that we feel more grief about the death of one person than about the death of thousands. Presenting possible ways how data vis could make us feel things even if it visualises big quantities.
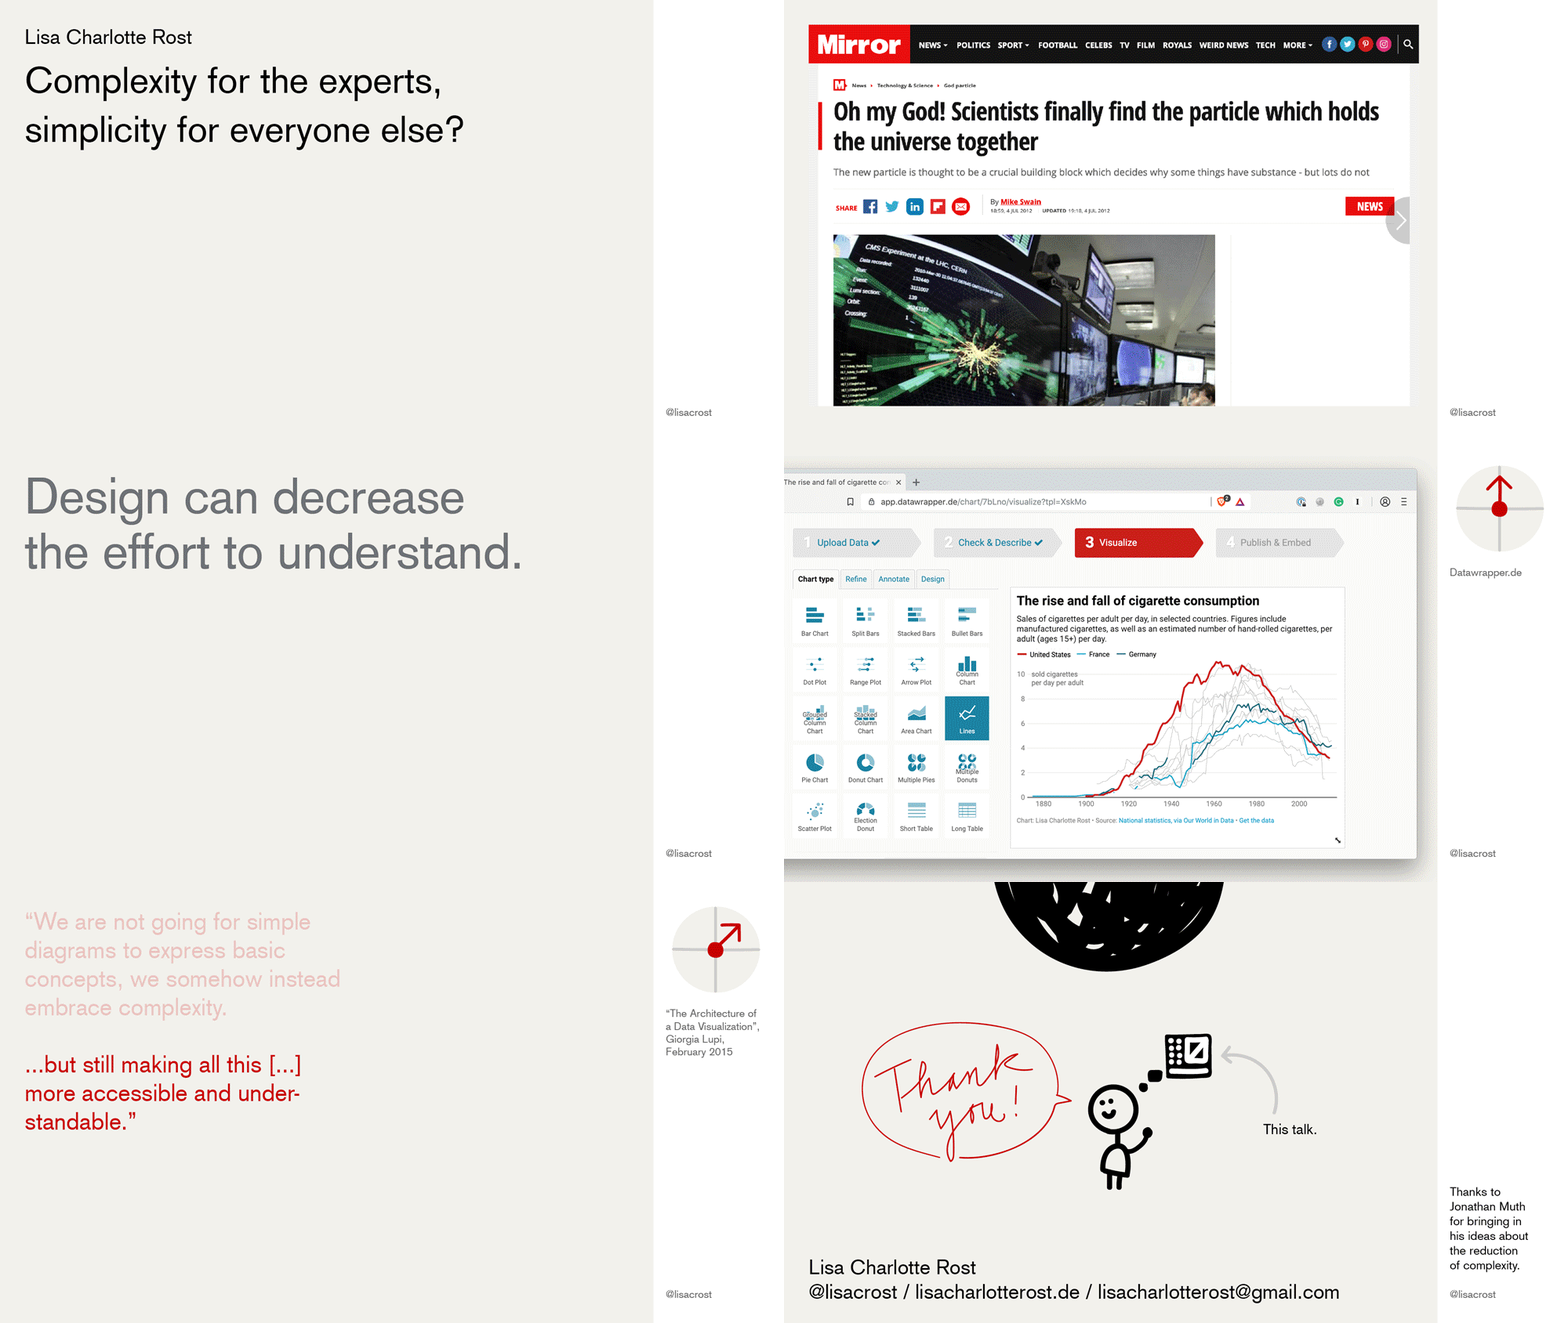
Complexity for the experts, simplicity for everyone else?
PDF, Transcript, Recording
Where? "Designed for science: Complex ideas in clear focus", an event focusing on data visualization and design in science, organized by the design unit of the United Nations office in Geneva, Switzerland
When? February 2019
How long? 15min
What? Thanks to good design, we can communicate our scientific ideas to more people with the same degree of complexity. Or we can show a higher complexity in our ideas, without losing audiences. In this talk, we look at examples of data visualizations that achieve both.
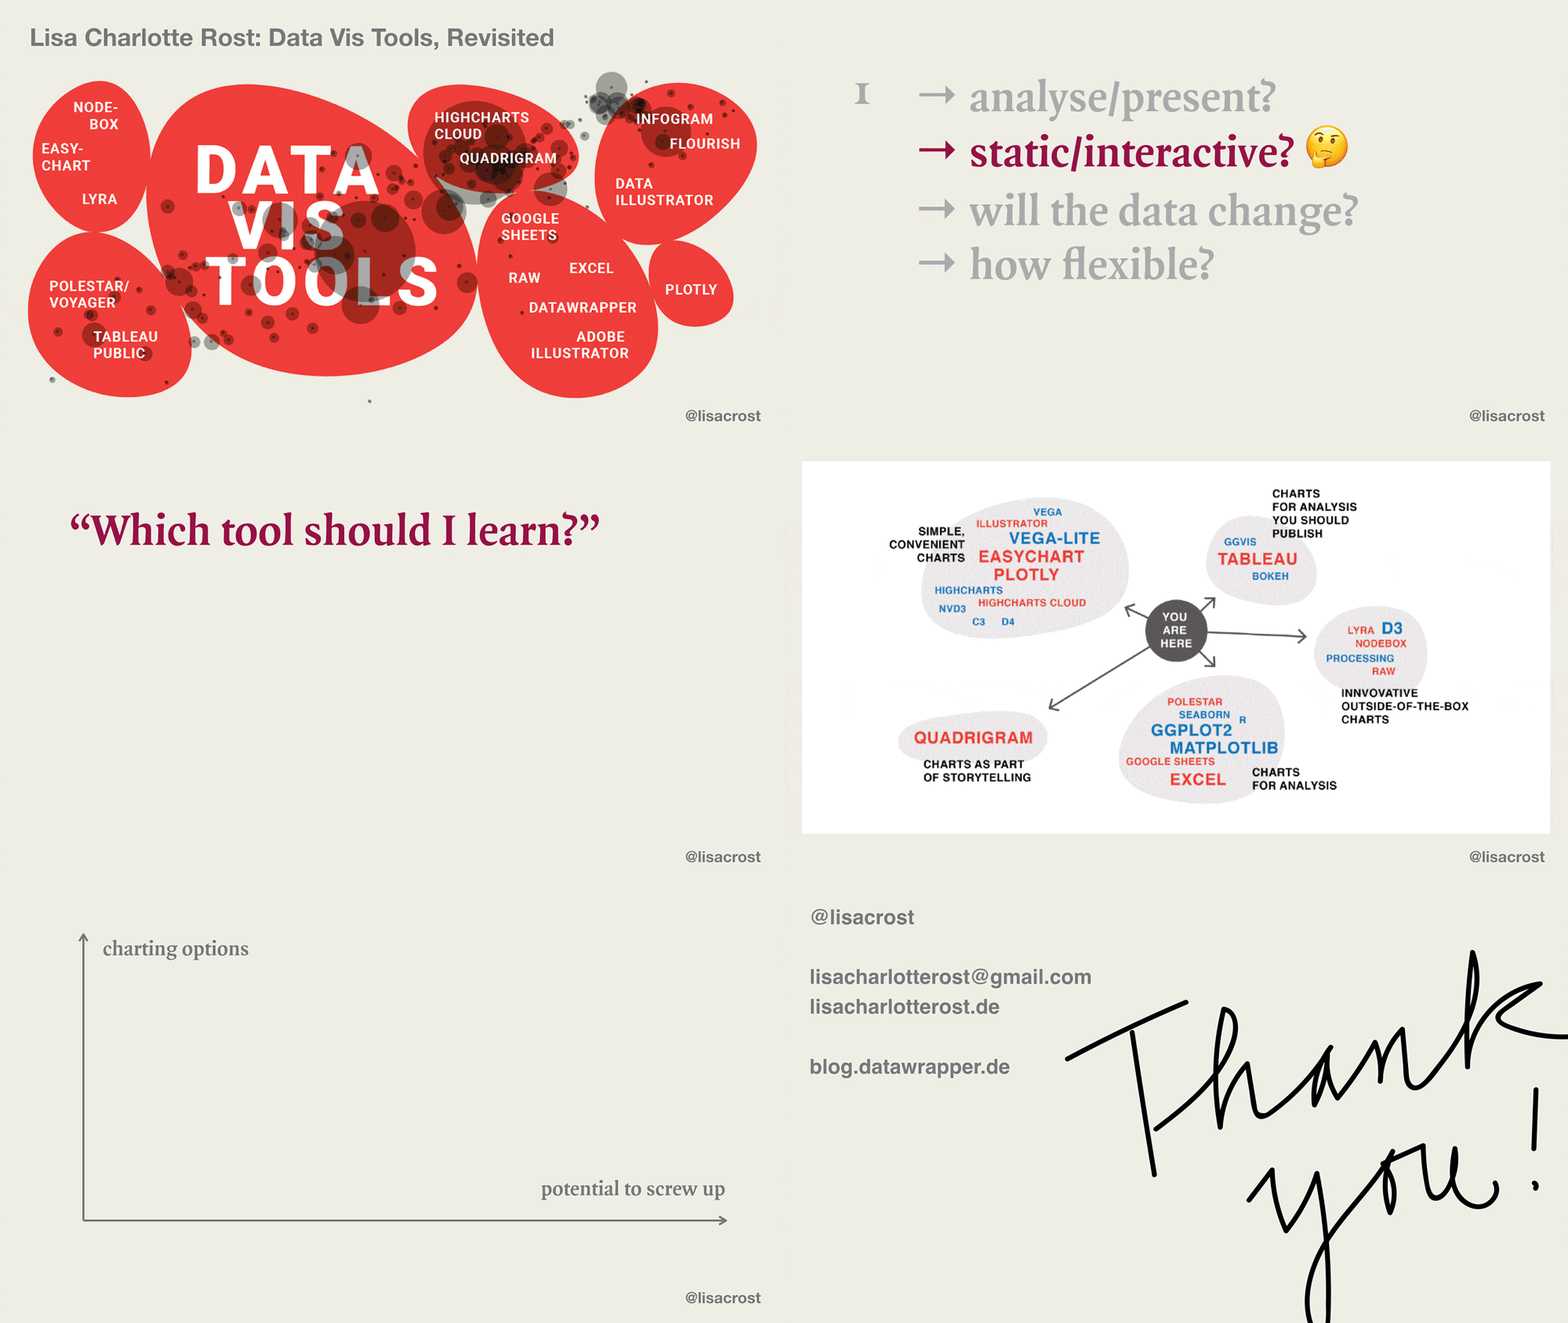
Data Vis Tools, Revisited
PDF, Transcript, Recording
Where? Vis in Practice (“dedicated to everyone interested in the practical aspects of data visualization and visual analytics”) at IEEE VIS ("the worldwide largest and most important conference on Scientific Visualization, Information Visualization and Visual Analytics") in Berlin, Germany
When? October 2018
How long? 30min
What? Looking back at lessons I've learned while recreating the same chart with 24 data vis tools in May 2016 and seeing if they still hold up. Introducing new developments in the tool landscape ("the rise of the data-drawing apps"), building empathy for tool builders and talking about my wishes for the future.
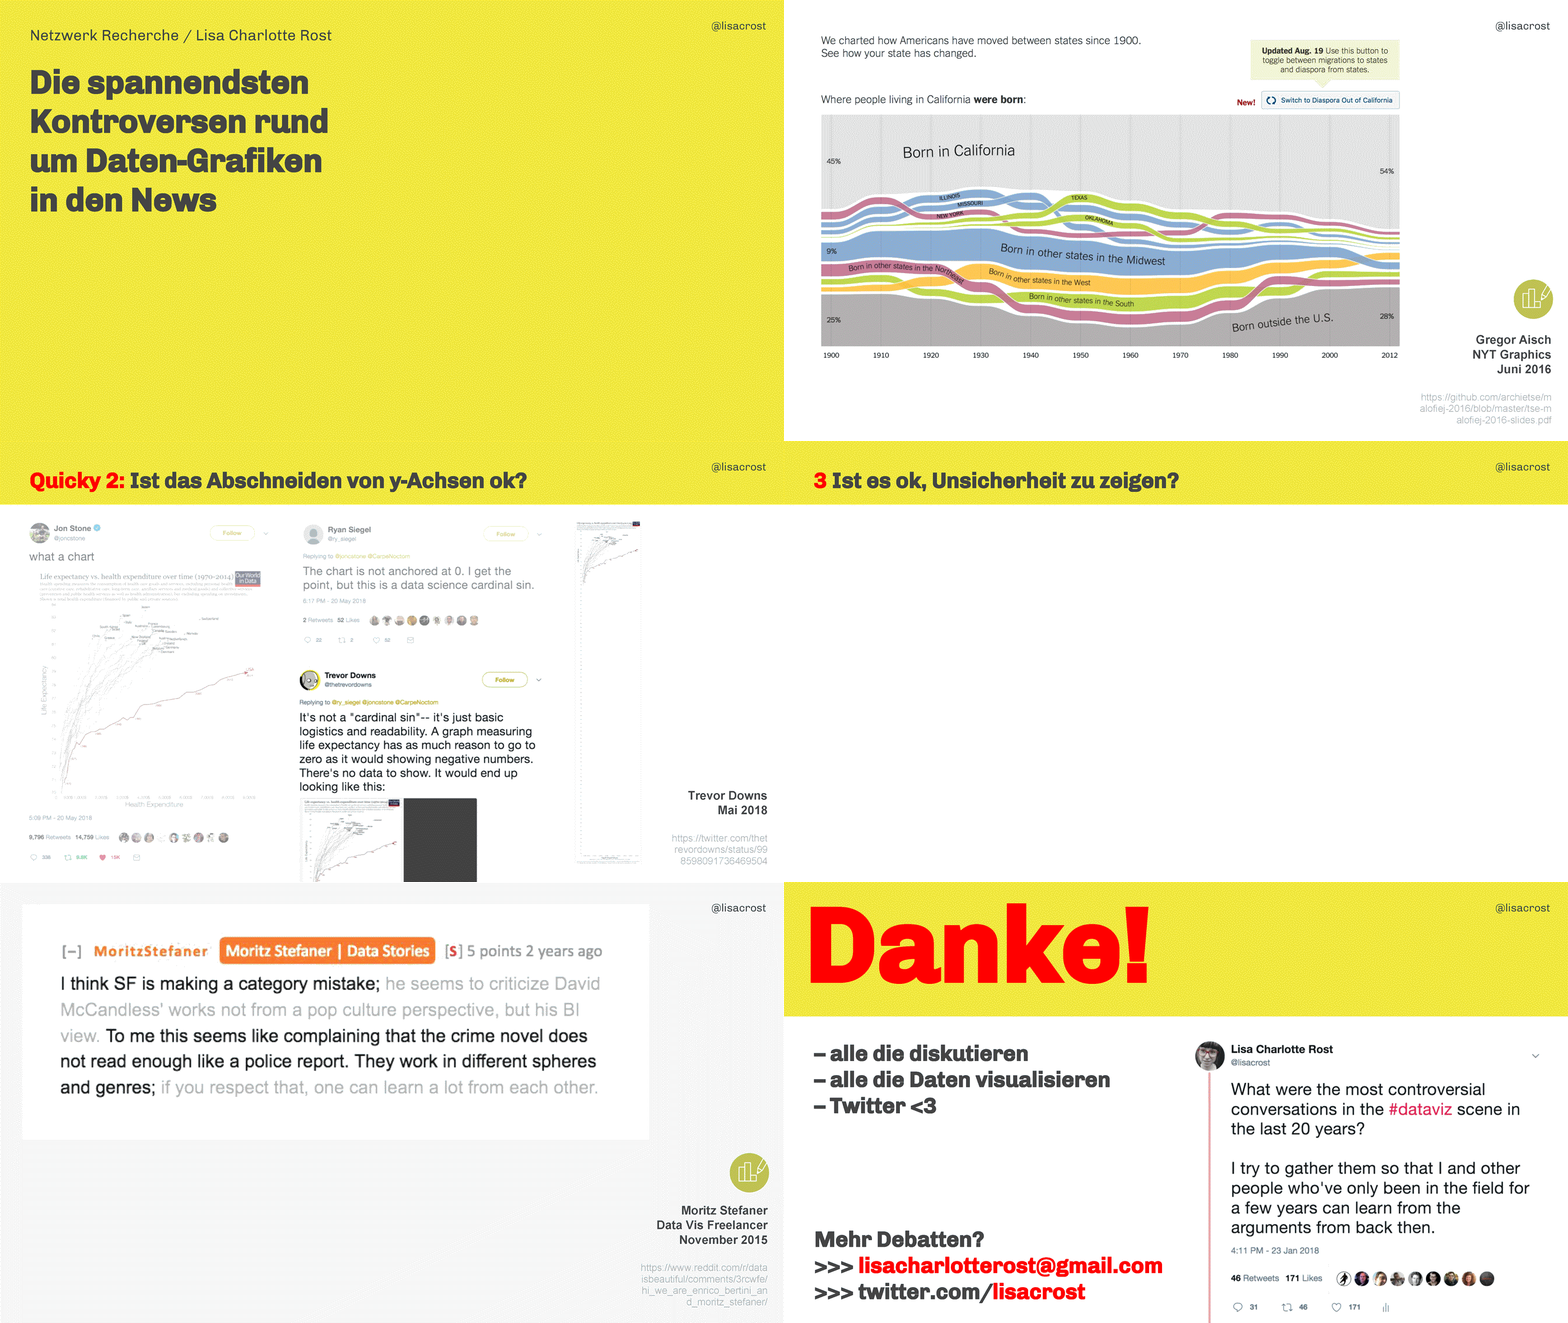
Die spannendsten Kontroversen rund um Daten-Grafiken in den News
PDF in German, Transcript, Recording
Where? Netzwerk Recherche Jahreskonferenz, in my opinion the best and most fun journalism conference in Germany.
When? June 2018
How long? 60min
What? Looking at the most important data vis controversies of the past few years. From "Are pie charts ok?" to "When does interactivity makes sense for visualization?":
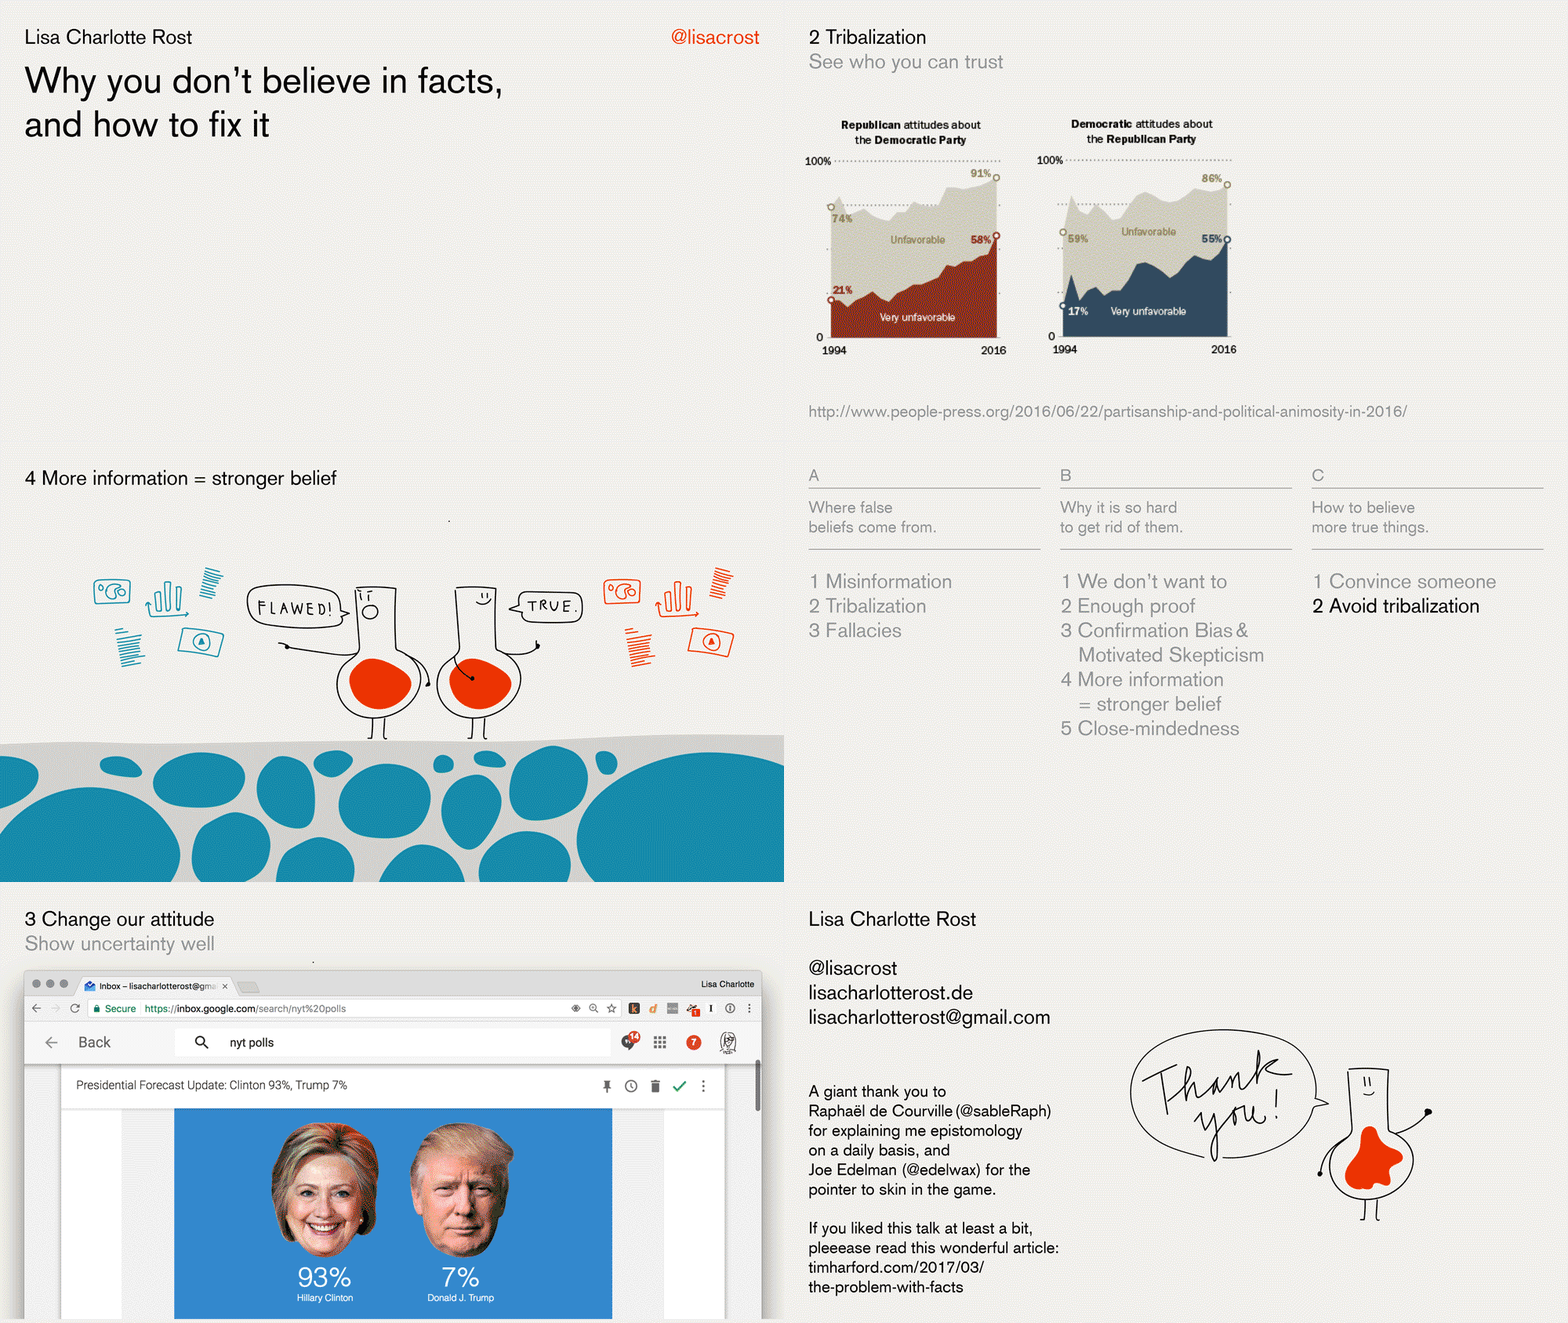
Why you don’t believe in facts, and how to fix it
PDF in English, PDF in German, Transcript, Recording
Where? Re:publica (“The Most Exciting Festival for the Digital Society”) in Berlin, Germany
When? May 2017
How long? 20min
What? Understanding why we believe so many stupid things, why we can’t get rid of beliefs easily and how to believe more true things.
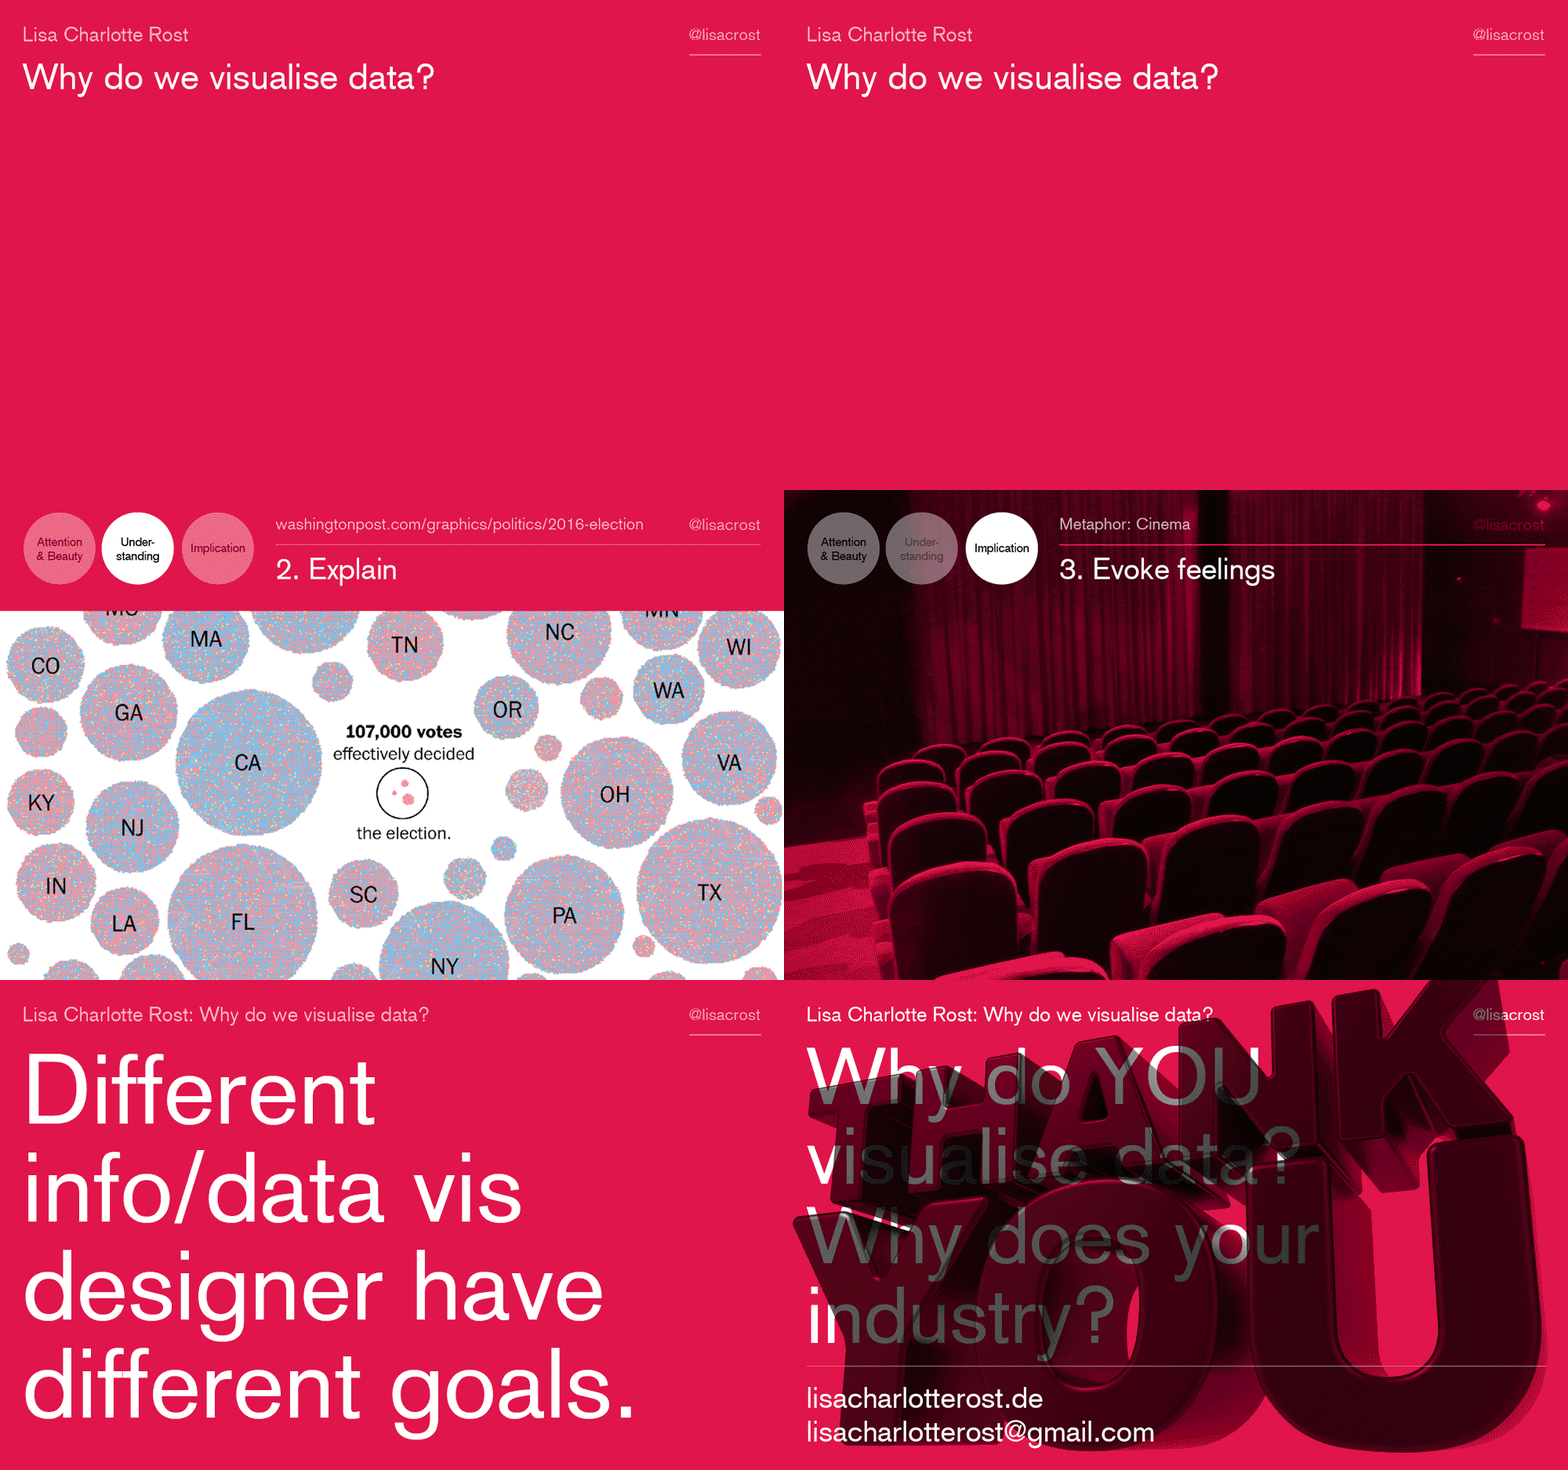
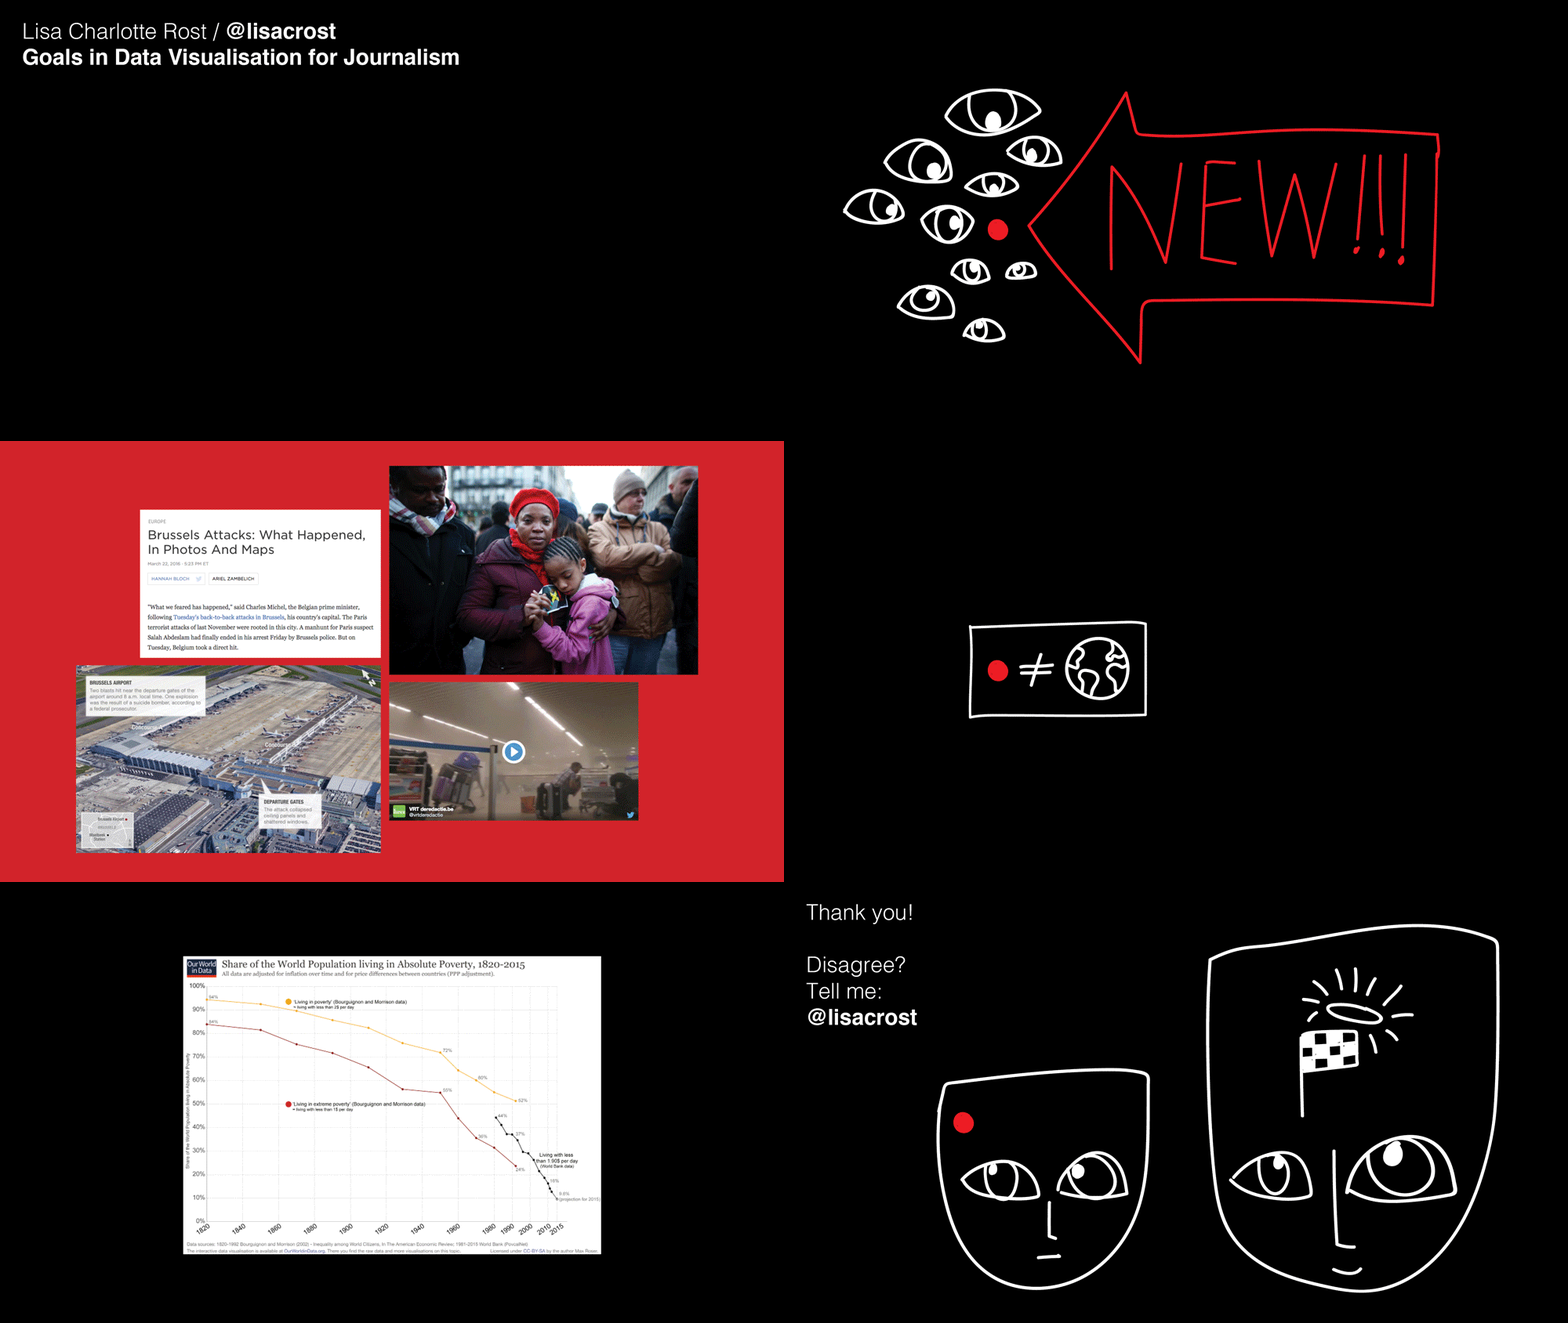
Why do you visualise data?
PDF, Transcript, Recording will follow
Where? INCH (an information design conference) in Munich, Germany
When? March 2017
How long? 20min
What? Thinking about possible goals of data vis and how to categorise them, and which industry has which goals when it comes to data vis.
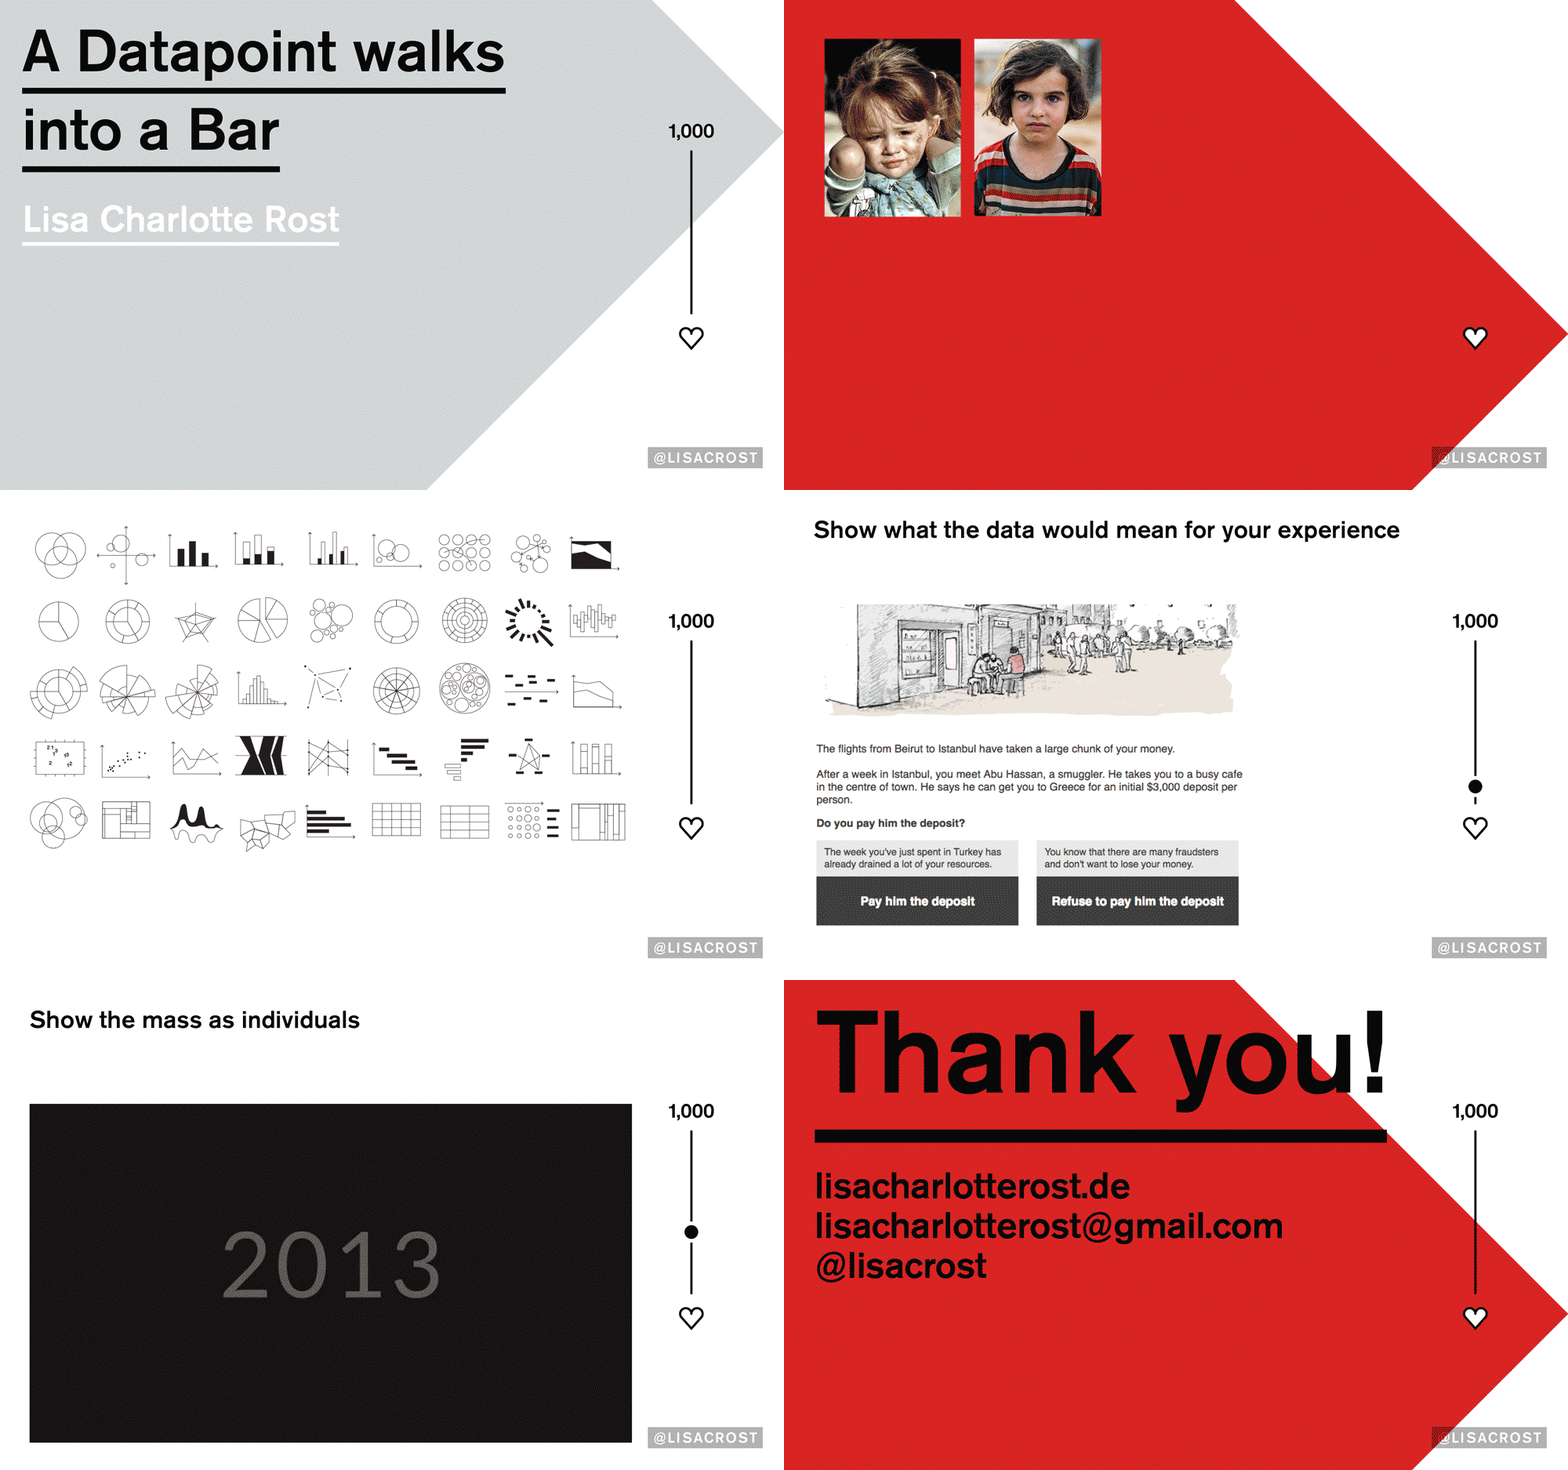
A data point walks into a bar
PDF, Transcript, Recording Dec 2016, Recording May 2017
Where? Chaos Communication Congress in Hamburg (Germany) & OpenVis Conf
When? December 2016 & May 2017
How long? 20min
What? Explaining why people are bad with high numbers, and that we feel more grief about the death of one person than about the death of thousands. Presenting possible ways how data vis could make us feel things even if it visualises big quantities.
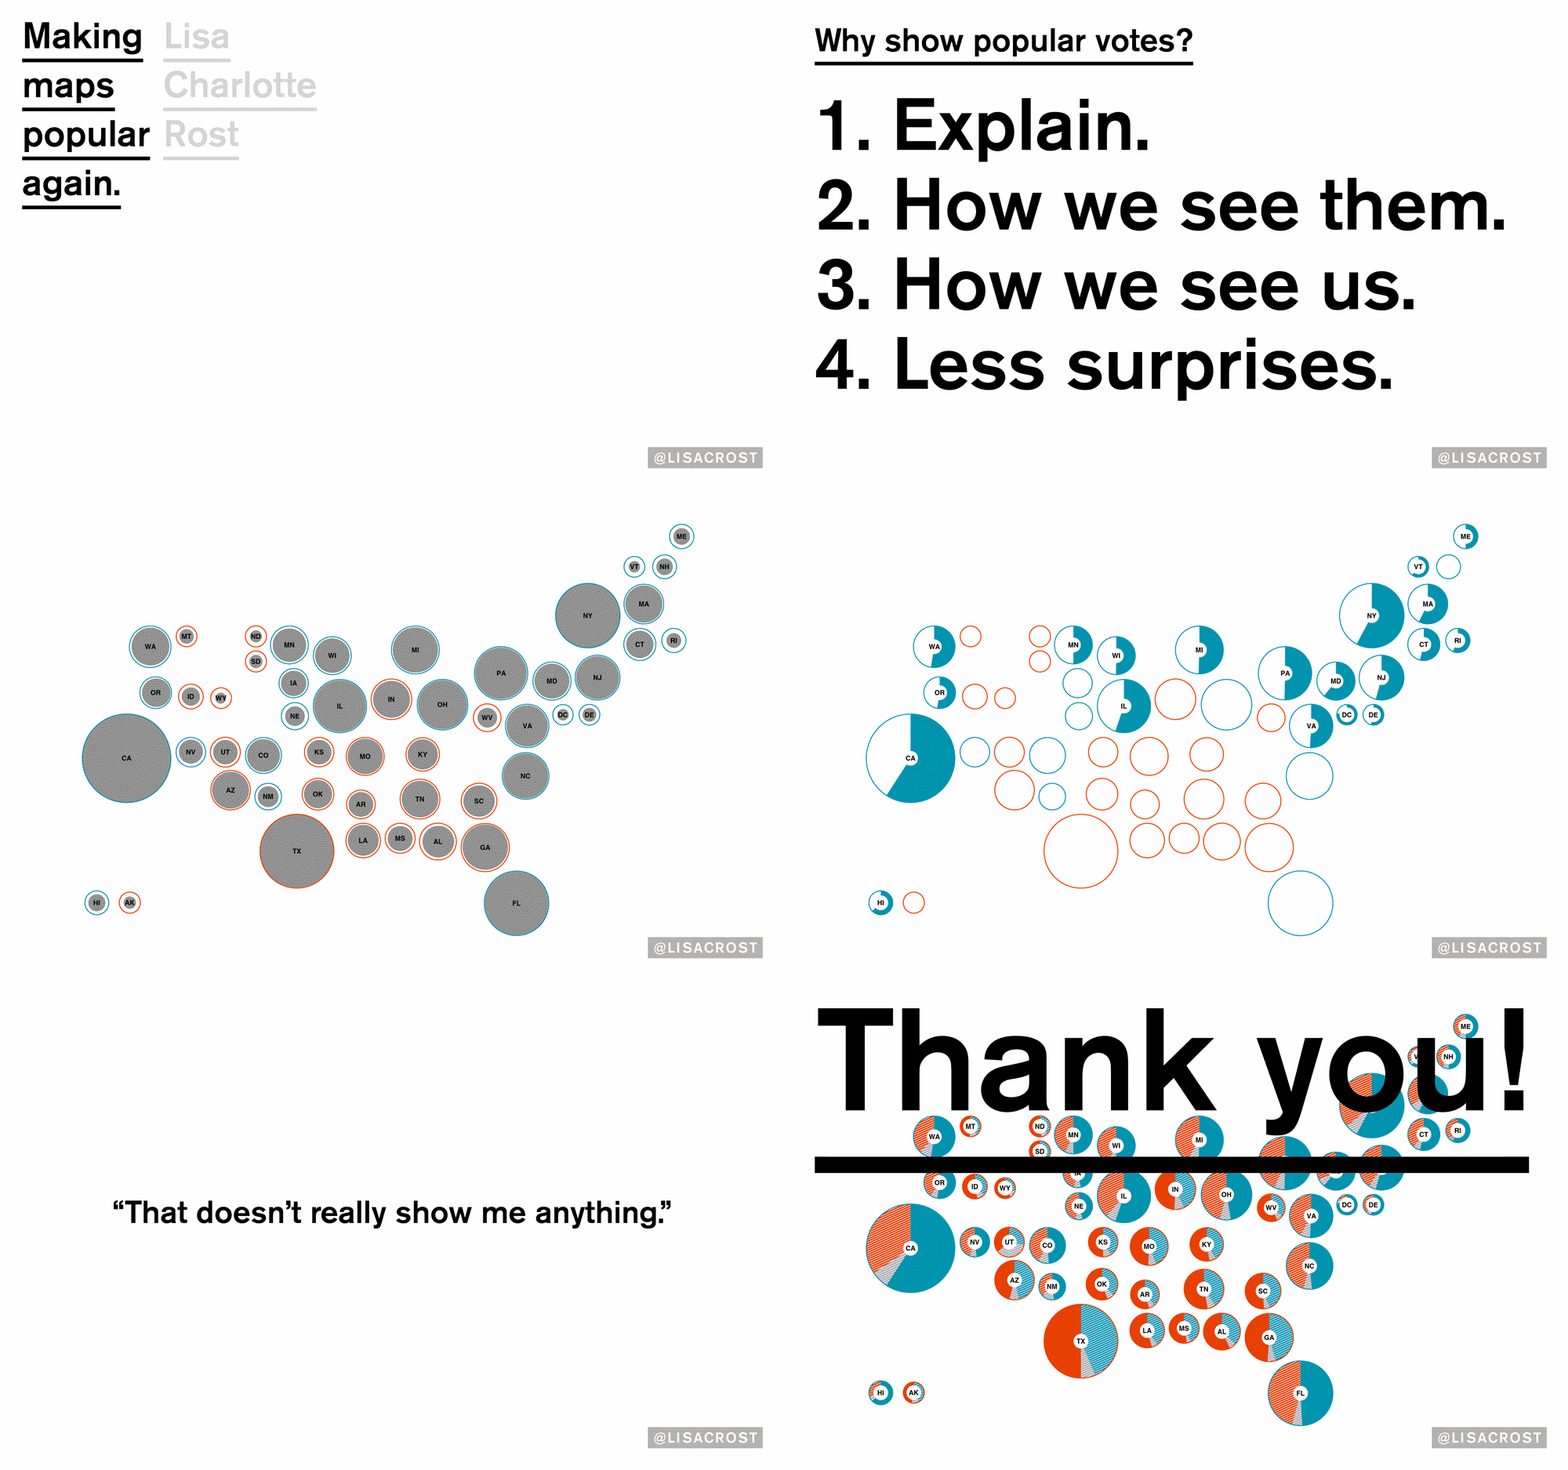
Making maps popular again
PDF, Transcript, Recording
Where? GeoNYC meetup in New York City
When? November 2016
How long? 20min
What? Thinking about how electoral college maps only show the “winner” votes per state, and how that can be solved with a map of the popular vote.
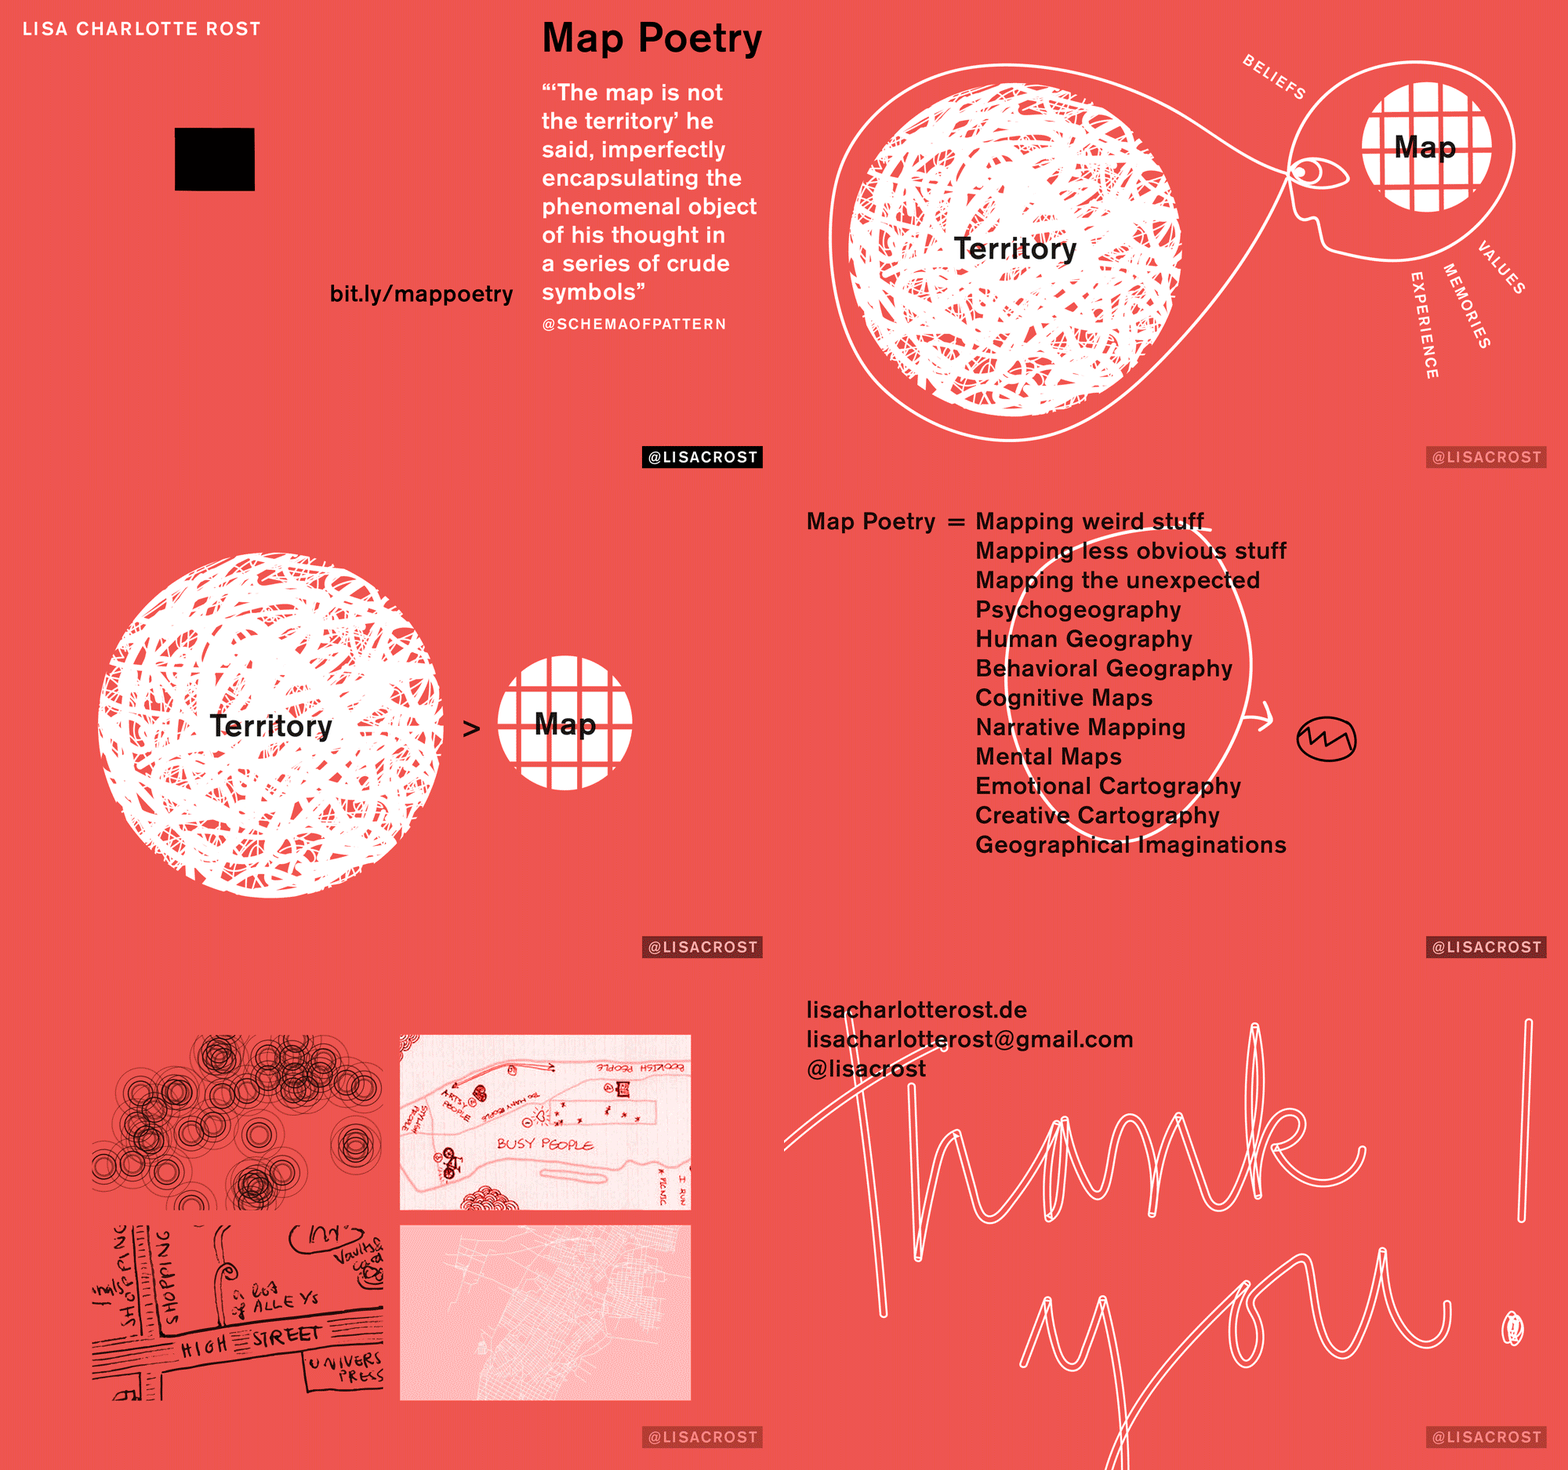
Map Poetry
PDF, Transcript, Recording
Where? NACIS (a mapping conference) in Colorado Springs
When? October 2016
How long? 20min
What? Thinking about maps that represent maps, not territories. Thinking about what map poetry can offer us and arguing that we should do that more.
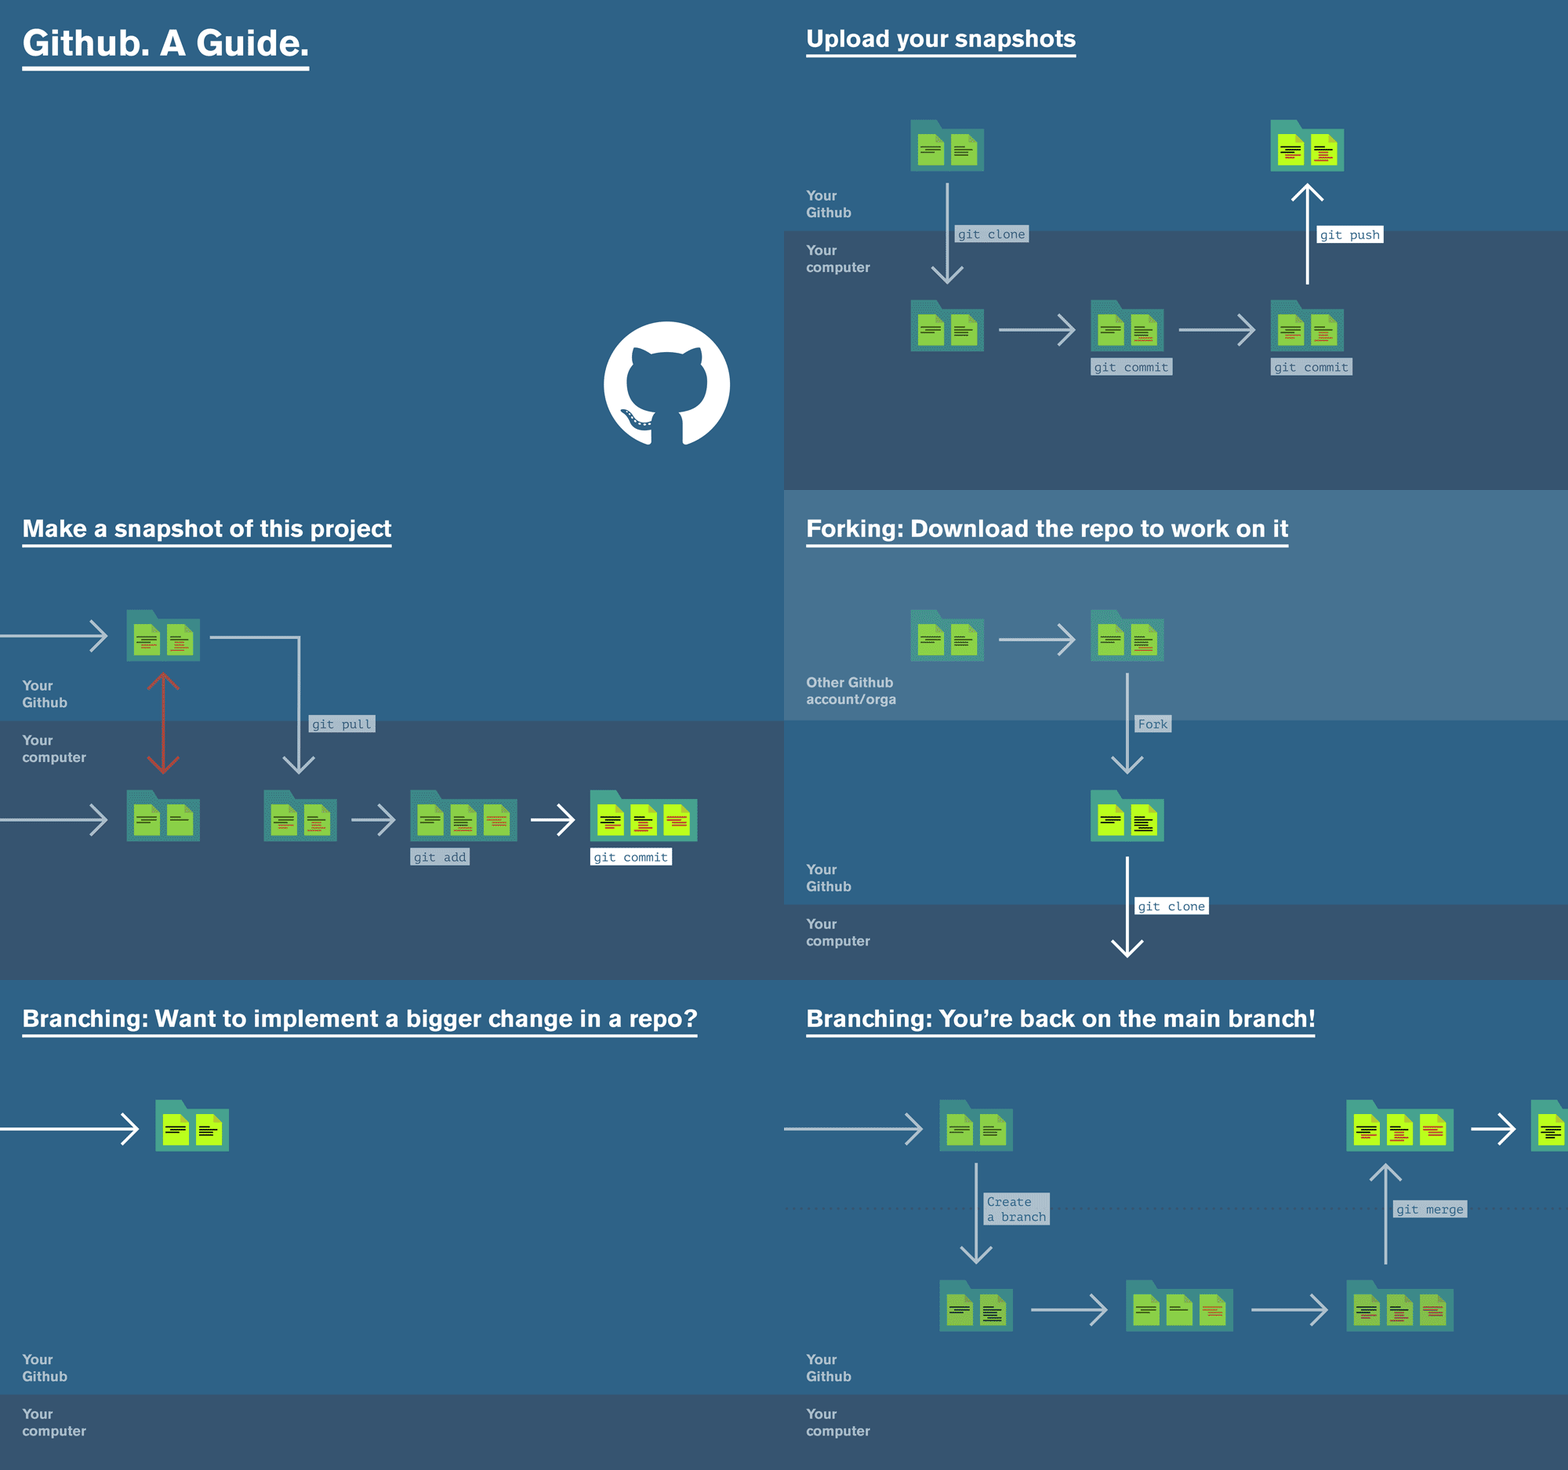
Github Tutorial
PDF, Transcript, Recording
Where? Hacks/Hacker Media Party in Buenos Aires
When? September 2016
How long? 60min tutorial with Christine Zhang
What? Small Github Tutorial that explains basic principles like forking and branching in a visual way.
More Context, Less News
PDF, Transcript, Recording
Where? Information+ in Vancouver
When? June 2016
How long? 5min
What? Lightning Talk that questions the role of news graphics.
Thinking Tools
PDF, Transcript, Recording
Where? At NPR, for the NPR Visuals Team
When? May 2016
How long? 20-30min
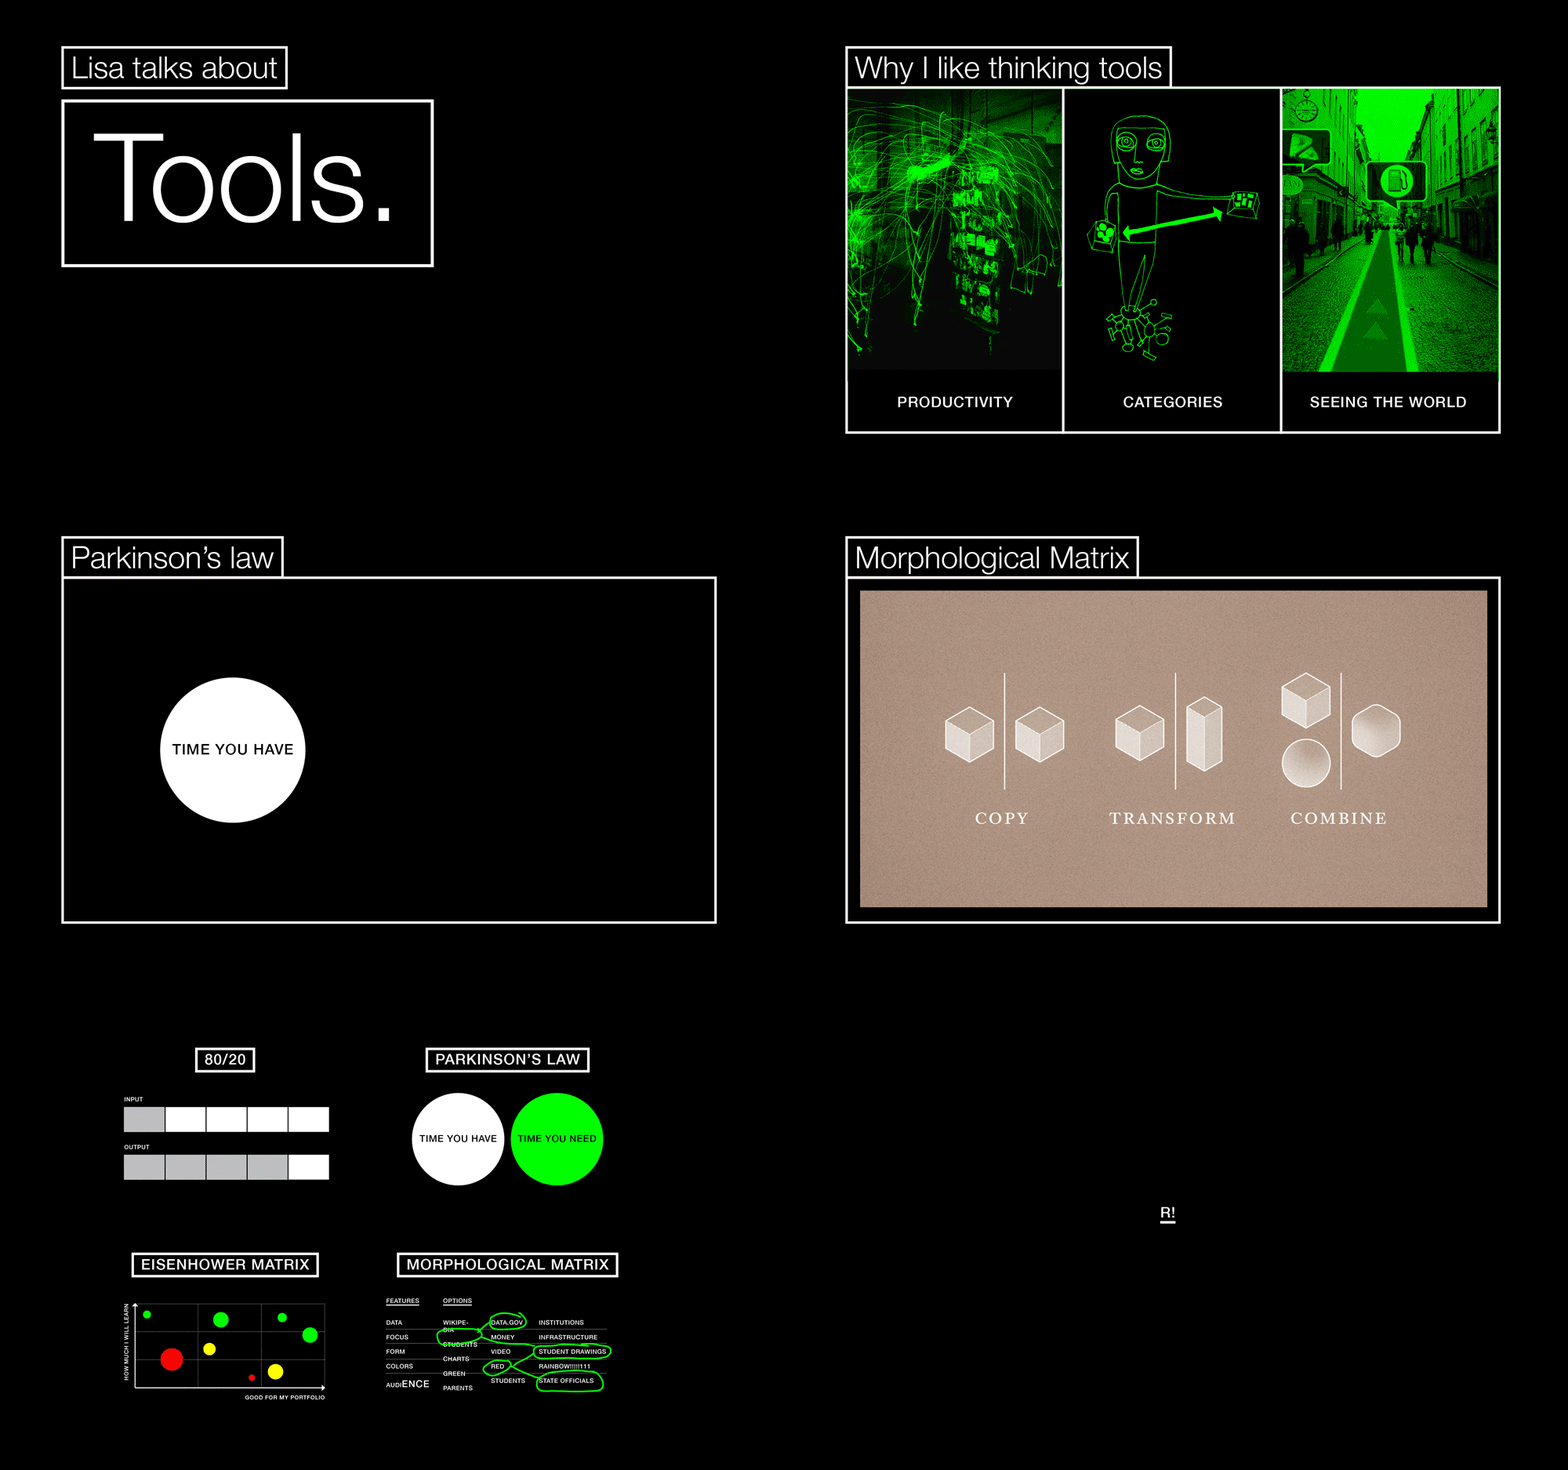
What? Explaining my “thinking tools”. Covers Parkinson’s Law, 80/20, Eisenhower Matrix, Morphological Matrix.
Why What How
PDF, Transcript, Recording
Where? Mozfest in London, just for the other OpenNews fellows. I actually never gave this talk; I just prepared it.
When? November 2015
How long? 5min
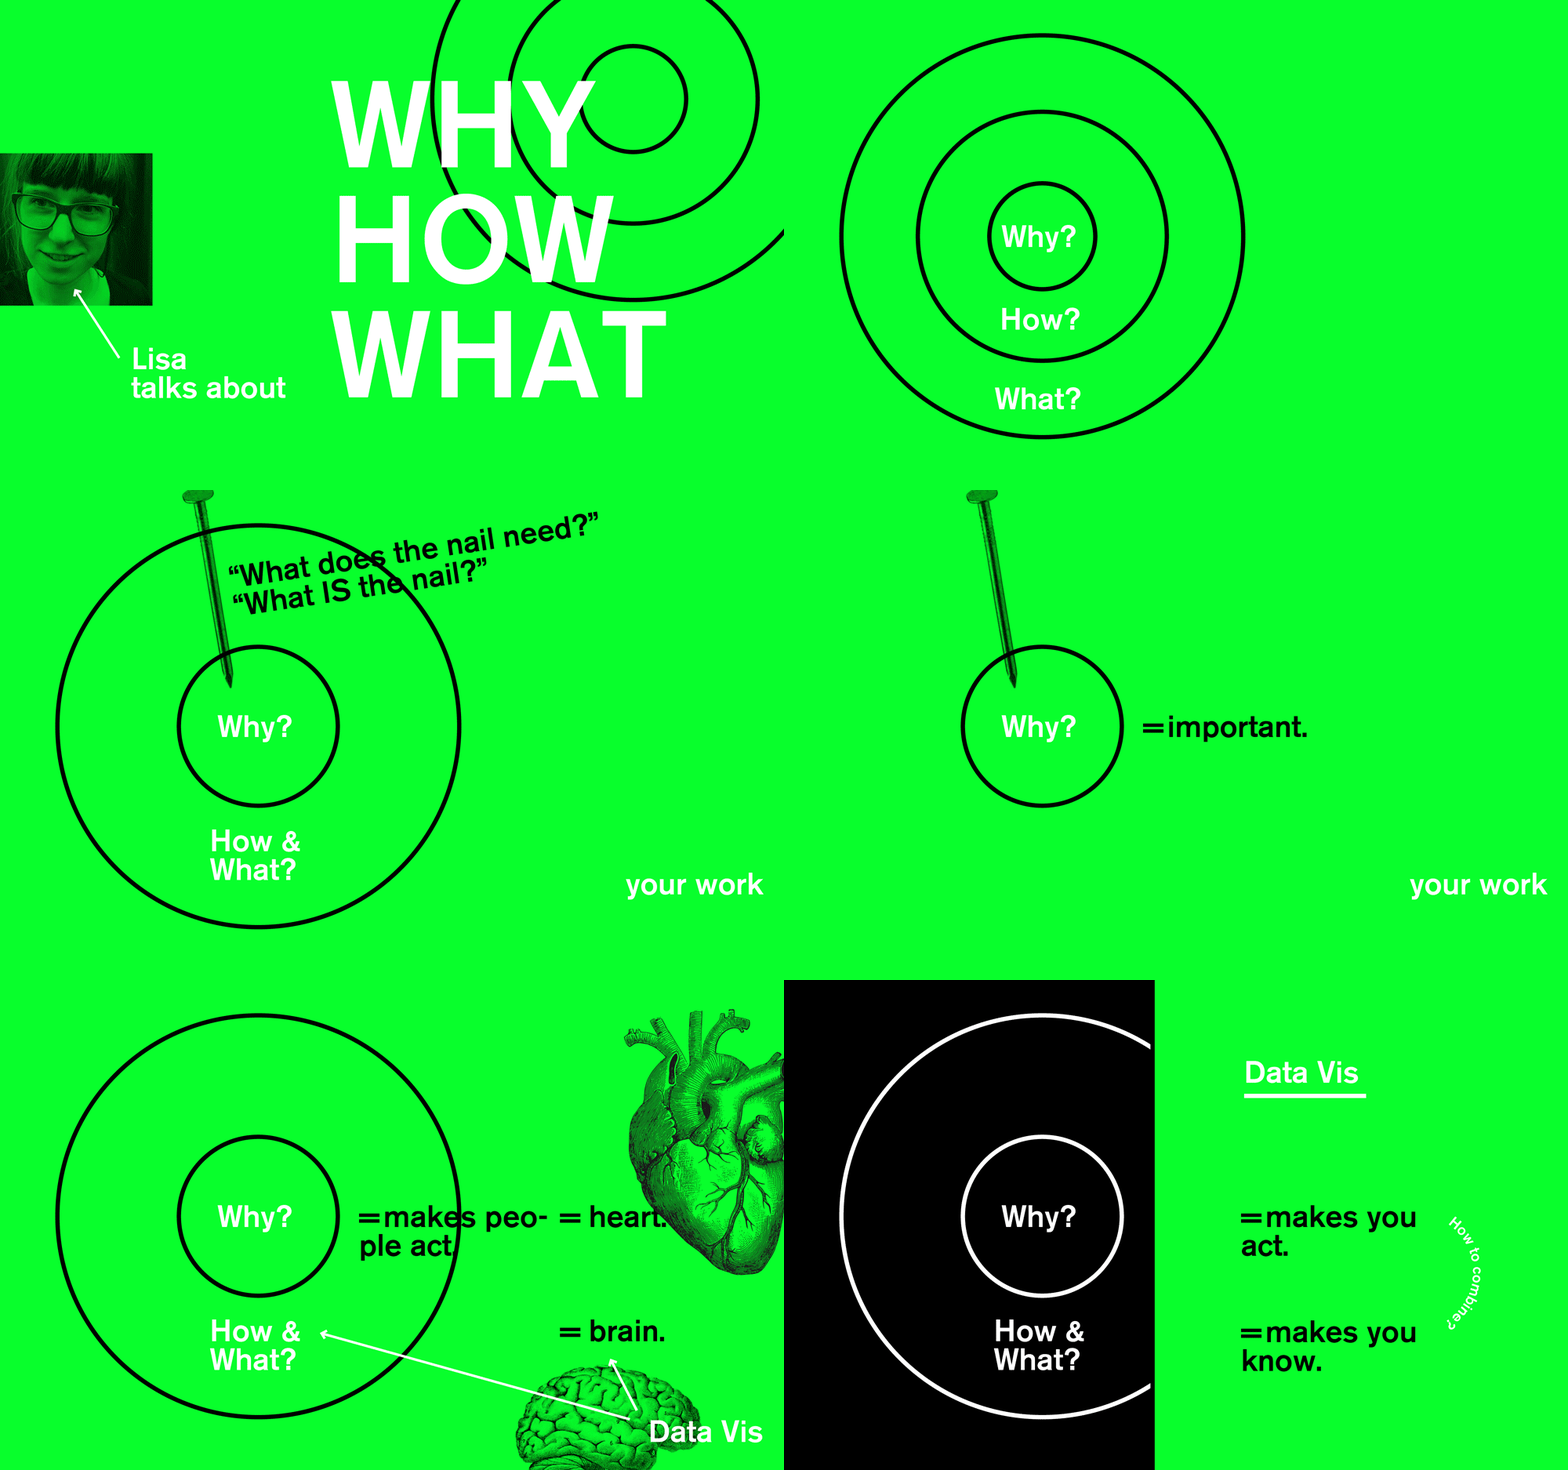
What? Explaining the “Golden Circle” by Simon Sinek and how it relates to data vis.
What Lisa likes
PDF, Transcript, Recording
Where? Talk for my co-workers at Onlab, a design studio in Berlin I worked for in 2014.
When? September 2014
How long? 20min
What? Explaining what I like. Categories the things I like into “sorting knowledge”, “sorting ideas”, “sorting personalities”, “rethinking things”, “doing more in less time”. Please note that the talk is several years old; my opinion has definitely changed.
Presentation of my master’s thesis about editorial design
PDF, Transcript, Recording
Where? In the office of my professor, Berlin
When? August 2014
How long? 60min
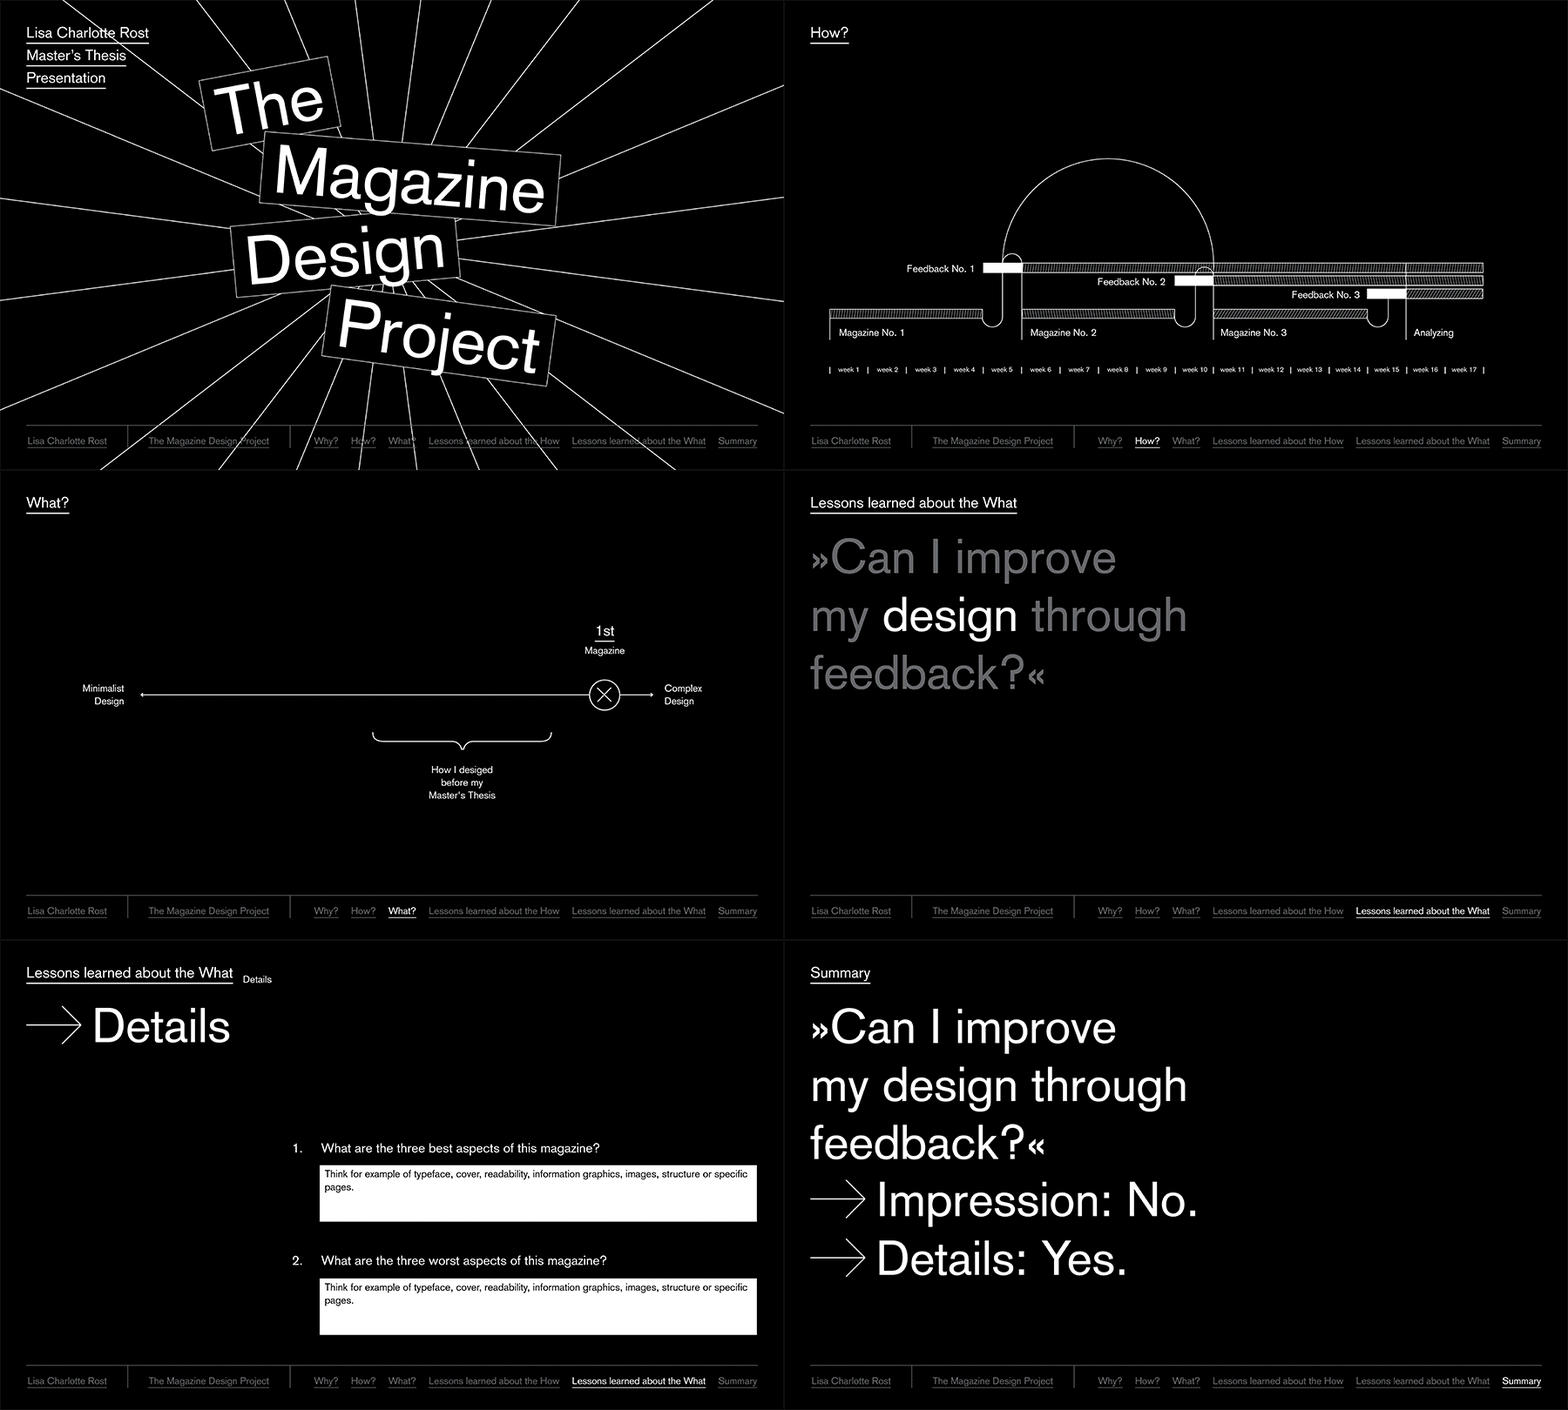
What? Answering the question “Can I improve my design through feedback?”. I designed three different-looking magazines with the same content and got the feedback from lots of people.
