Introduction
This project, based on Java 8 and Spring boot, is to learn and demonstrate the difference between sequential and parallel service call, and how the system performance is influenced by them.
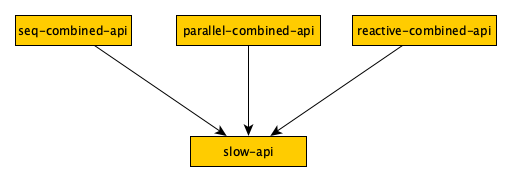
The structure of the apis
- A slow API, which sleeps for 2 seconds, is located in
/legacy/slow/{id}.{id}can be any Integer number to represent different APIs. - Other three APIs
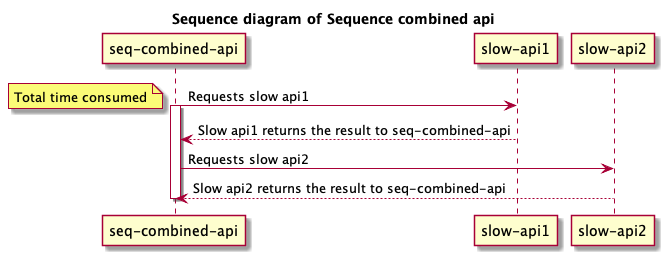
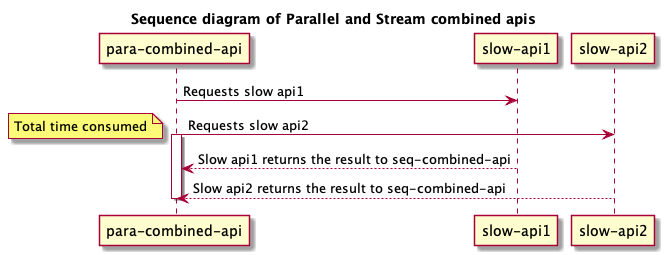
/seq/combined,/parallel/combined,/webflux/combinedare represented for a combined API, which combines the backend APIs in a different way.- For simplify the example, they all call the slow API twice with different paramerters 1 and 2;
/seq/combinedcalls the slow APIs by sequence way;/parallel/combinedcalls the slow APIs by parallel way(Asychronous by using okhttp);/webflux/combinedcalls the slow APIs by reactive way(Stream by using spring-webflux);
Obviously, the total time cost is the longest time of one of the backend APIs in parallel and reactive architecture, rather than the sum time for every APIs in sequential system.
ELE-MacBook-Pro:parallel ele$ time curl -Is localhost:8080/seq/combined > /dev/null

real	0m4.033s
user	0m0.006s
sys	0m0.006s
ELE-MacBook-Pro:parallel ele$ time curl -Is localhost:8080/parallel/combined > /dev/null

real	0m2.060s
user	0m0.006s
sys	0m0.006s
ELE-MacBook-Pro:parallel ele$ time curl -Is localhost:8080/webflux/combined > /dev/null

real	0m2.051s
user	0m0.006s
sys	0m0.006s
The performance
I did a benchmark on my laptop, and the data was collected below.
- The computer, CPU:
2.7 GHz Intel Core i7, Memory:16 GB 1600 MHz DDR3 - Jvm parameters,
-Xms1G -Xmx2G - Use Apache Benchmark to request the apis with two specs.
-c 10 -n 200is currency 10 and total number 200 requests, and-c 100 -n 2000is currency 100 and total number 2000 requests
Here are some overview indicators, and details are listed below the table.
| Sequcence | Parallel | Reactive | ||
|---|---|---|---|---|
| -c 10 -n 200 | Time taken | 84.617 | 43.387 | 43.726 |
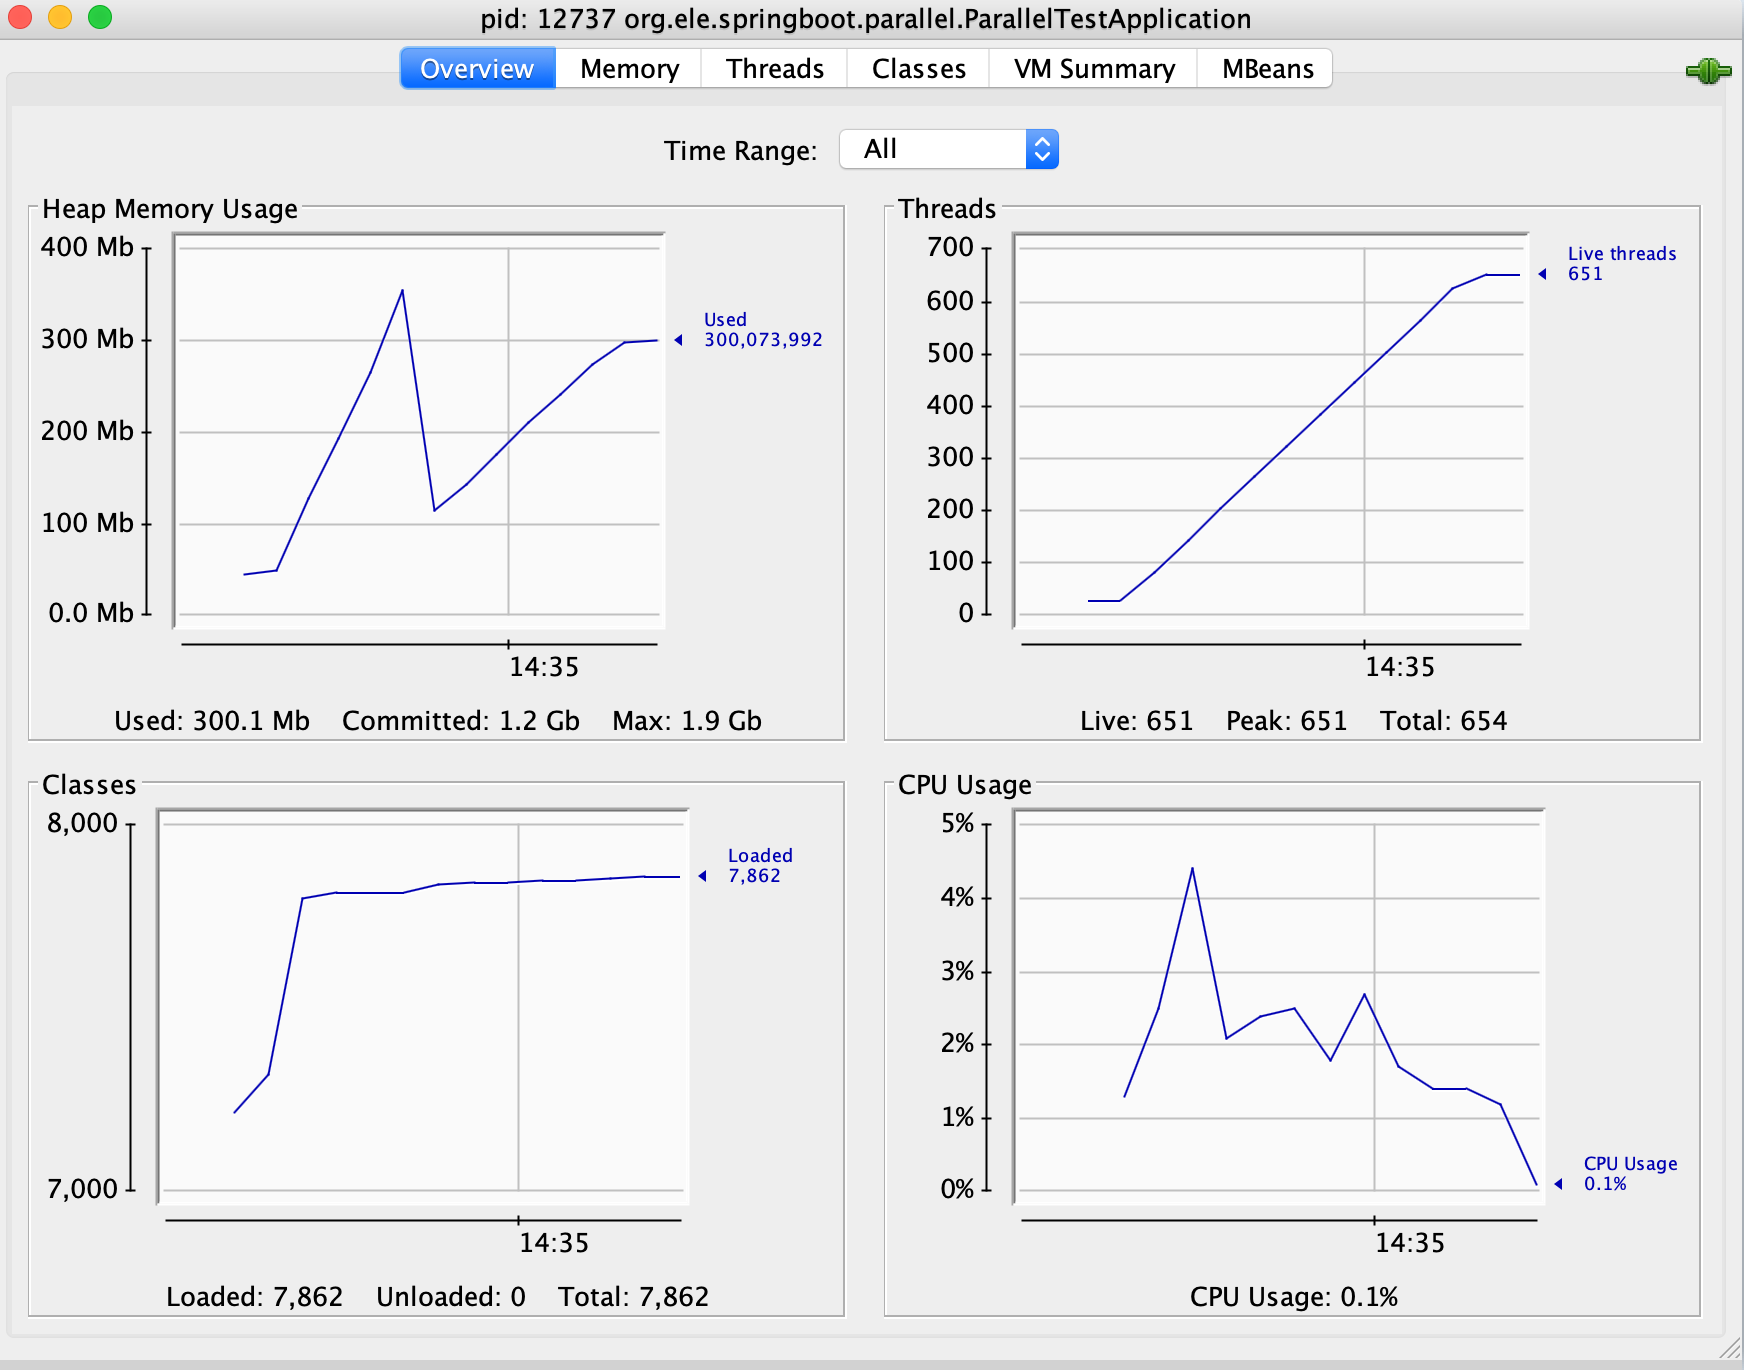
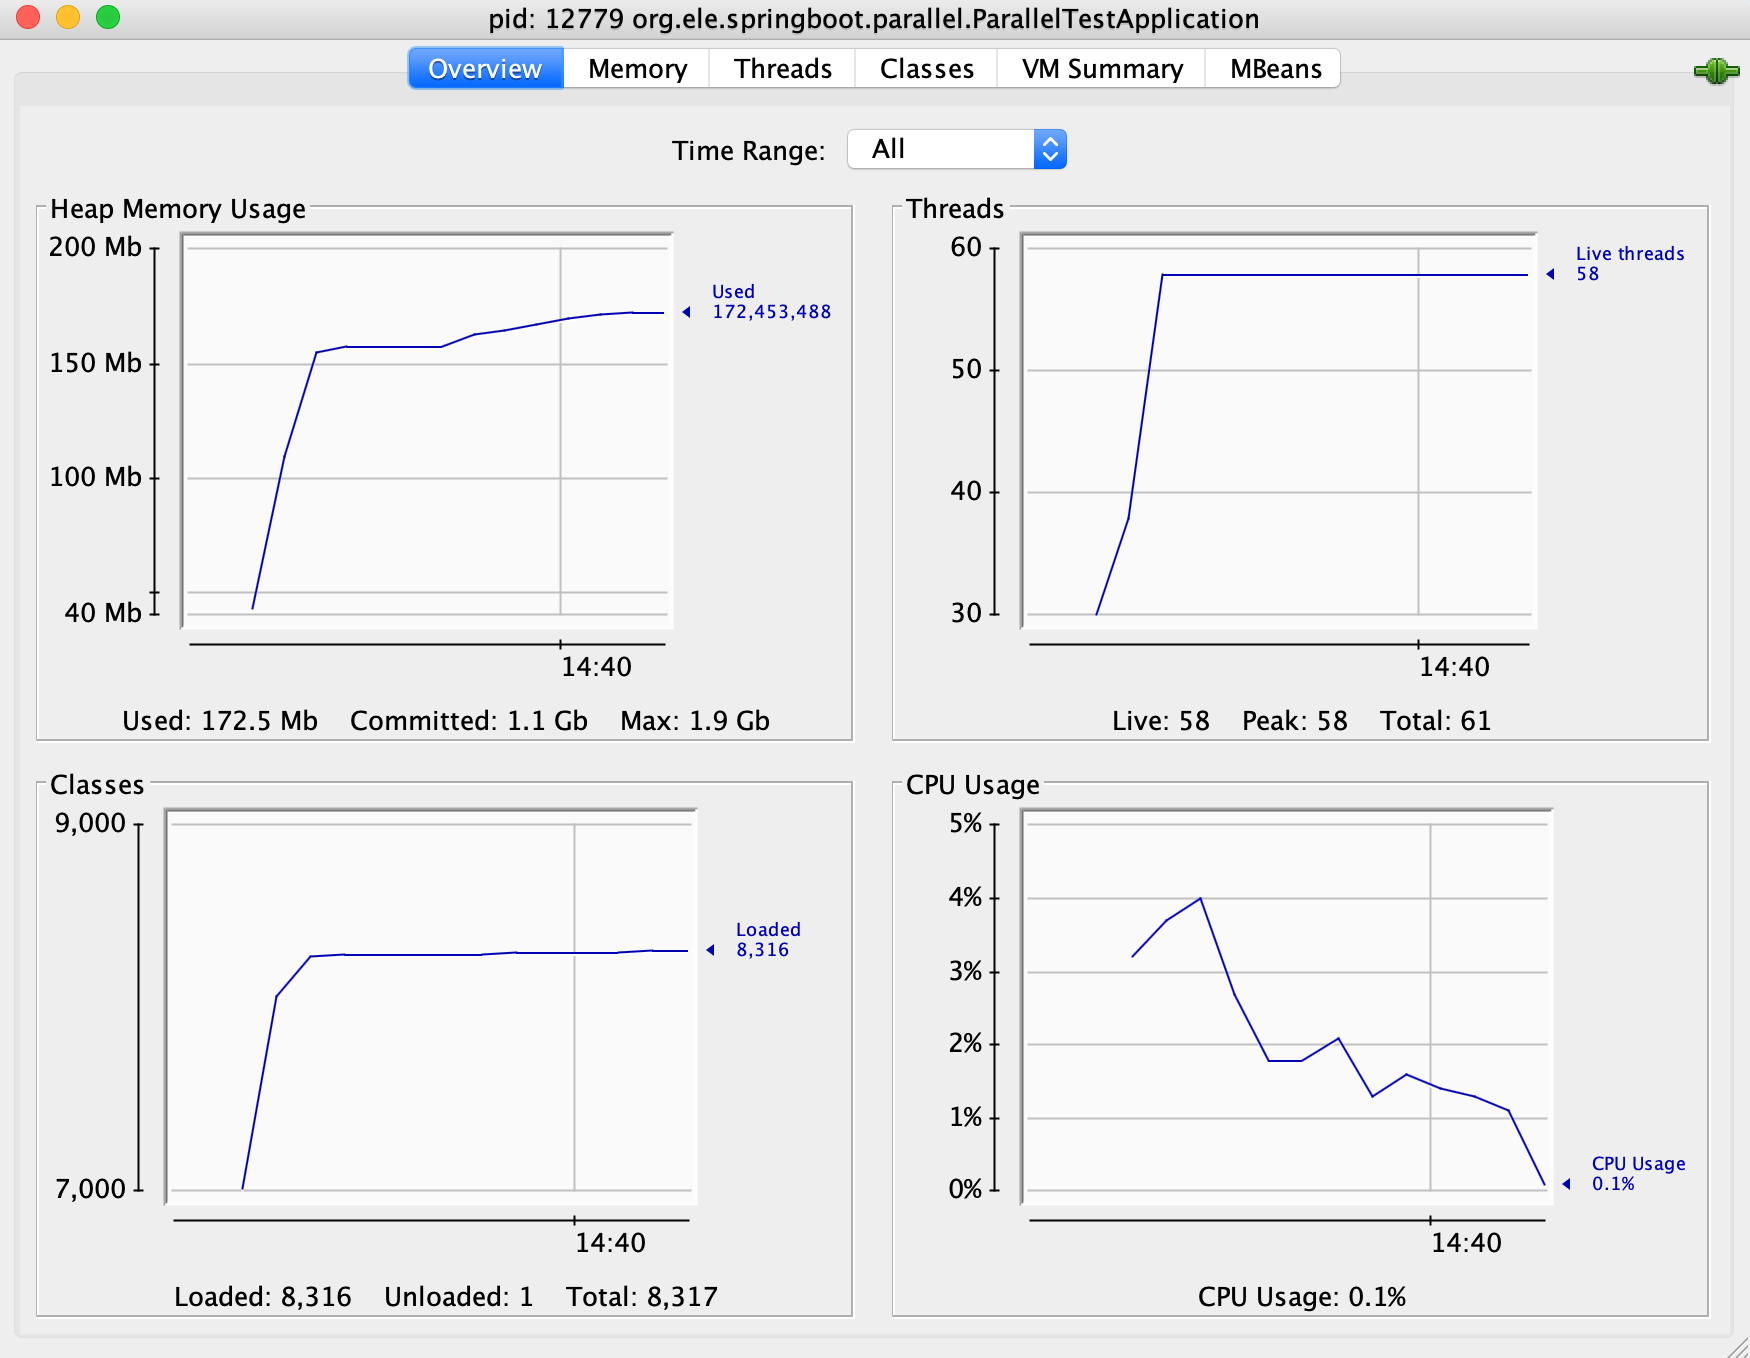
| Maximum Thread number | 41 | 651 | 58 | |
| Peak Heap Memeory | 200Mb | 349mb | 160Mb | |
| -c 100 -n 2000 | Time taken | 84.718 | - | 71.388 |
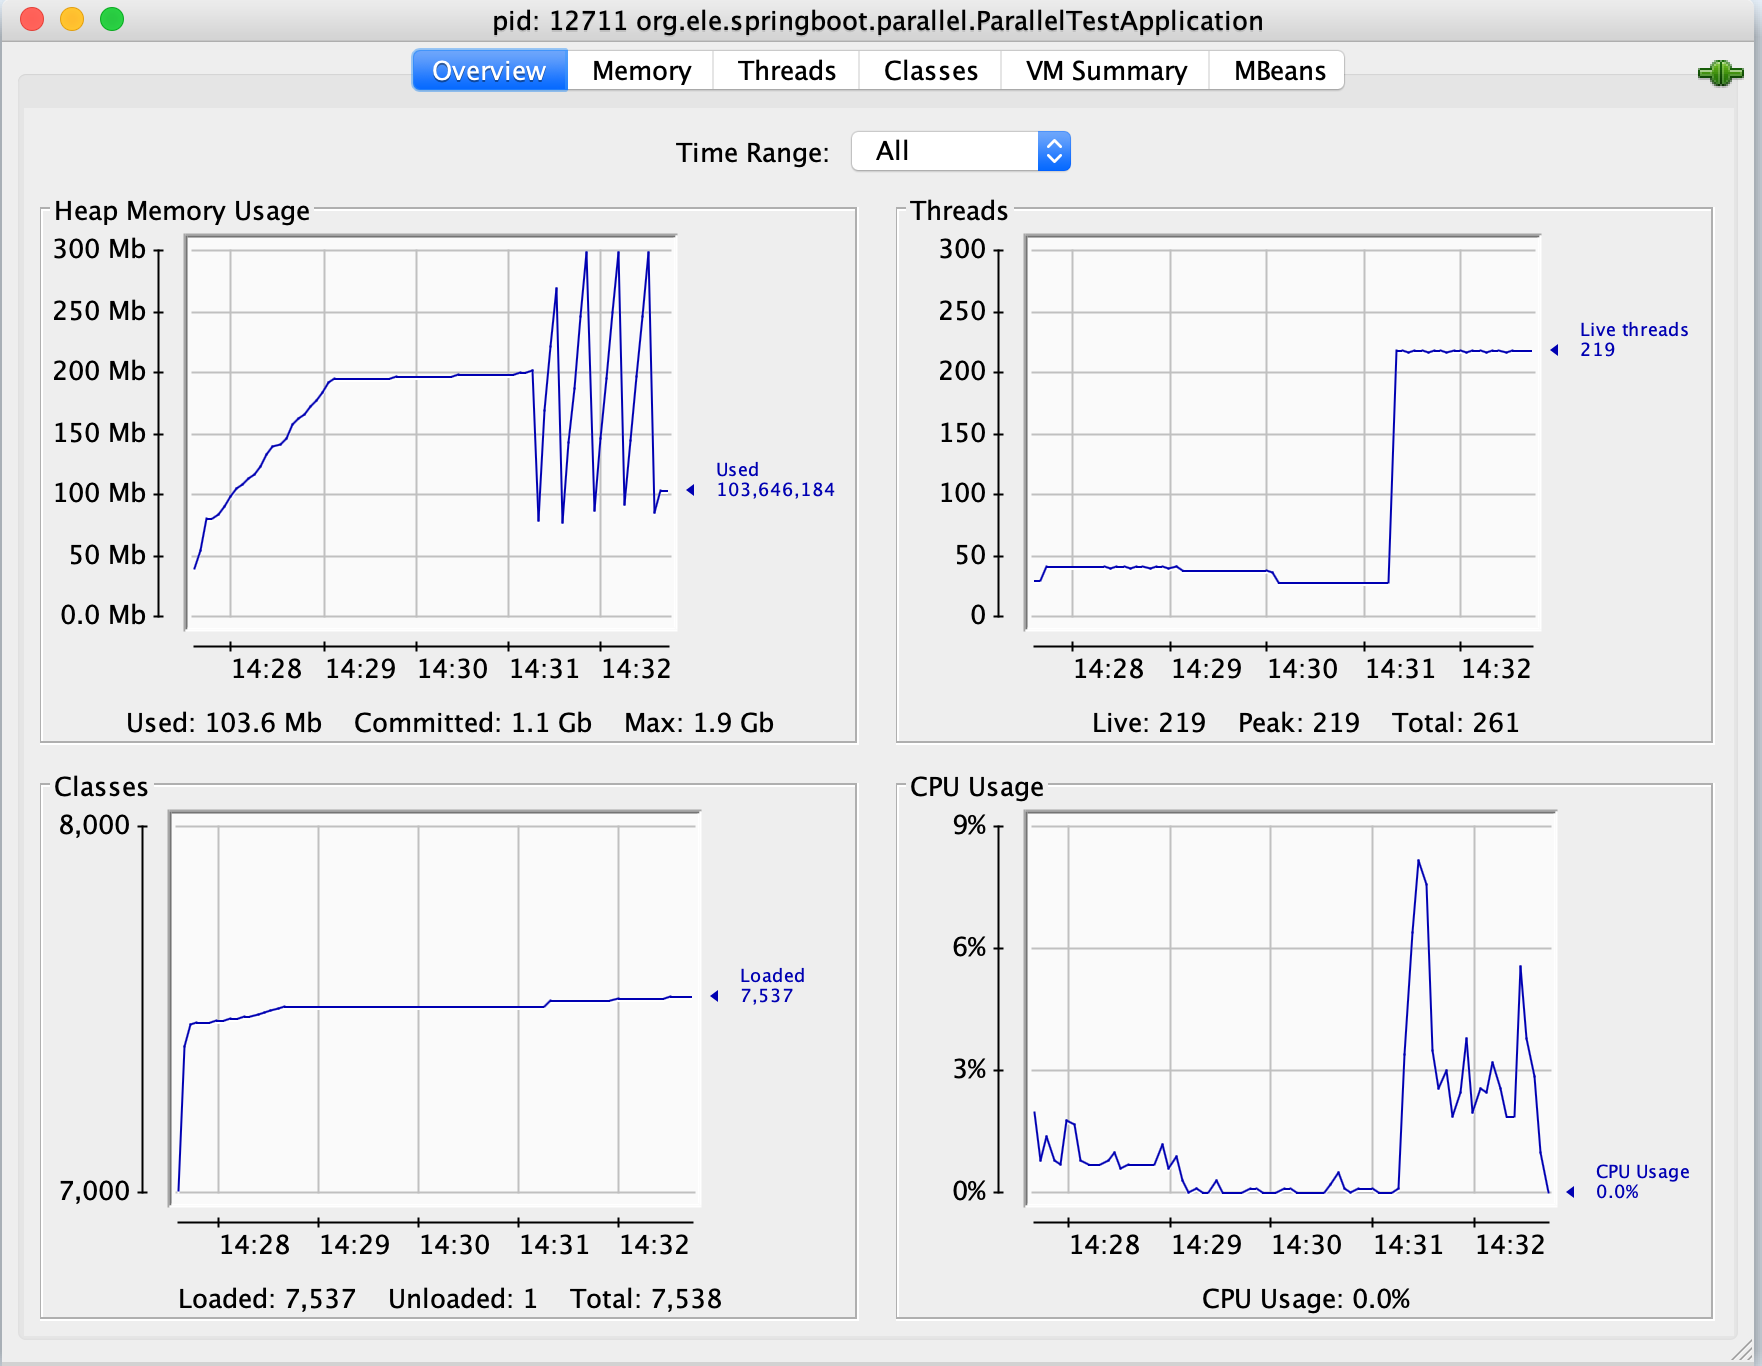
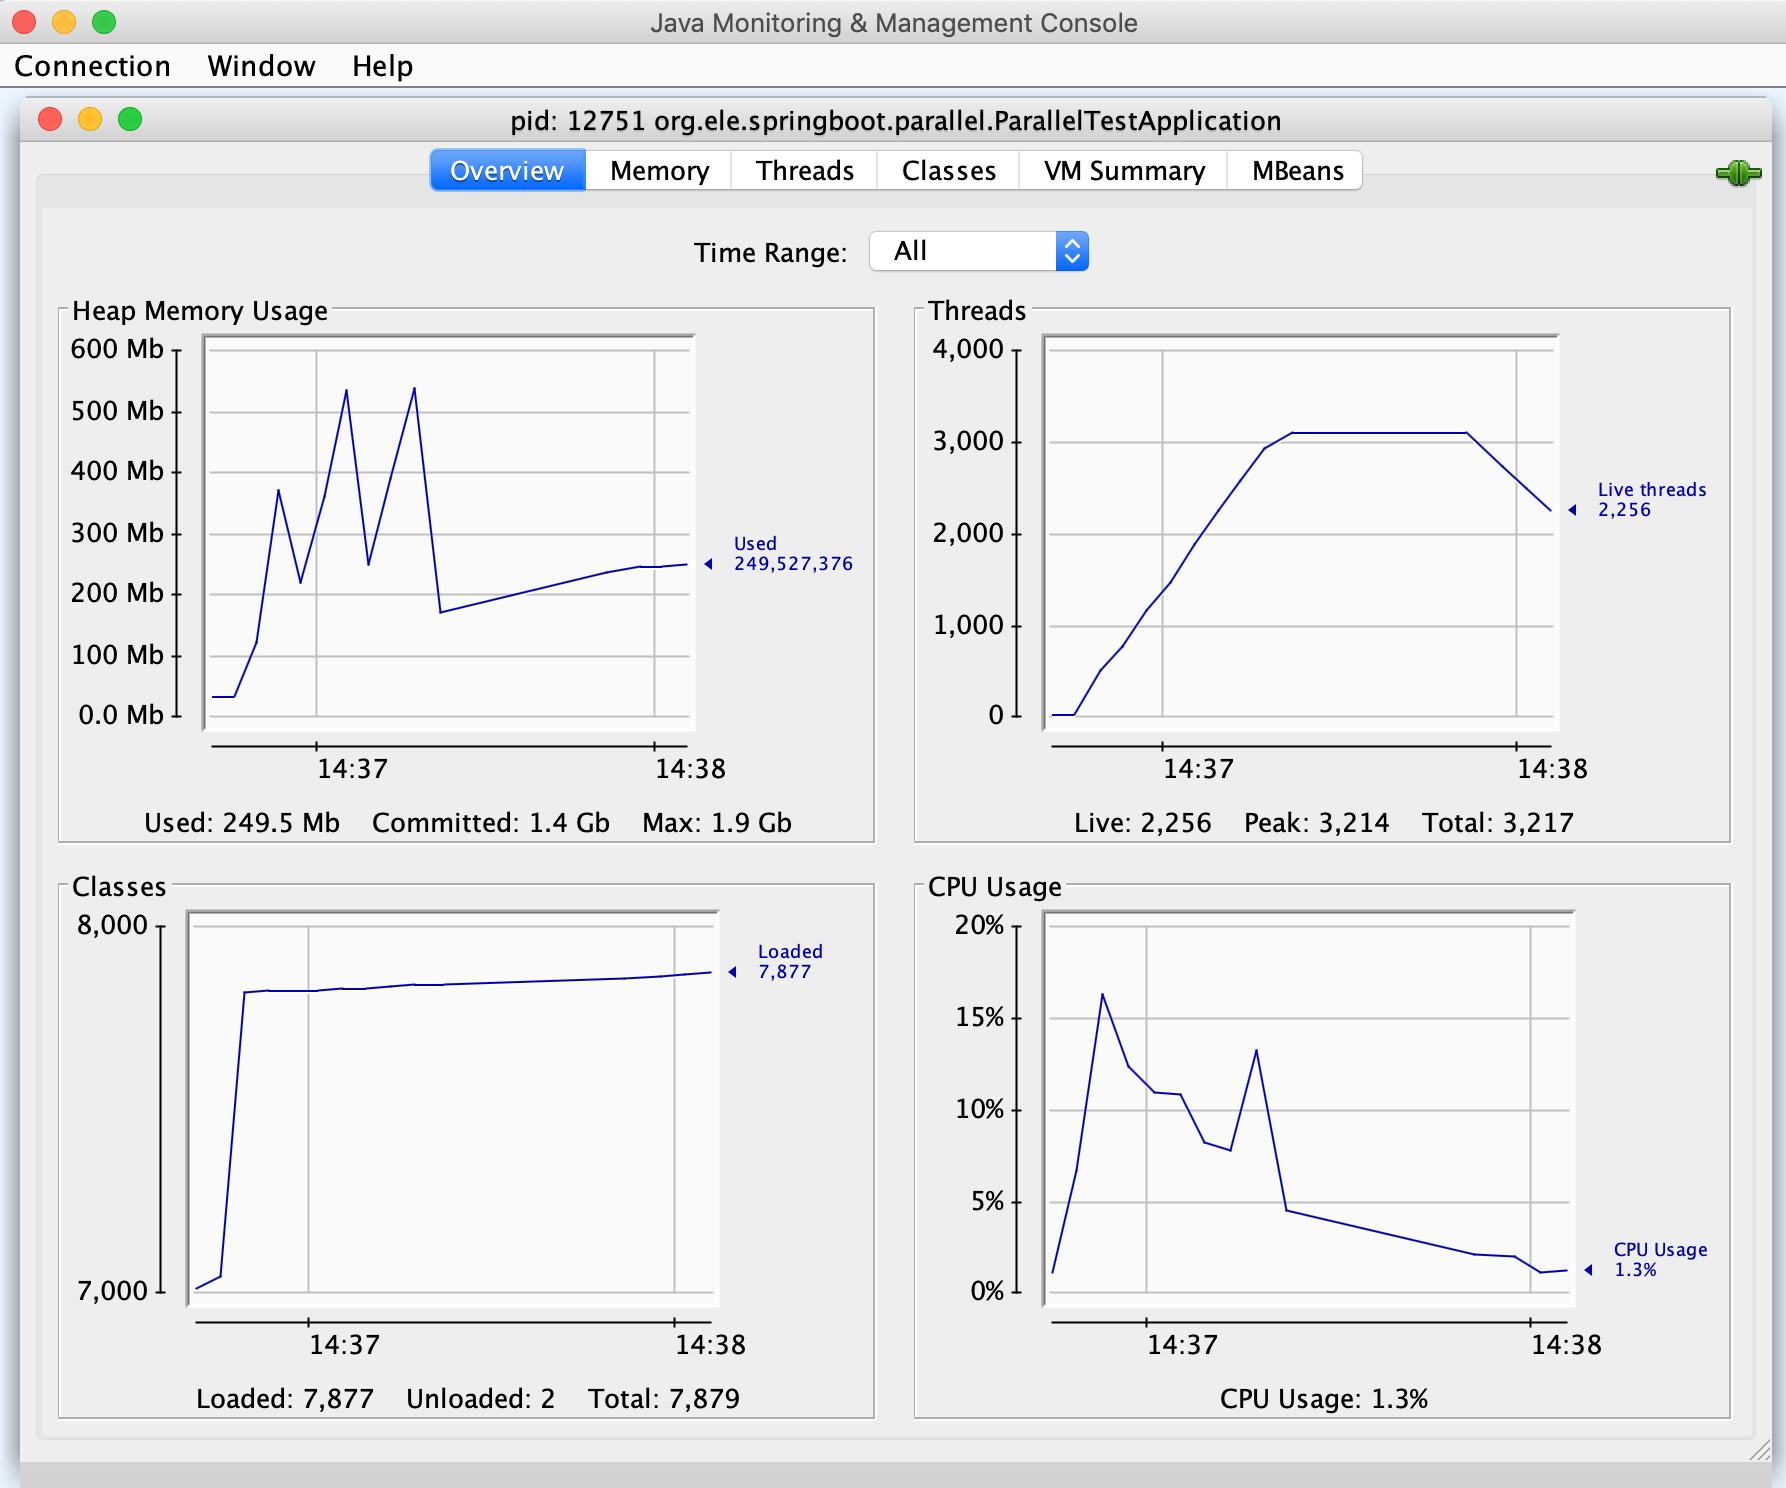
| Maximum Thread number | 219 | 3100 | 226 | |
| Peak Heap Memeory | 300Mb | 550Mb | 510Mb |
The performance of Sequence api
With -c 10 -n 200, time taken for tests: 84.617 seconds
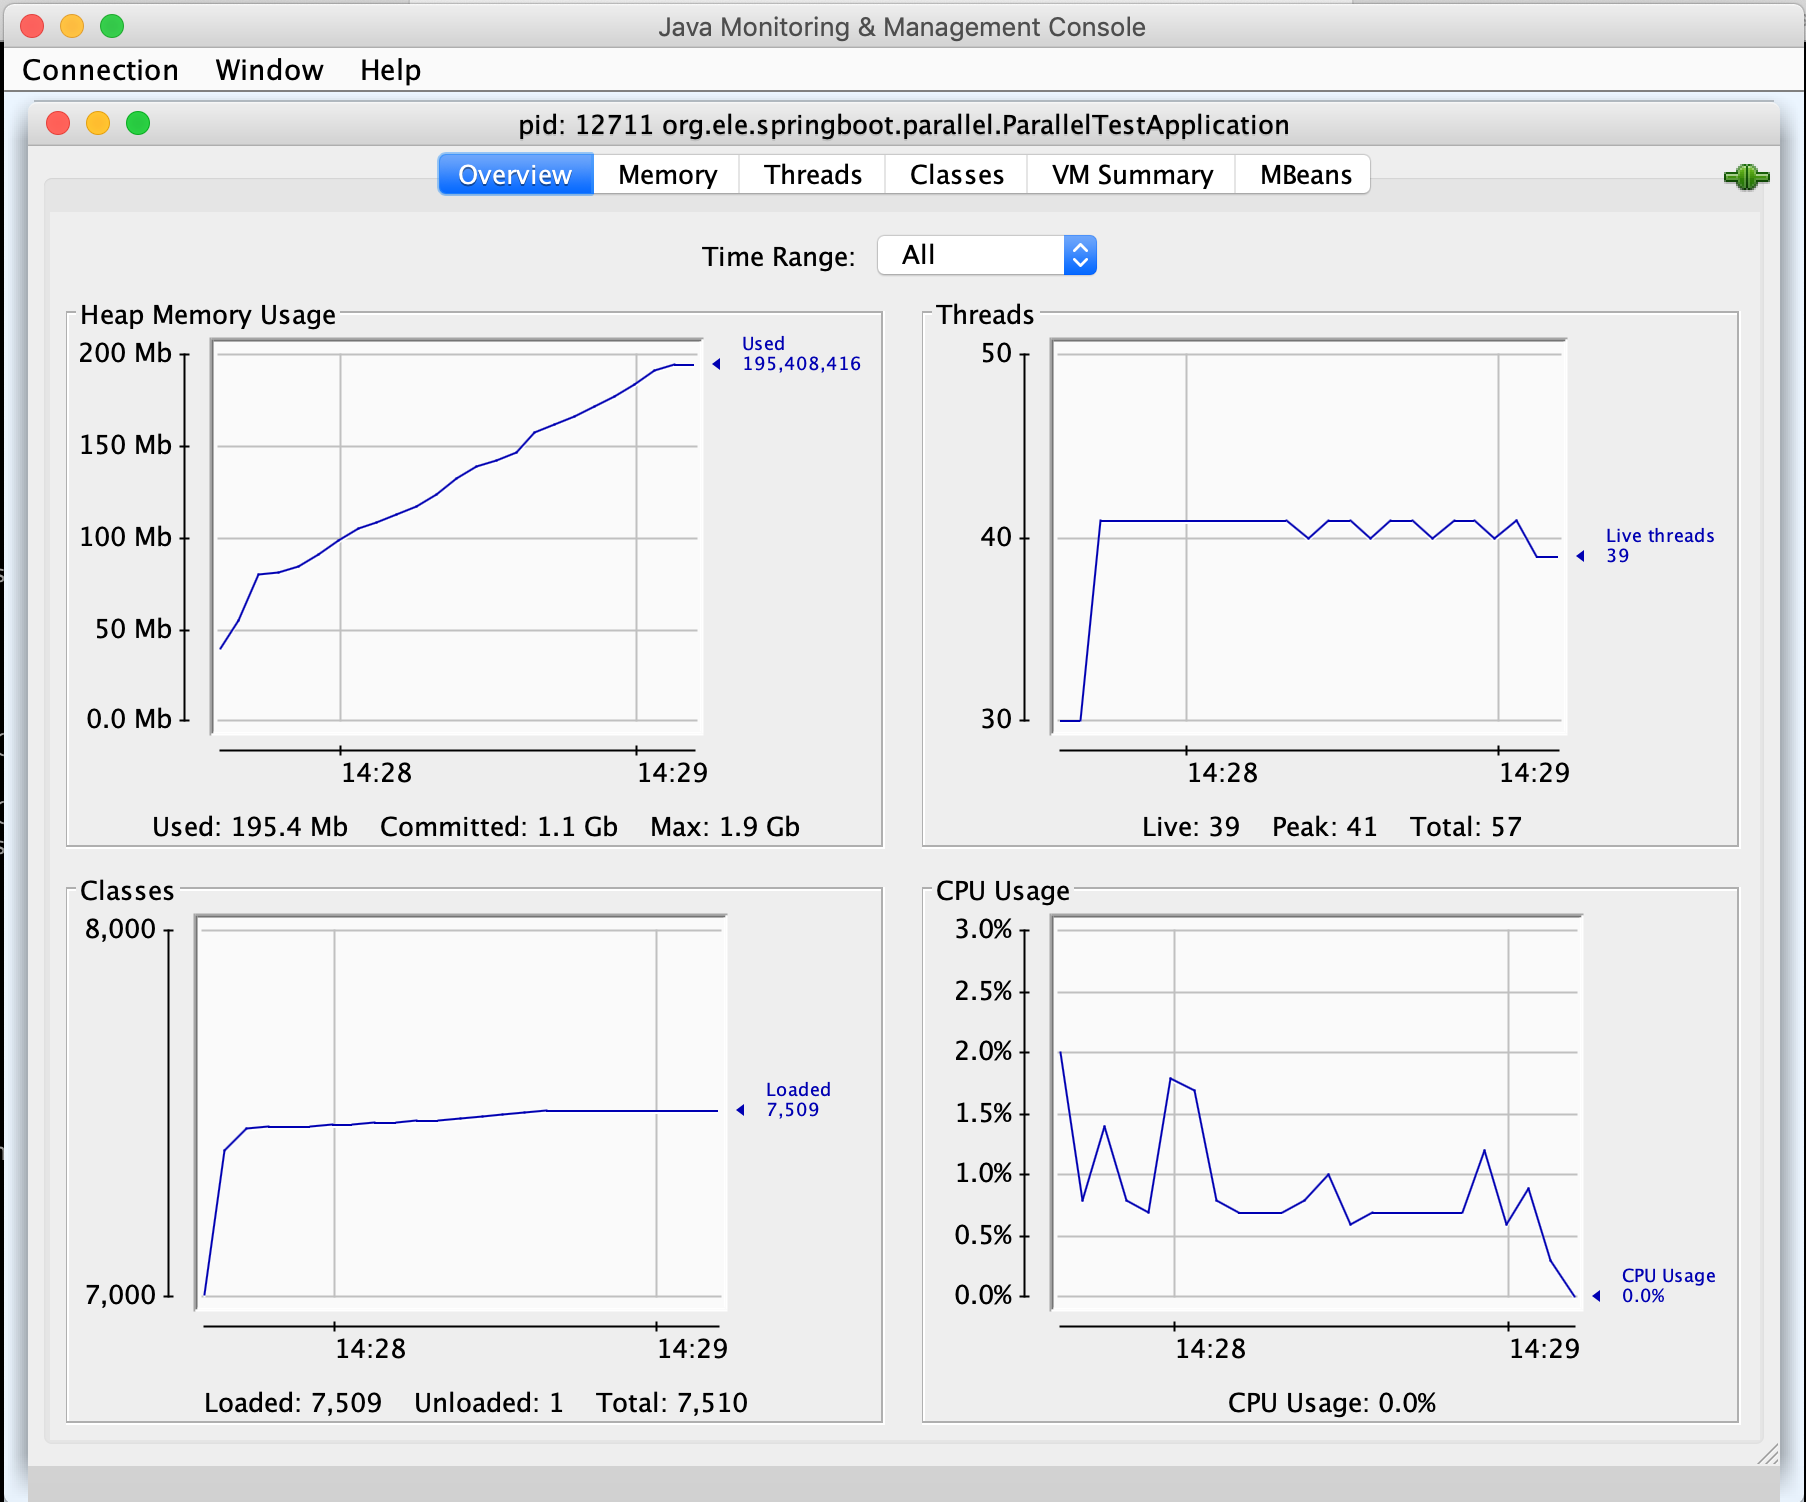
With -c 100 -n 2000, time taken for tests: 84.718 seconds
The performance of parallel api
With -c 10 -n 200, time taken for tests: 43.387 seconds
With -c 100 -n 2000, the ab crashed until finished 898 requests completed
The performance of reactive api
With -c 10 -n 200, time taken for tests: 43.726 seconds
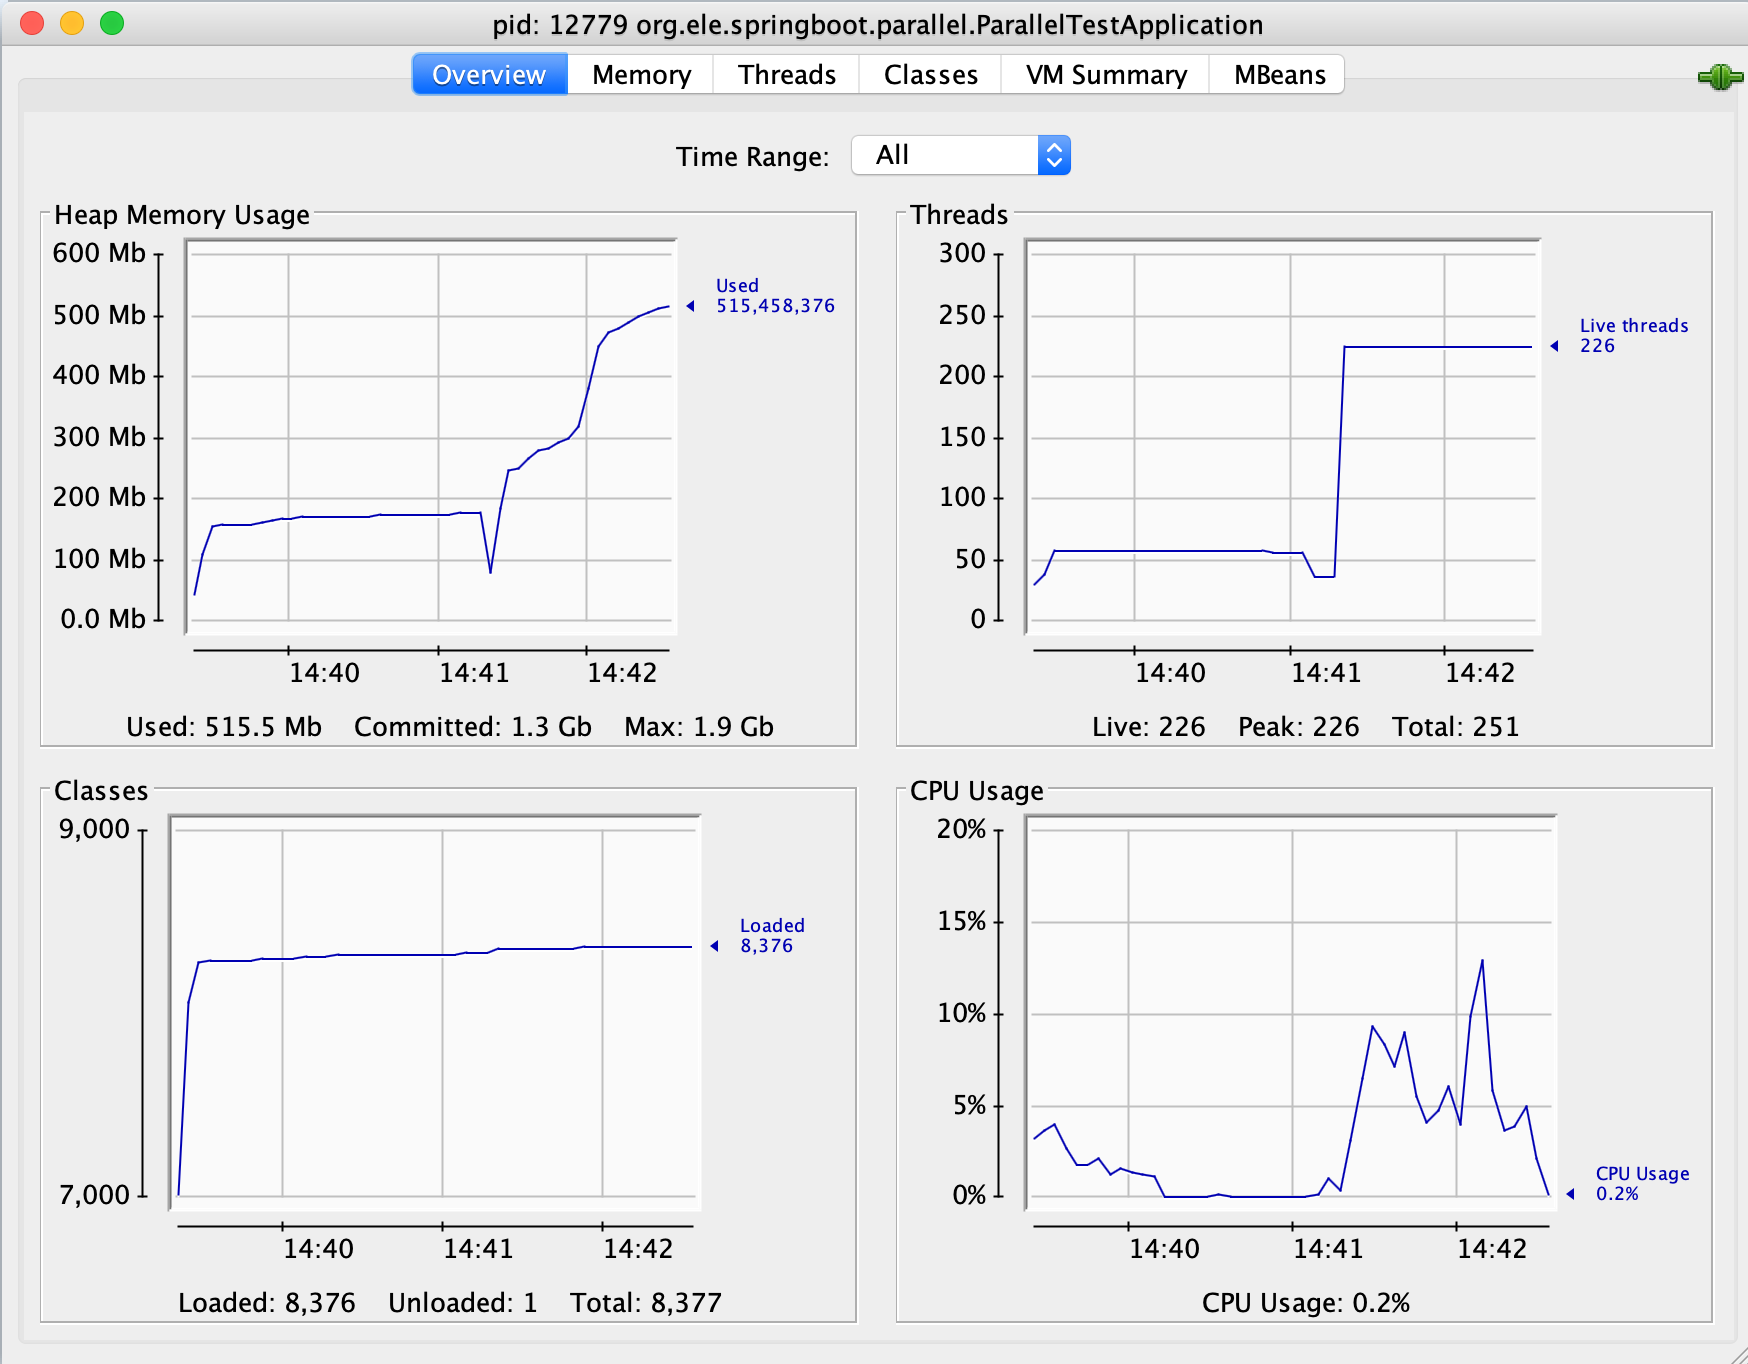
 With
With -c 100 -n 2000, time taken for tests: 71.388 seconds
Further work
- Why does the total of the thread increased so much in Parallel call? Is it the problem of the implementation(okhttp) or the architecture?
- Is it possible to decrease the programming complexity in parallel and reactive class?
- new version prepared
