Important
Visiting here from DevOps Days Montreal? Your demo is here
This set of manifests gets a local obersvability stack up and running quickly. It installs the following services into your local kubernetes cluster:
- Grafana
- Prometheus
- Tempo
- Loki
- Certificate Manager
- OpenTelemetry Controller
- Liatrio OpenTelemetry Collector
- NGrok Ingress and API Gateway Controller
OSX users with Homebrew installed can install the Prerequisites by running the command
brew bundle
- Run kubernetes locally. Here are a few options:
- Docker Desktop: Local instance of Docker and k8s.
- k3d: a lightweight wrapper to run k3s (Rancher Lab’s minimal k8s distribution) in docker.
- Have kubectl installed
- Have kustomize installed
- If using DORA, have NGROK configured with a domain and update the configuration accordingly.
- Have a free NGrok Account with a Permanent domain (if wanting to deploy DORA)
- Have helm installed (gross, only for the ngrok helm chart, will remove this eventually)
To deploy the basic set of configuration with the LGTM stack and a Gateway
OpenTelemetry Collector, run make.
To deploy the GitProvider Receiver:
Make sure the Quick Start has been run first.
-
Create a GitHub PAT
-
Create a
.envfile at the root containing the PAT Nothing Else Aside from the PAT -
Create a kubernetes secret with that PAT by running
kubectl create secret generic git-pat --from-file=GH_PAT=./.env --namespace collector
-
Run
make gpr
The DORA Collector leverages the WebHook Events OpenTelemetry Receiver. As events occur (like deployments) the event LogRecords are sent to the collector. In order to enable sending of data from locations like GitHub, you have to be able to route to your local installation of this collector. In this repository we've defaulted to leveraging NGrok for this configuration. As such this presumes that you have a free NGrok account, an API Key, and an AuthToken.
-
From the NGrok dashboard get your API Key from NGrok.
-
Get your Auth Token from NGrok.
-
Get your free permanent domain from NGrok.
-
Export your env vars:
export NGROK_AUTHTOKEN=authtoken
export NGROK_API_KEY=apikey
-
Run
make ngrokto setup the controller. -
Update the webhook route config with your permanent domain in the host rules (see example below):
spec:
ingressClassName: ngrok
rules:
   # Change this to match your NGrok permanent domain
   - host: example.ngrok-free.app
-
Run
make dora
![]()
-
To run the demo, you will need to have a Kubernetes cluster running locally as well as
kubectlinstalled. We will use k3d to create a local cluster. If you do not have these installed, you can install them by running one of the followings commands depending on your OS:Linux
curl -s https://raw.githubusercontent.com/k3d-io/k3d/main/install.sh | bash
curl -LO "https://dl.k8s.io/release/$(curl -L -s https://dl.k8s.io/release/stable.txt)/bin/linux/amd64/kubectl"
Mac
brew install k3d
brew install kubectl
-
Once we have these prerequisites installed, we can actually deploy the local cluster by running the following command:
k3d cluster create mycluster
-
Once the cluster is created, we can actually deploy the demo resources themselves by running:
make apply-traces
-
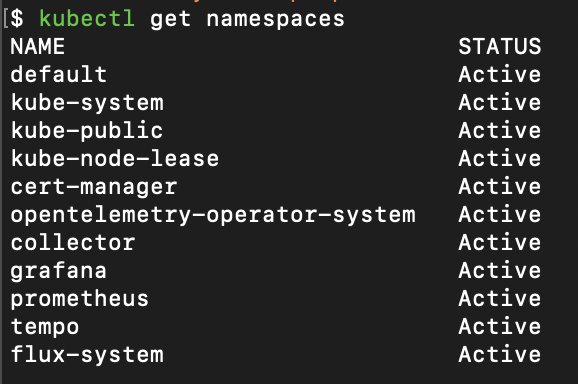
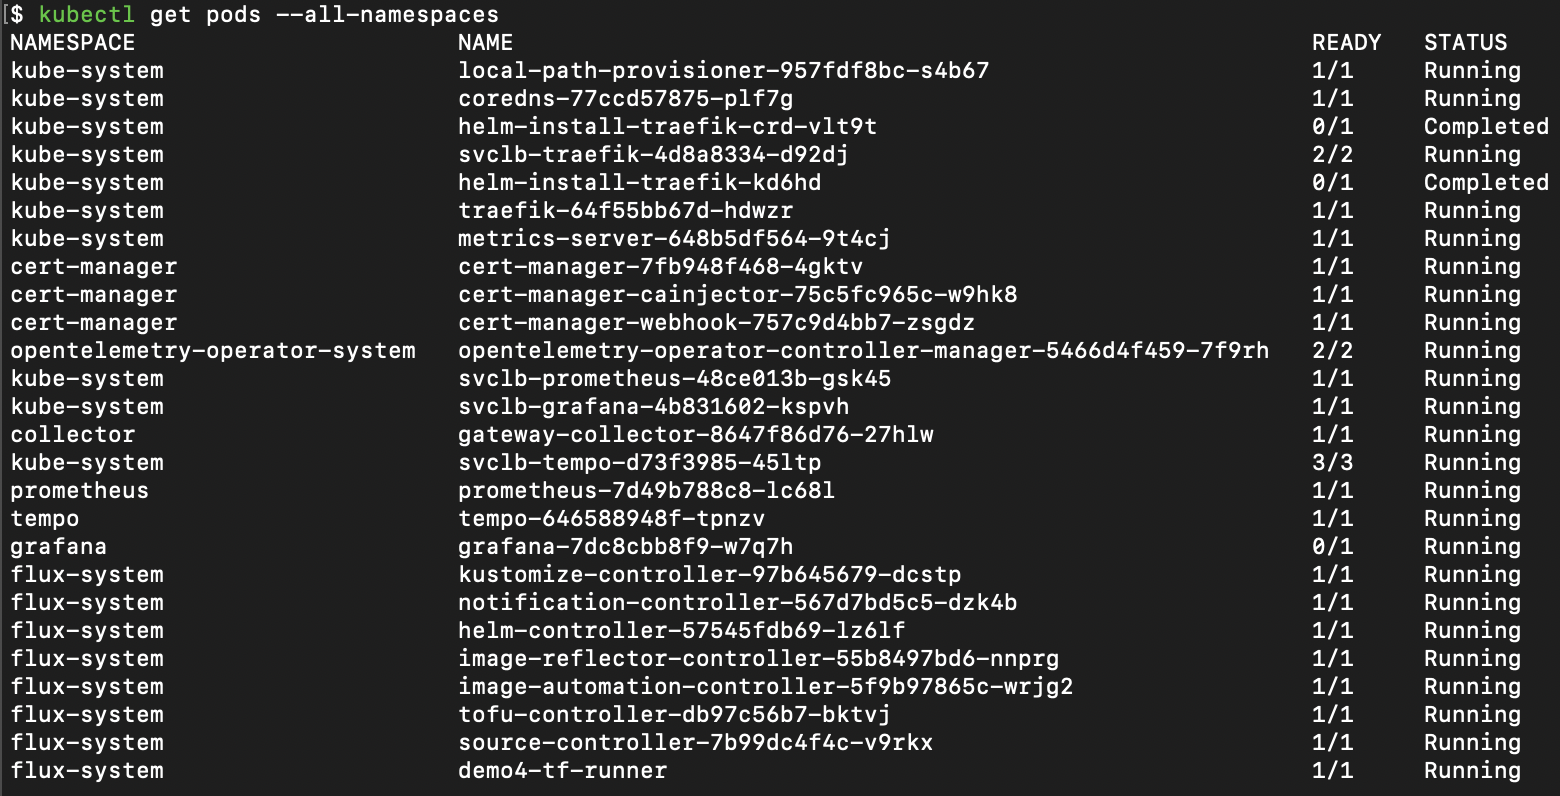
Verify that the namespaces are present and the pods are running. They should look like this:
-
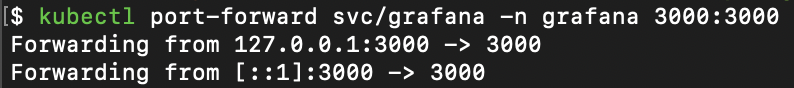
Once everything is up and looking healthy, we can portforward the Grafana service to view the dashboard by doing the following:
-
Once the port-forward is setup, you can visit the Grafana dashboard by visiting
http://localhost:3000in your browser. The dashboard will be the only one in the demo folder and will look like this: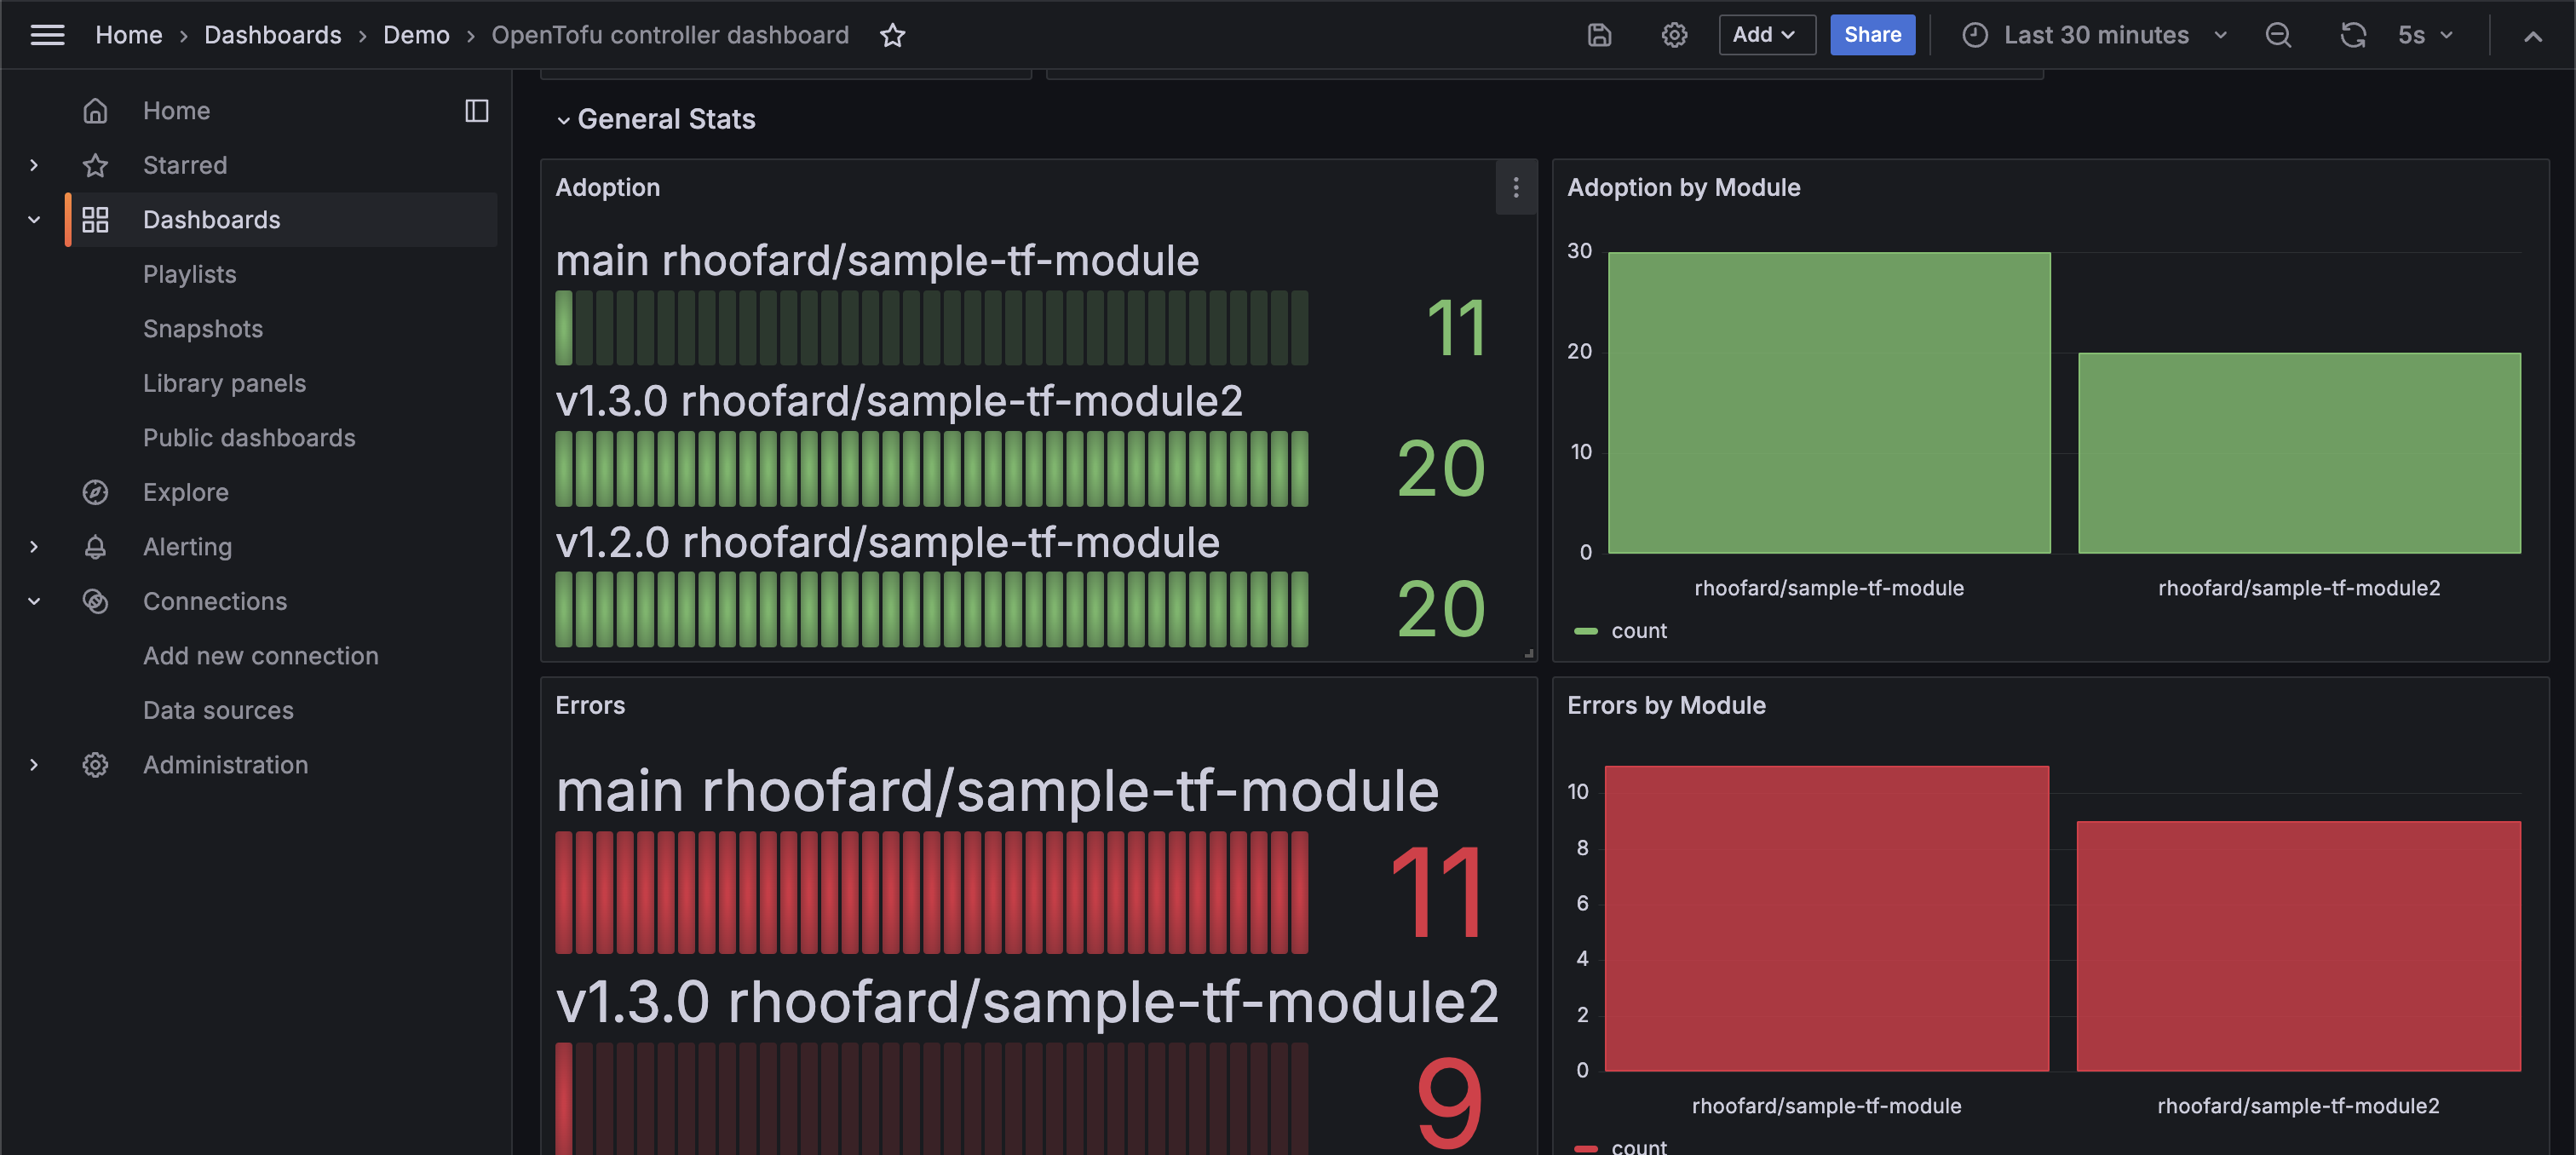
[!IMPORTANT] Grafana will ask for a login which will just be the default credentials of
username:admin password:admin. It will ask you to change it but you can skip this step if you would like.


make delete-tracesWe have an instrumented version of the flux-iac Tofu Controller which is part of what makes this demo possible. Our fork with the changes are here
The other core piece of the demo is our instrumented version of the OpenTofu binary. Similarly our fork with the changes are here
To be able to use the Tofu Controller after deploying the traces
configuration with your own terraform, you will need to do the following.
-
Update the
source_control.ymlfile in thecluster-infra/tofu-controller/folder so that it points towards a repository with terraform resources inside of it.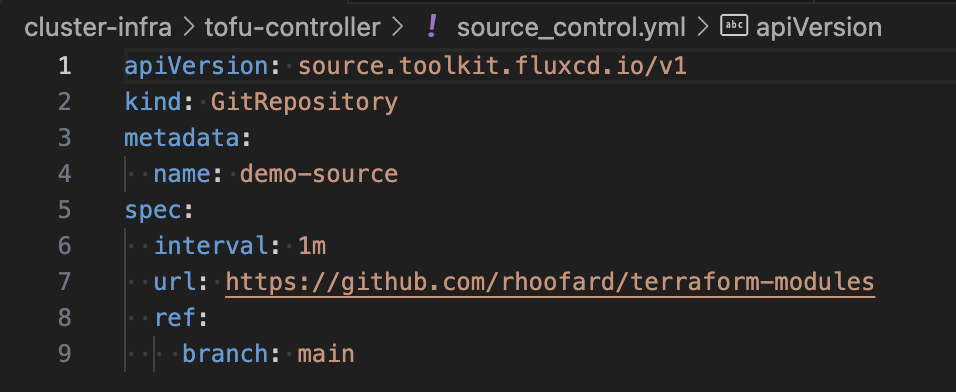
-
Update one of the
terraform.ymlfiles in the same folder so it references the name of the object you created with thesource_control.ymlfile in thesourceReffield. Then update thepathfield with the specific path to the terraform resources you want to use inside the repository.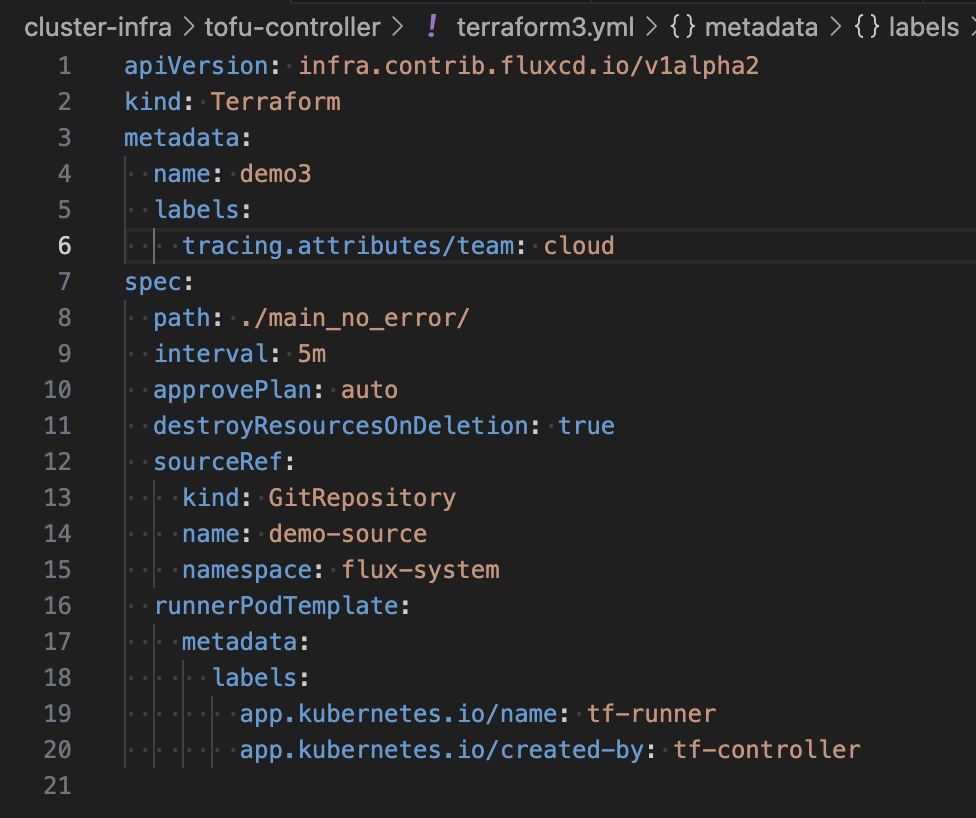
-
If you add your own files to the folder, you will need to update the
kustomization.ymlfile in the folder to include the new files if you want them to be deployed with the rest of the resources -
Run
make apply-tracesto update the resources in the cluster with the new configuration.


- For the purposes of the tracing demo these will by default be configured to apply null resources to the cluster since deploying resources to a cloud provider requires an additional auth setup that is not done here.
- Deploying kubernetes resources is also possible but requires you to update the
tf-runnerservice account with a cluster role that has permissions to act on those resources.