notebooks | motivating example | installing | widgets | voila

Here, we will use a motivating example that looks at CO2 data to demonstrate interactive computing with:
The example we follow is adapted from the Intro-Jupyter tutorial from ICESat-2Hackweek, which has contributions from: Shane Grigsby (@espg), Lindsey Heagy (@lheagy), Yara Mohajerani (@yaramohajerani), and Fernando Pérez (@fperez).
- UBC Students & Faculty can run on Syzygy:
- or if you don't have a UBC CWL with full Syzygy access (a "guest" account will not be sufficient) you can use:
There are three notebooks in this repository
- 1-widgets-an-example.ipynb: A demo notebook that makes use of widgets to explore atmospheric CO2 data and linear models
- 2-voila.ipynb: A notebook based on the same CO2 data that is meant to be run as a voila dashboard
- 3-more-on-widgets.ipynb: A notebook with more details on widgets
The climate emergency is one of the most pressing issues of our time. At this pivotal moment, the decisions and actions we take today will reverberate beyond our own borders and lifetimes. -- UBC Climate Emergency Engagement
Carbon Dioxide (CO2) is a greenhouse gas, and significant contributor to the warming of the climate. It is an important input into climate models, which we use to make predictions about possible future climate scenarios, and sometimes to make policy decisions, including carbon taxes.
Question: Based on historical CO2 data, can we estimate what CO2 concentrations will be in the future?
- explore the idea of "learning": building a model from data that lets us make predictions
- introduce the principles of linear regression, a simple, but powerful method for estimating a linear model of data
- explore the impact of outliers in data on the model
- discuss the limitations of models
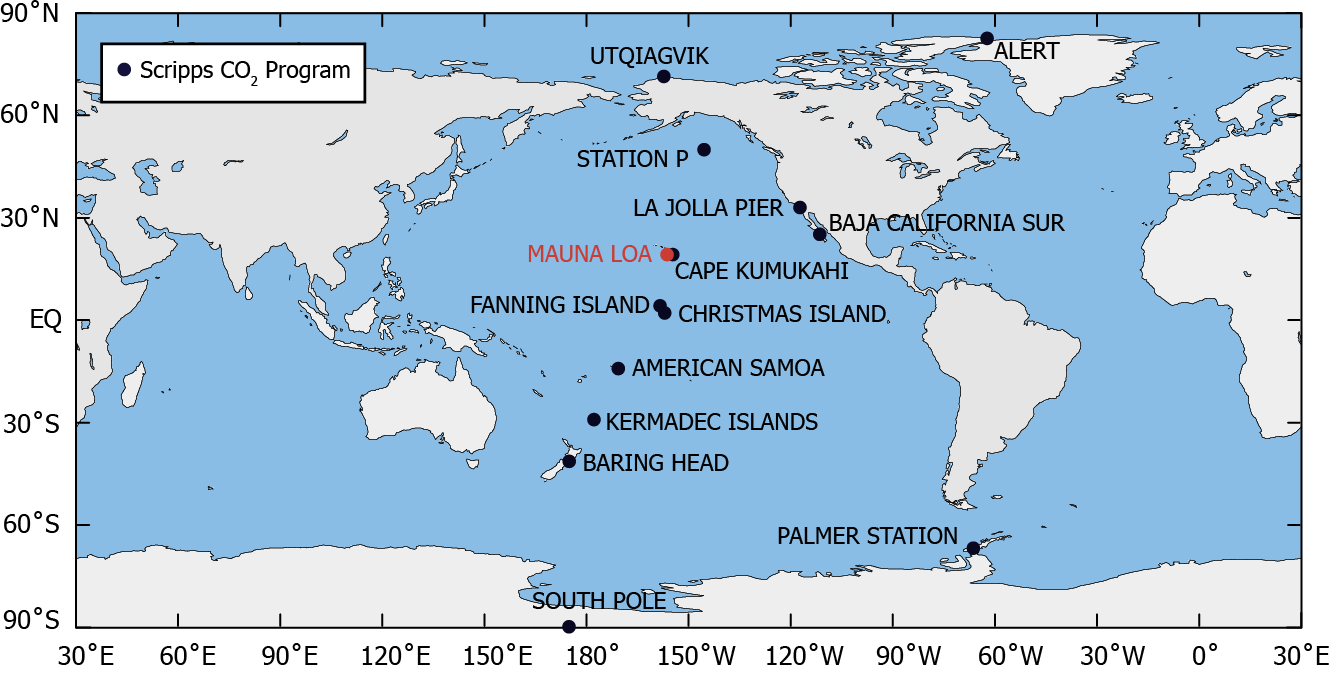
Scripps institute of Oceanography has a research station at Mauna Loa in Hawaii where they have been measuring atmospheric CO2 since 1958. The data we will focus on are the seasonally adjusted data.
Data Source
C. D. Keeling, S. C. Piper, R. B. Bacastow, M. Wahlen, T. P. Whorf, M. Heimann, and H. A. Meijer, Exchanges of atmospheric CO2 and 13CO2 with the terrestrial biosphere and oceans from 1978 to 2000. I. Global aspects, SIO Reference Series, No. 01-06, Scripps Institution of Oceanography, San Diego, 88 pages, 2001. https://scrippsco2.ucsd.edu/data/atmospheric_co2/primary_mlo_co2_record.html
To run the notebooks locally, you will need to have python installed, preferably through anaconda. Please download Python 3.7 or greater.
Once you have downloaded and installed anaconda, you can then clone this repository. From a command line (if you are on windows, please use the anaconda terminal that came with the installation) run
git clone https://github.com/lheagy/ubc-jupyterdays-2020-widgets.git
Then cd into the ubc-jupyterdays-2020-widgets directory:
cd ubc-jupyterdays-2020-widgets
To setup your software environment, we recommend you use the provided conda environment
conda env create -f environment.yml
conda activate ubc-demo
You can then launch Jupyter
jupyter notebook
Jupyter will then launch in your web-browser.
Jupyter widgets allow you to connect interactive controls such as slide bars and toggle buttons to your code.
They can be used to create "notebook apps" that abstract away details of the code and focus conversations on the role of parameters in a computation, or be a quick way to create a "Just-in-time-research-GUI" (GUI: graphical user interface) to explore results.
Widgets can be installed with pip
pip install ipywidgets
jupyter nbextension enable --py widgetsnbextension
or conda (which also enables the extension)
conda install -c conda-forge ipywidgets
To enable the Jupyter Lab extension
jupyter labextension install @jupyter-widgets/jupyterlab-manager
For your first interaction with widgets, I recommend trying out interact. The interact function ipywidgets.interact is a quick way to create user interface controls on your functions. At the most basic level, interact autogenerates controls for function arguments, and then calls the function with those arguments when you manipulate the controls interactively. To use interact, you need to define a function that you want to explore.
Voilà turns Jupyter notebooks into standalone web applications.
Unlike the usual HTML-converted notebooks, each user connecting to the Voilà tornado application gets a dedicated Jupyter kernel which can execute the callbacks to changes in Jupyter interactive widgets.
- The intro blog provides an overview and resources for getting up and running with Voilà
- The Voilà gallery has a collection of examples built with Voilà and Jupyter widgets.
If you are running on binder, you can use the Voilà button!

Voilà can be installed using conda
conda install -c conda-forge voila
or from PyPI
pip install voila
Once Voilà has been installed,
-
you can run it as a standalone server
voila notebook.ipynb -
or as a server extention by changing the url to
<url-of-my-server>/voila(e.g. if you launchedjupyter lablocally, and it was running athttp://localhost:8888/lab, then then Voilà would be accessed athttp://localhost:8888/voila. -
there is also a JupyterLab extention for previewing your dashboard
jupyter labextension install @jupyter-voila/jupyterlab-preview -
by default, Voilà will strip out the source code from view. It can be displayed if the option
strip_sourcesis set to False
Many thanks to Abby Azari and Fernando Pérez for taking time to provide feedback on these notebooks!