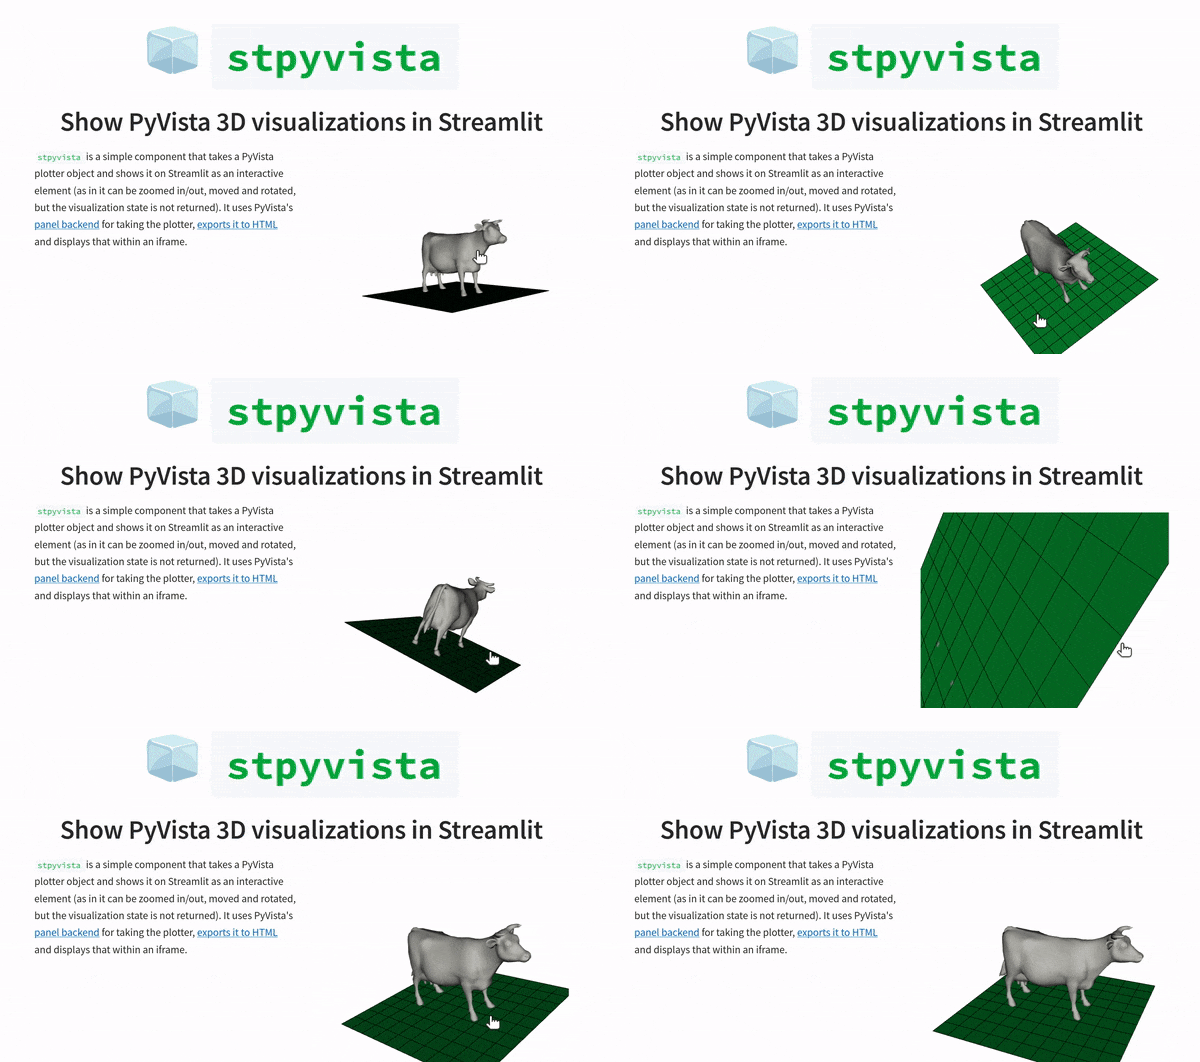
This is a simple component that takes a PyVista plotter object and shows it on Streamlit as an interactive element (as in it can be zoomed in/out, moved and rotated, but the visualization state is not returned). It uses PyVista's panel backend and it basically takes the plotter, exports it to HTML and displays that within an iframe.
⚠️ panelandpythreejsas pyvista backends were deprecated in favor oftrame.
pip install stpyvistaimport streamlit as st
import pyvista as pv
from stpyvista import stpyvista
# pythreejs does not support scalar bars :(
pv.global_theme.show_scalar_bar = False
## Initialize a plotter object
plotter = pv.Plotter(window_size=[400,400])
## Create a mesh with a cube
mesh = pv.Cube(center=(0,0,0))
## Add some scalar field associated to the mesh
mesh['myscalar'] = mesh.points[:, 2]*mesh.points[:, 0]
## Add mesh to the plotter
plotter.add_mesh(mesh, scalars='myscalar', cmap='bwr', line_width=1)
## Final touches
plotter.view_isometric()
plotter.add_scalar_bar()
plotter.background_color = 'white'
## Pass a key to avoid re-rendering at each time something changes in the page
stpyvista(plotter, key="pv_cube")- The PyVista project at https://www.pyvista.org/
- @blackary's blog post on how to build a custom component
- Other stuff from me on https://edsaac.github.io


