wdb is a complete web debugger for wsgi project (implemented as a wsgi middleware).
Unlike other web debuggers, wdb is based on the python bdb debugger framework. (The one used by pdb)
This allows step by step debugging during the rendering of the page as well as exception inspection in the very state the exception occured.
In other words it's an enhanced version of pdb directly in your browser with nice features.
WebSockets! All debug information between web page and web server transits throught a websocket opened on a random port. Server request processing is blocked by the websocket and then resumed when the debugging is over.
$ pip install wdb
To try it you can simply run the run.py script which is a flask application which will be accessible at http://localhost:1984/, http://localhost:1984/wtf for step by step testing.
To try it on another wsgi application, use the Wdb middleware:
    from wdb import Wdb
    wsgi_app = Whathever_wsgi_server_lib()
    my_app = Wdb(wsgi_app)
my_app.serve_forever() from wdb import Wdb
app = Flask(__name__)
app.wsgi_app = Wdb(app.wsgi_app)
app.run()In your wsgi.py, add the middleware:
After:
    # This application object is used by any WSGI server configured to use this
    # file. This includes Django's development server, if the WSGI_APPLICATION
    # setting points here.
    from django.core.wsgi import get_wsgi_application
    application = get_wsgi_application()
Add this:
    from wdb import Wdb
    application = Wdb(application)
In your settings.py, activate exception propagation:
    DEBUG = True
DEBUG_PROPAGATE_EXCEPTIONS = TrueYou can now put some breakpoint in a request code:
do_something()
import wdb; wdb.set_trace()
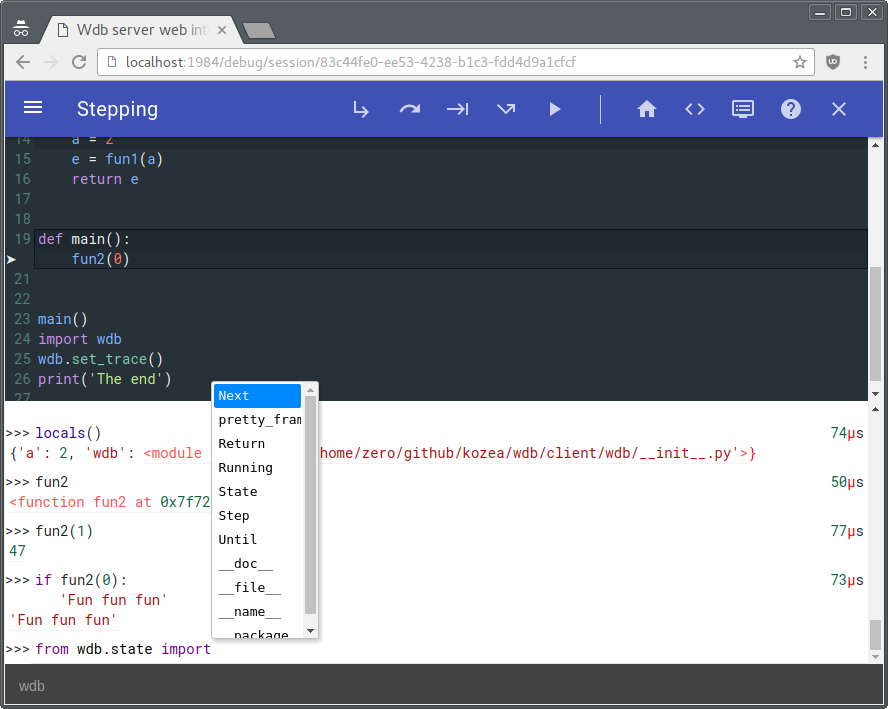
returnOnce you are in a breakpoint or in an exception, you can eval all you want in the prompt under the code.
Multi-lines are partially supported using [Shift] + [Enter].
As of now the following special commands are supported during breakpoint:
.s or [Ctrl] + [↓] or [F11]: Step into.n or [Ctrl] + [→] or [F10]: Step over (Next).r or [Ctrl] + [↑] or [F9]: Step out (Return).c or [Ctrl] + [←] or [F8]: Continue.u or [F7]: Until (Next over loops).j lineno: Jump to lineno (Must be at bottom frame and in the same function).b [file:]lineno[, condition]: Break on file at lineno (file is the current file by default).t [file:]lineno[, condition]: Same as b but break only once.f: Echo all typed commands in the current debugging session.d expression: Dump the result of expression in a table.q: Quit.h: Get some helpexpr !> file: Write the result of expr in file!< file: Eval the content of file[Enter]: Eval the current selected text in page, useful to eval code in the source[Ctrl] + [r]: Search back in command history[Ctrl] + [Shift] + [r]: Search forward in command history
You can also eval a variable in the source by middle clicking on it. You can add/remove a breakpoint by clicking on the line number. NB: Hotkeys with arrows are purposedly not triggered in the eval prompt to avoid conflicts when typing.
This library is licensed under GPLv3
wdb - An improbable web debugger through WebSockets
wdb Copyright (C) 2013  Florian Mounier, Kozea

This program is free software: you can redistribute it and/or modify
it under the terms of the GNU General Public License as published by
the Free Software Foundation, either version 3 of the License, or
(at your option) any later version.

This program is distributed in the hope that it will be useful,
but WITHOUT ANY WARRANTY; without even the implied warranty of
MERCHANTABILITY or FITNESS FOR A PARTICULAR PURPOSE.  See the
GNU General Public License for more details.

You should have received a copy of the GNU General Public License
along with this program.  If not, see <http://www.gnu.org/licenses/>.