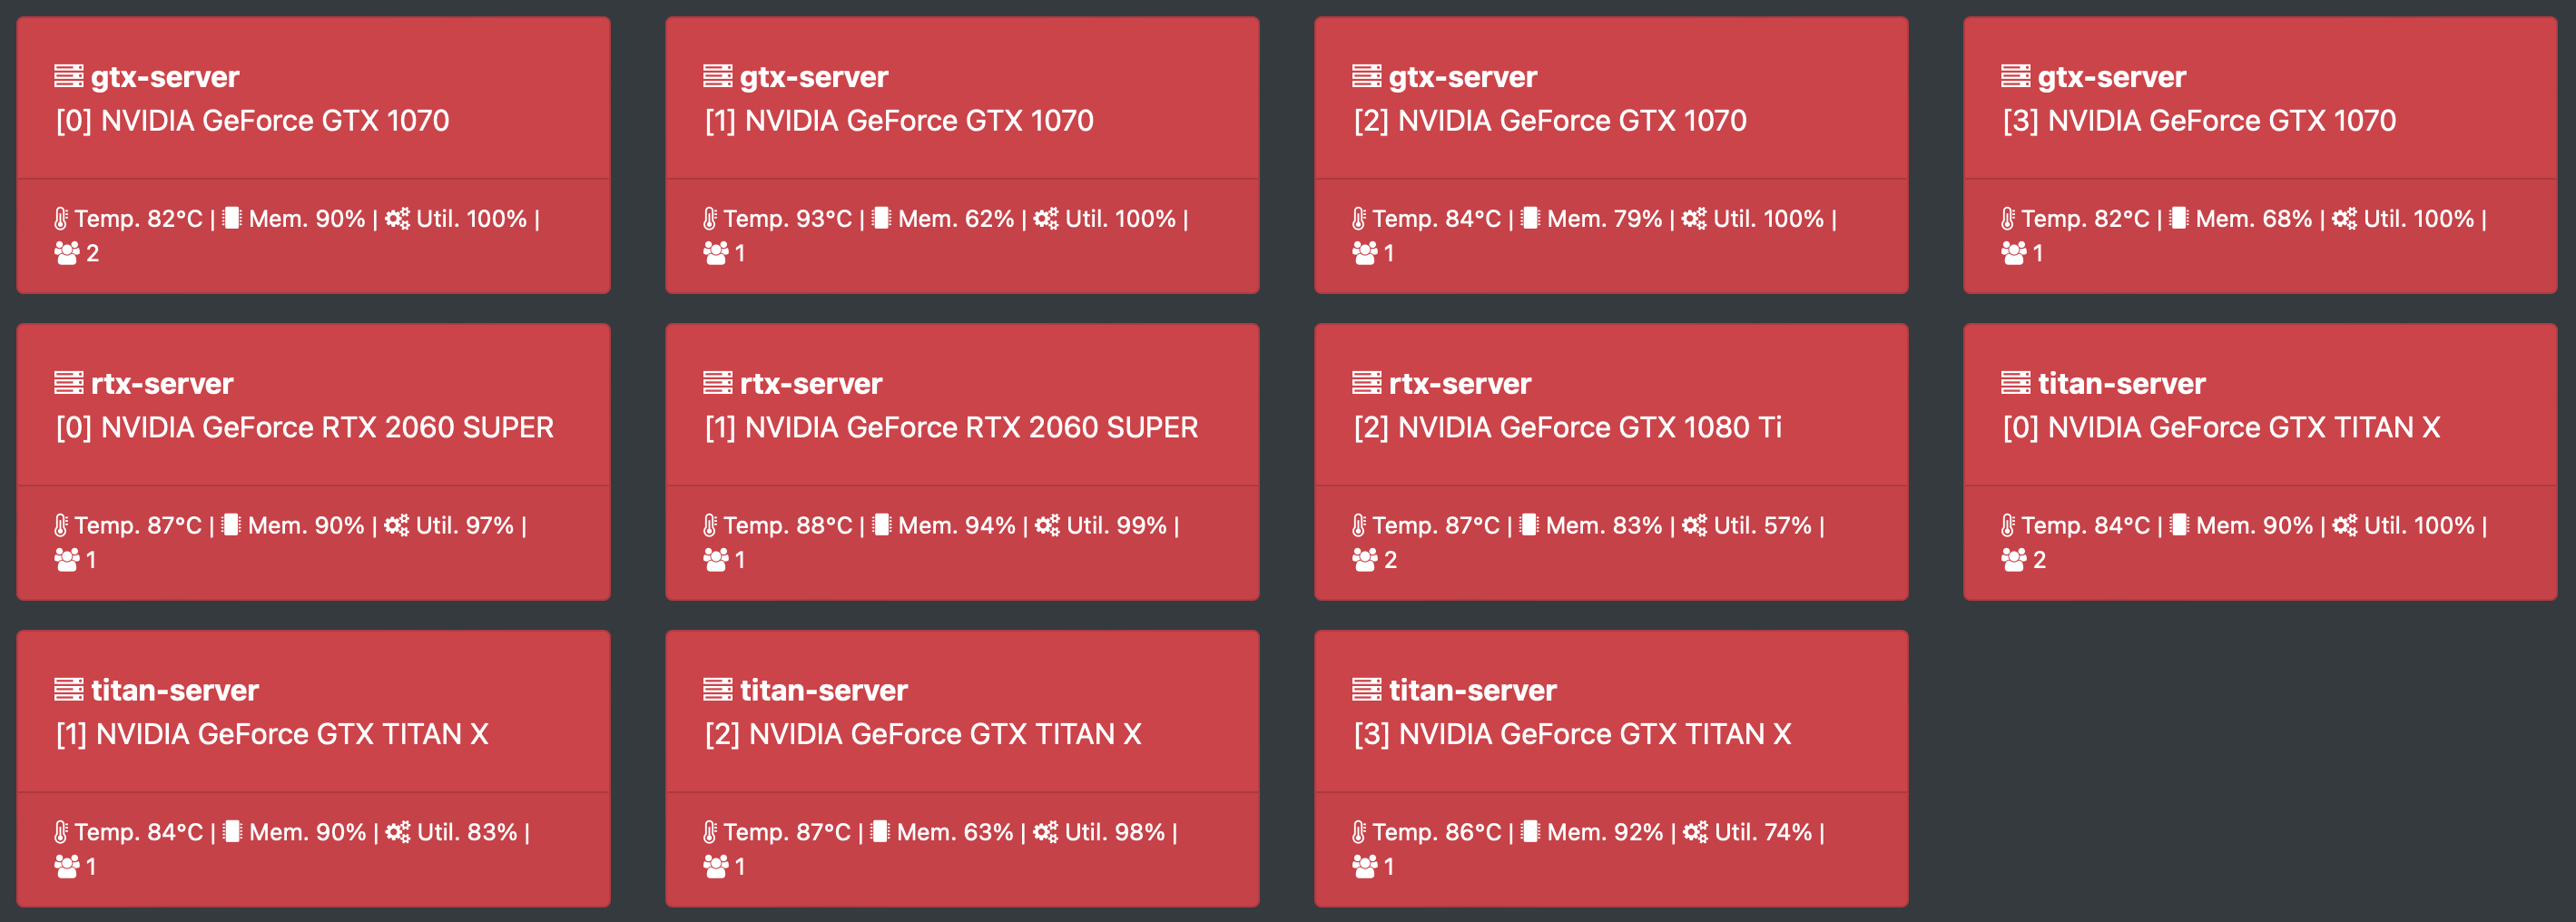
GPU is an expensive resource, and deep learning practitioners have to monitor the health and usage of their GPUs, such
as the temperature, memory, utilization, and the users. This can be done with tools like nvidia-smi and gpustat from
the terminal or command-line. Often times, however, it is not convenient to ssh into servers to just check the GPU
status.
GPUView is meant to mitigate this by running a lightweight web dashboard on top of gpustat. With GPUView one can monitor GPUs on a web browser. Moreover, multiple GPU servers can be registered into one GPUView dashboard and all stats are aggregated and accessible from one place.
$ pip install git+https://github.com/leftthomas/GPUView.git@master
$ gpuview run --host 127.0.0.1
This will start the dashboard at 127.0.0.1:9988. By default, gpuview runs at port 9988, but these can be changed
by using --host and --port.
There a few important options in gpuview, use -h to see them all.
run: Startgpuviewdashboard server--host: IP address of host (e.g. 127.0.0.1)--port: Port number of host (default: 9988)
add: Register a GPU host--url: URL of GPU host (IP:Port, e.g. X.X.X.X:9988)--name: An optional readable name for the GPU host
remove: Remove a GPU host--url: URL of the GPU host to remove
hosts: Print all GPU hosts-h,--help: Print help for command-line options
To aggregate the stats of multiple machines, they can be registered to one dashboard using their address and the port
number running gpustat.
Register a host to monitor as follows:
$ gpuview add --url <ip:port> --name <name>
Remove a registered host as follows:
$ gpuview remove --url <ip:port>
Display all registered hosts as follows:
$ gpuview hosts
Note: the
gpuviewservice needs to run in all hosts that will be monitored.
Tip:
gpuviewcan be setup on a none GPU machine, such as laptops, to monitor remote GPU servers.
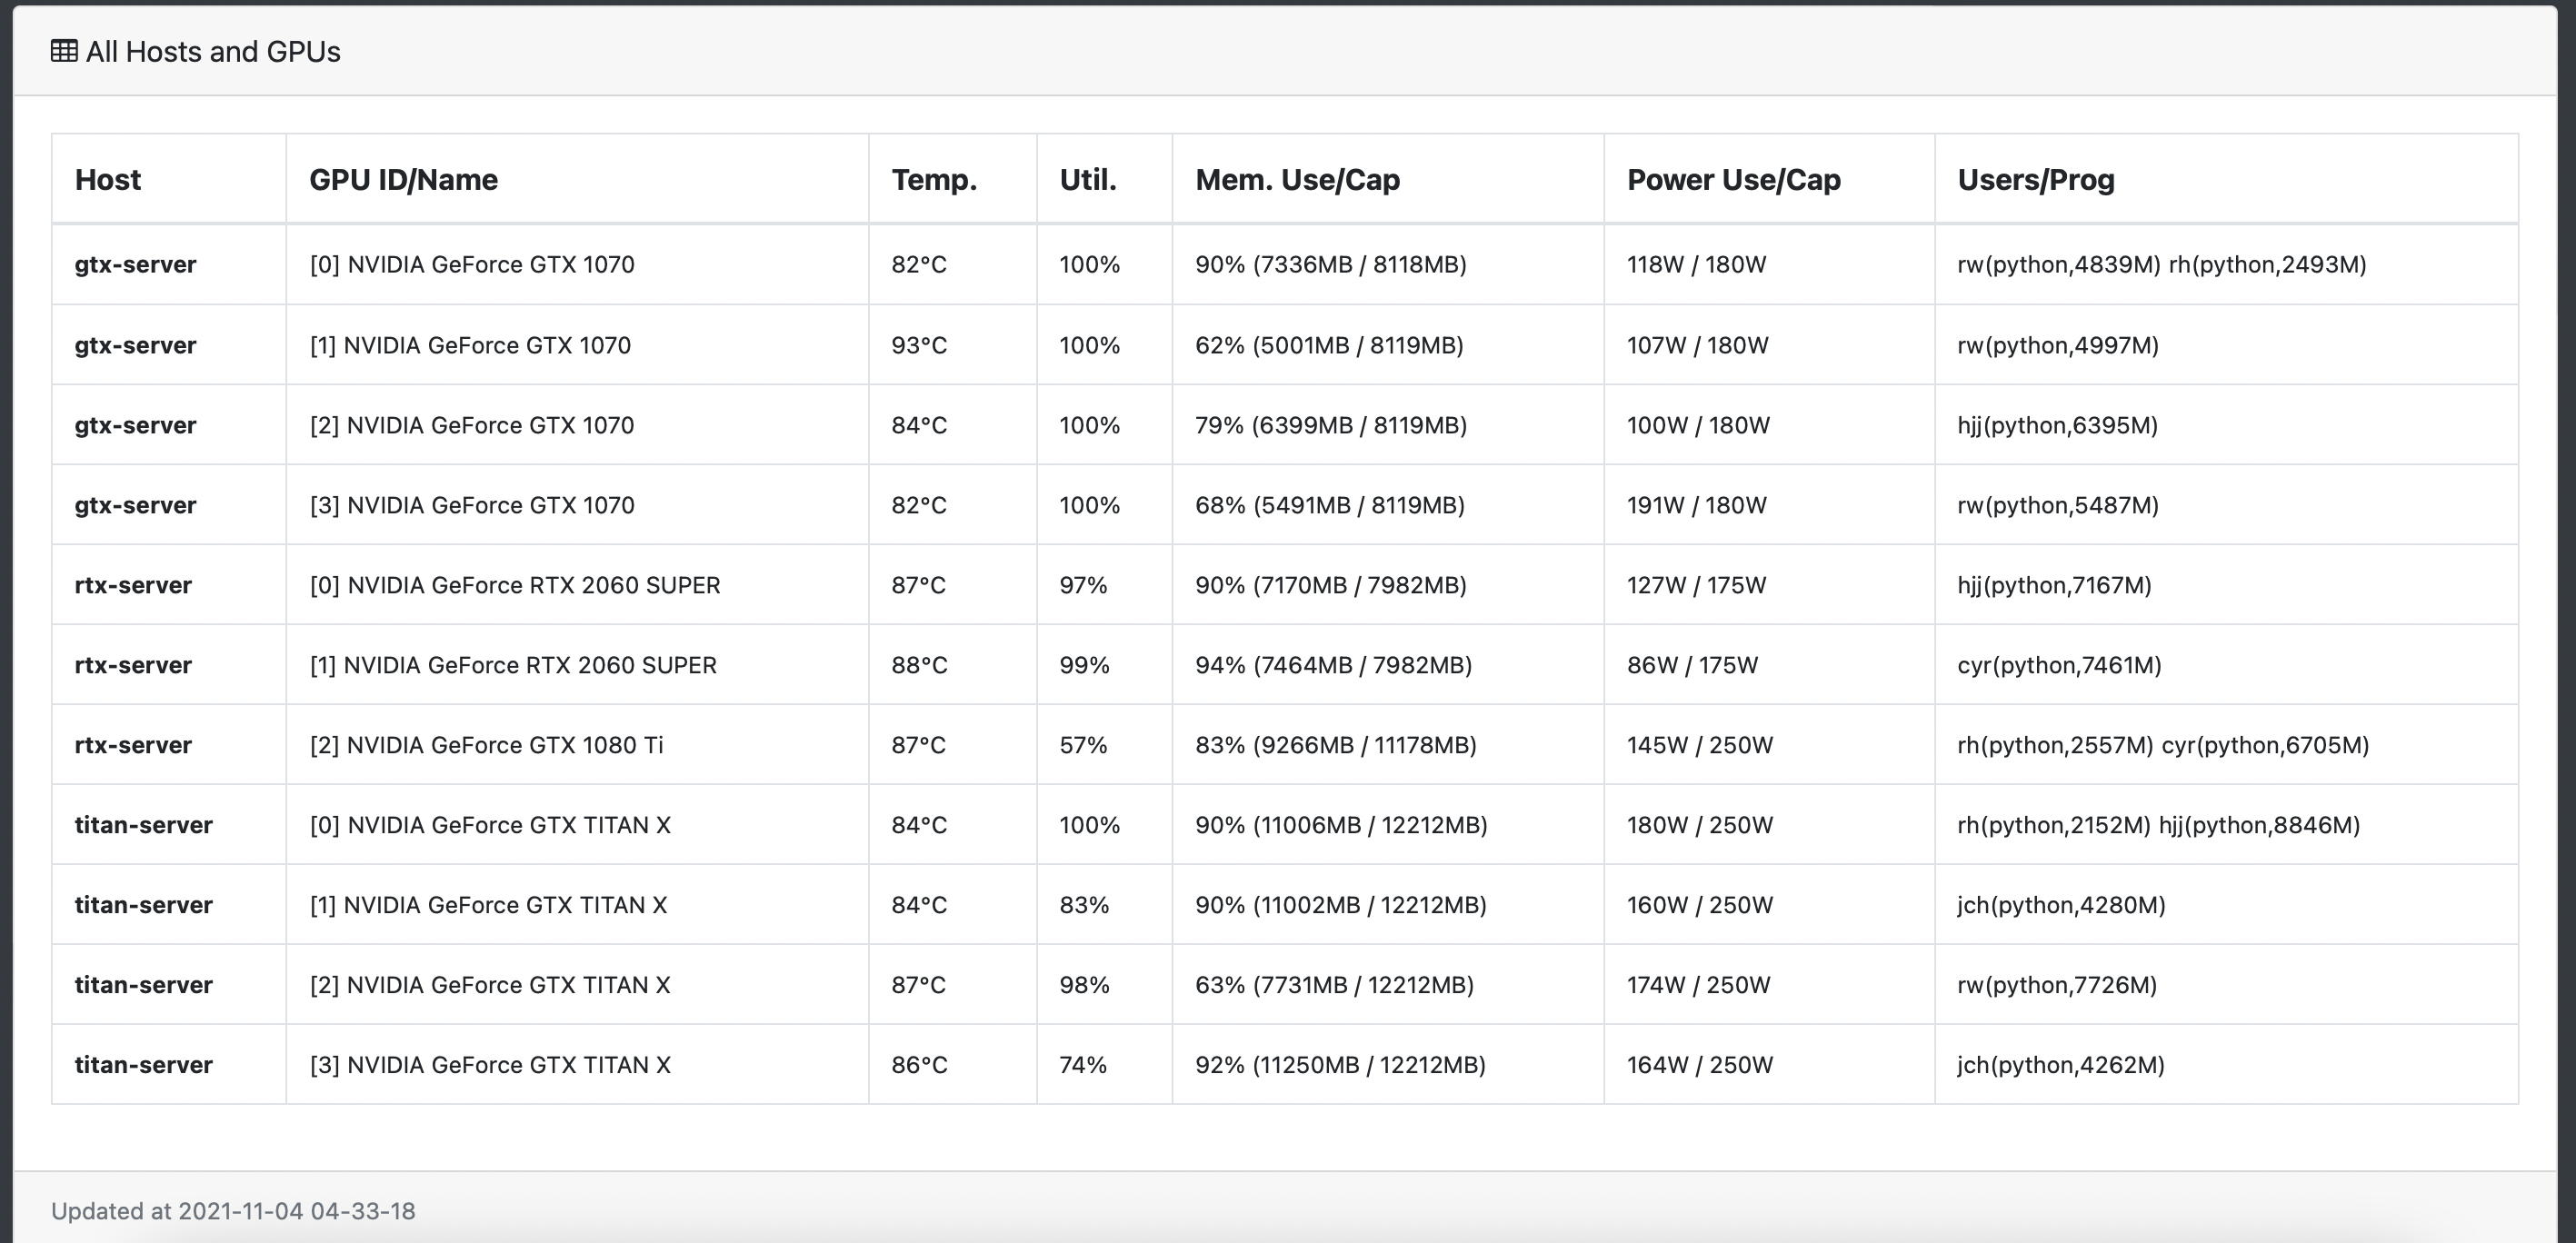
Detailed view of GPUs across multiple servers, this repo is base on gpuview.

