As discussed, this section is all about synthesizing your skills in order to work through a full Data Science workflow. In this lesson, you'll take a look at some general outlines for how Data Scientists organize their workflow and conceptualize their process.
You will be able to:
- List the different data science process frameworks
- Compare and contrast popular data science process frameworks such as CRISP-DM, KDD, OSEMN
Data Science projects are often complex, with many stakeholders, data sources, and goals. Due to this, the Data Science community has created several methodologies for helping organize and structure Data Science Projects. In this lesson, you'll explore three of the most popular methodologies -- CRISP-DM, KDD, and OSEMN, and explore how you can make use of them to keep your projects well-structured and organized.

CRISP-DM is probably the most popular Data Science process in the Data Science world right now. Take a look at the visualization above to get a feel for CRISP-DM. Notice that CRISP-DM is an iterative process!
Let's take a look at the individual steps involved in CRISP-DM.
Business Understanding: This stage is all about gathering facts and requirements. Who will be using the model you build? How will they be using it? How will this help the goals of the business or organization overall? Data Science projects are complex, with many moving parts and stakeholders. They're also time intensive to complete or modify. Because of this, it is very important that the Data Science team working on the project has a deep understanding of what the problem is, and how the solution will be used. Consider the fact that many stakeholders involved in the project may not have technical backgrounds, and may not even be from the same organization. Stakeholders from one part of the organization may have wildly different expectations about the project than stakeholders from a different part of the organization -- for instance, the sales team may be under the impression that a recommendation system project is meant to increase sales by recommending upsells to current customers, while the marketing team may be under the impression that the project is meant to help generate new leads by personalizing product recommendations in a marketing email. These are two very different interpretations of a recommendation system project, and it's understandable that both departments would immediately assume that the primary goal of the project is one that helps their organization. As a Data Scientist, it's up to you to clarify the requirements and make sure that everyone involved understands what the project is and isn't.
During this stage, the goal is to get everyone on the same page and to provide clarity on the scope of the project for everyone involved, not just the Data Science team. Generate and answer as many contextual questions as you can about the project.
Good questions for this stage include:
- Who are the stakeholders in this project? Who will be directly affected by the creation of this project?
- What business problem(s) will this Data Science project solve for the organization?
- What problems are inside the scope of this project?
- What problems are outside the scope of this project?
- What data sources are available to us?
- What is the expected timeline for this project? Are there hard deadlines (e.g. "must be live before holiday season shopping") or is this an ongoing project?
- Do stakeholders from different parts of the company or organization all have the exact same understanding about what this project is and isn't?
Data Understanding:
Once we have a solid understanding of the business implications for this project, we move on to understanding our data. During this stage, we'll aim to get a solid understanding of the data needed to complete the project. This step includes both understanding where our data is coming from, as well as the information contained within the data.
Consider the following questions when working through this stage:
- What data is available to us? Where does it live? Do we have the data, or can we scrape/buy/source the data from somewhere else?
- Who controls the data sources, and what steps are needed to get access to the data?
- What is our target?
- What predictors are available to us?
- What data types are the predictors we'll be working with?
- What is the distribution of our data?
- How many observations does our dataset contain? Do we have a lot of data? Only a little?
- Do we have enough data to build a model? Will we need to use resampling methods?
- How do we know the data is correct? How is the data collected? Is there a chance the data could be wrong?
Data Preparation:
Once we have a strong understanding of our data, we can move onto preparing the data for our modeling steps.
During this stage, we'll want to handle the following issues:
- Detecting and dealing with missing values
- Data type conversions (e.g. numeric data mistakenly encoded as strings)
- Checking for and removing multicollinearity (correlated predictors)
- Normalizing our numeric data
- Converting categorical data to numeric format through one-hot encoding
Modeling:
Once we have clean data, we can begin modeling! Remember, modeling, as with any of these other steps, is an iterative process. During this stage, we'll try to build and tune models to get the highest performance possible on our task.
Consider the following questions during the modeling step:
- Is this a classification task? A regression task? Something else?
- What models will we try?
- How do we deal with overfitting?
- Do we need to use regularization or not?
- What sort of validation strategy will we be using to check that our model works well on unseen data?
- What loss functions will we use?
- What threshold of performance do we consider as successful?
Evaluation:
During this step, we'll evaluate the results of our modeling efforts. Does our model solve the problems that we outlined all the way back during step 1? Why or why not? Often times, evaluating the results of our modeling step will raise new questions, or will cause us to consider changing our approach to the problem. Notice from the CRISP-DM diagram above, that the "Evaluation" step is unique in that it points to both Business Understanding and Deployment. As we mentioned before, Data Science is an iterative process -- that means that given the new information our model has provided, we'll often want to start over with another iteration, armed with our newfound knowledge! Perhaps the results of our model showed us something important that we had originally failed to consider the goal of the project or the scope. Perhaps we learned that the model can't be successful without more data, or different data. Perhaps our evaluation shows us that we should reconsider our approach to cleaning and structuring the data, or how we frame the project as a whole (e.g. realizing we should treat the problem as a classification rather than a regression task). In any of these cases, it is totally encouraged to revisit the earlier steps.
Of course, if the results are satisfactory, then we instead move onto deployment!
Deployment:
During this stage, we'll focus on moving our model into production and automating as much as possible. Everything before this serves as a proof-of-concept or an investigation. If the project has proved successful, then you'll work with stakeholders to determine the best way to implement models and insights. For example, you might set up an automated ETL (Extract-Transform-Load) pipelines of raw data in order to feed into a database and reformat it so that it is ready for modeling. During the deployment step, you'll actively work to determine the best course of action for getting the results of your project into the wild, and you'll often be involved with building everything needed to put the software into production.
This is one of the most rewarding steps of the entire Data Science process -- getting to see your work go live!
Knowledge Discovery in Databases, or KDD is considered the oldest Data Science process. The creation of this process is credited to Gregory Piatetsky-Shapiro, who also runs the ever-popular Data Science blog, kdnuggets.
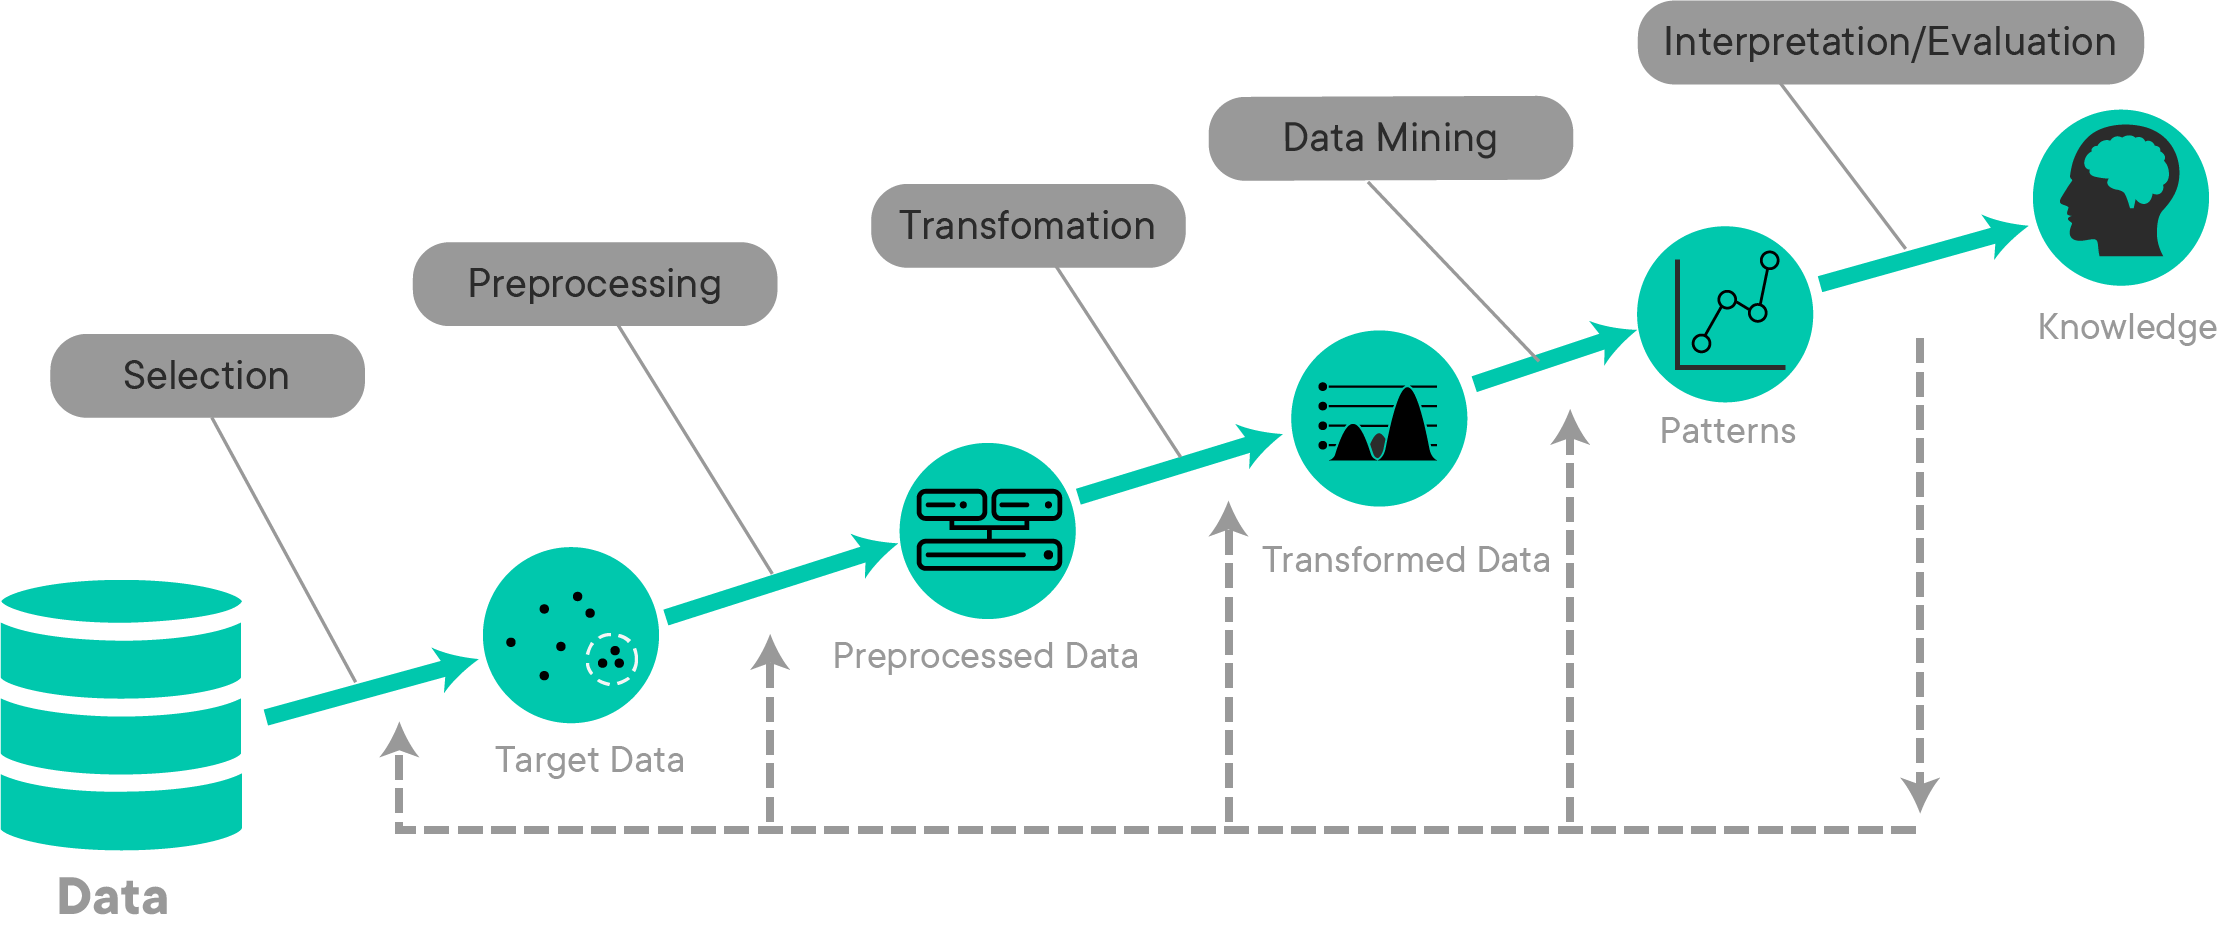
The KDD process is quite similar to the CRISP-DM process. The diagram above illustrates every step of the KDD process, as well as the expected output at each stage.
Selection:
During this stage, you'll focus on selecting your problem, and the data that will help you answer it. This stage works much like the first stage of CRISP-DM -- you begin by focusing on developing an understanding of the domain the problem resides in (e.g. marketing, finance, increasing customer sales, etc), the previous work done in this domain, and the goals of the stakeholders involved with the process.
Once you've developed a strong understanding of the goals and the domain, you'll work to establish where your data is coming from, and which data will be useful to you. Organizations and companies usually have a ton of data, and only some of it will be relevant to the problem you're trying to solve. During this stage, you'll focus on examining the data sources available to you and gathering the data that you deem useful for the project.
The output of this stage is the dataset you'll be using for the Data Science project.
Preprocessing:
The preprocessing stage is pretty straightforward -- the goal of this stage is to "clean" the data by preprocessing it. For text data, this may include things like tokenization. You'll also identify and deal with issues like outliers and/or missing data in this stage.
In practice, this stage often blurs with the Transformation stage.
The output of this stage is preprocessed data that is more "clean" than it was at the start of this stage -- although the dataset is not quite ready for modeling yet.
Transformation:
During this stage, you'll take your preprocessed data and transform it in a way that makes it more ideal for modeling. This may include steps like feature engineering and dimensionality reduction. At this stage, you'll also deal with things like checking for and removing multicollinearity from the dataset. Categorical data should also be converted to numeric format through one-hot encoding during this step.
The output of this stage is a dataset that is now ready for modeling. All null values and outliers are removed, categorical data has been converted to a format that a model can work with, and the dataset is generally ready for experimentation with modeling.
Data Mining:
The Data Mining stage refers to using different modeling techniques to try and build a model that solves the problem we're after -- often, this is a classification or regression task. During this stage, you'll also define your parameters for given models, as well as your overall criteria for measuring the performance of a model.
You may be wondering what Data Mining is, and how it relates to Data Science. In practice, it's just an older term that essentially means the same thing as Data Science. Dr. Piatetsky-Shapiro defines Data Mining as "the non-trivial extraction of implicit, previously unknown and potentially useful information from data." Making of things such as Machine Learning algorithms to find insights in large datasets that aren't immediately obvious without these algorithms is at the heart of the concept of Data Mining, just as it is in Data Science. In a pragmatic sense, this is why the terms Data Mining and Data Science are typically used interchangeably, although the term Data Mining is considered an older term that isn't used as often nowadays.
The output of this stage results from a fit to the data for the problem we're trying to solve.
Interpretation/Evaluation:
During this final stage of KDD, we focus on interpreting the "patterns" discovered in the previous step to help us make generalizations or predictions that help us answer our original question. During this stage, you'll consolidate everything you've learned to present it to stakeholders for guiding future actions. Your output may be a presentation that you use to communicate to non-technical managers or executives (never discount the importance of knowing PowerPoint as a Data Scientist!). Your conclusions for a project may range from "this approach didn't work" or "we need more data about {X}" to "this is ready for production, let's build it!".
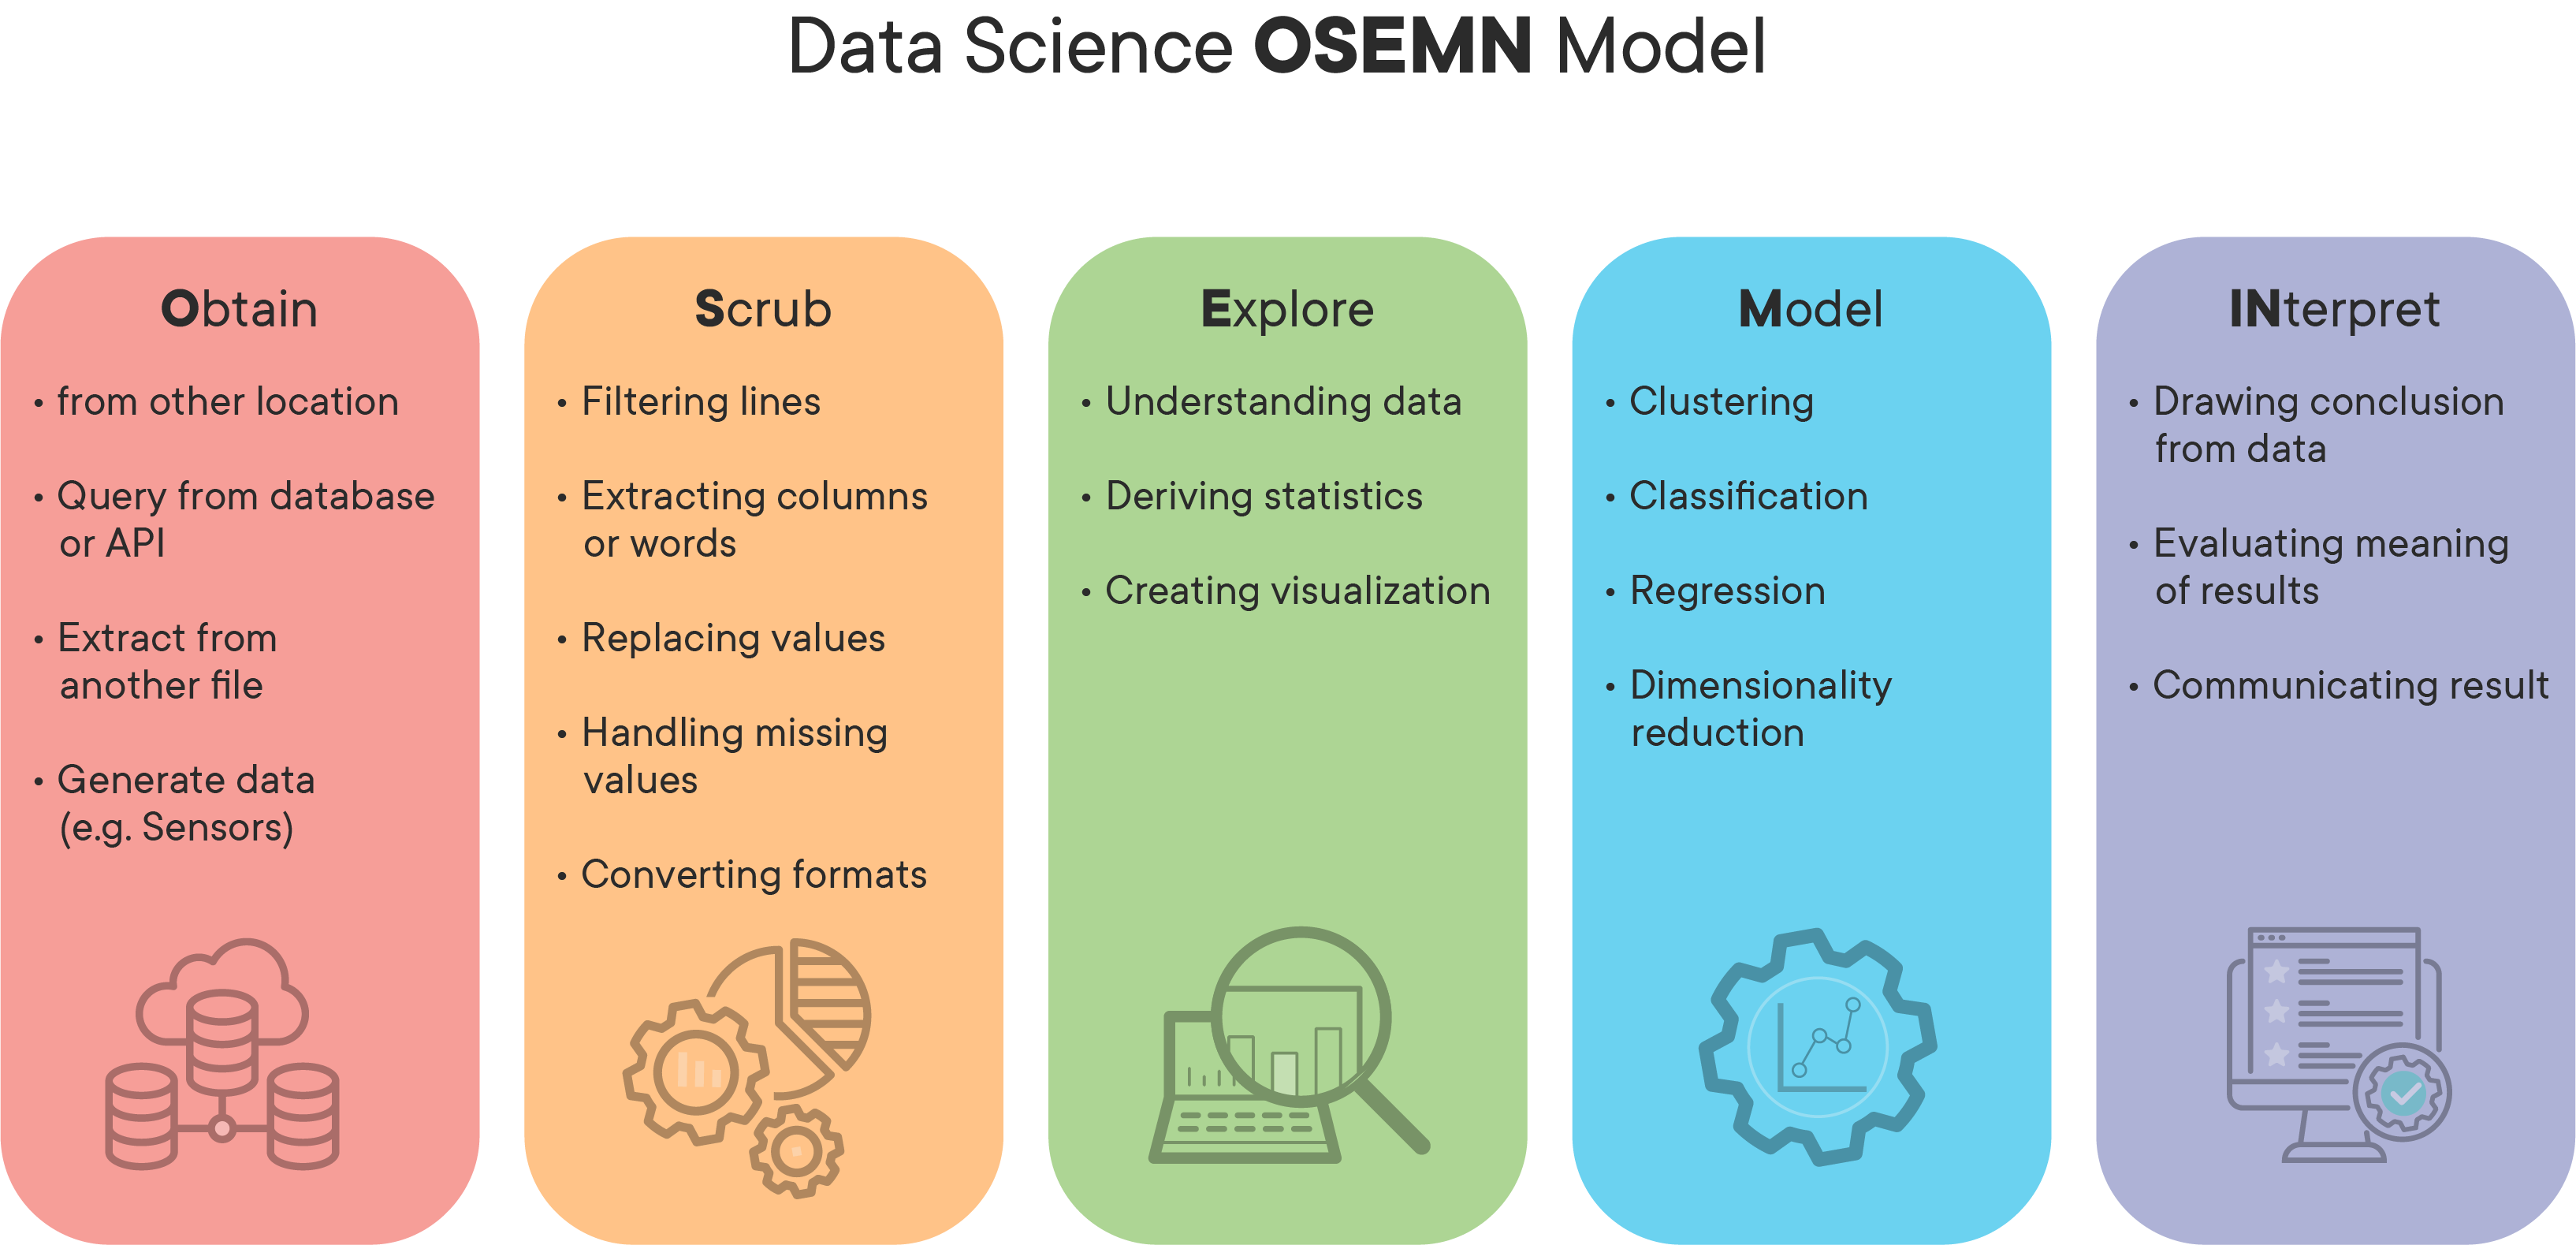
This brings us to the Data Science process we'll be using during this section -- OSEMN (sometimes referred as OSEMiN, and pronounced "OH-sum", rhymes with "possum"). This is the most straightforward of the Data Science processes discussed so far. Note that during this process, just like the others, the stages often blur together. It is completely acceptable (and often a best practice!) to float back and forth between stages as you learn new things about your problem, dataset, requirements, etc. It's quite common to get to the modeling step and realize that you need to scrub your data a bit more or engineer a different feature and jump back to the "Scrub" stage, or go all the way back to the "Obtain" stage when you realize your current data isn't sufficient to solve this problem. As with any of these frameworks, OSEMN is meant to be treated more like a set of guidelines for structuring your project than set-in-stone steps that cannot be violated.
Obtain:
As with CRISP-DM and KDD, this step involves understanding stakeholder requirements, gathering information on the problem, and finally, sourcing data that we think will be necessary for solving this problem.
Scrub:
During this stage, we'll focus on preprocessing our data. Important steps such as identifying and removing null values, dealing with outliers, normalizing data, and feature engineering/feature selection are handled around this stage. The line with this stage really blurs with the Explore stage, as it is common to only realize that certain columns require cleaning or preprocessing as a result of the visualizations and explorations done during Step 3.
Note that although technically, categorical data should be one-hot encoded during this step, in practice, it's usually done after data exploration. This is because it is much less time-consuming to visualize and explore a few columns containing categorical data than it is to explore many different dummy columns that have been one-hot encoded.
Explore:
This step focuses on getting to know the dataset you're working with. As mentioned above, this step tends to blend with the Scrub step mentioned above. During this step, you'll create visualizations to really get a feel for your dataset. You'll focus on things such as understanding the distribution of different columns, checking for multicollinearity, and other tasks like that. If your project is a classification task, you may check the balance of the different classes in your dataset. If your problem is a regression task, you may check that the dataset meets the assumptions necessary for a regression task.
At the end of this step, you should have a dataset ready for modeling that you've thoroughly explored and are extremely familiar with.
Model:
This step, as with the last two frameworks, is also pretty self-explanatory. It consists of building and tuning models using all the tools you have in your data science toolbox. In practice, this often means defining a threshold for success, selecting machine learning algorithms to test on the project, and tuning the ones that show promise to try and increase your results. As with the other stages, it is both common and accepted to realize something, jump back to a previous stage like Scrub or Explore, and make some changes to see how it affects the model.
Interpret:
During this step, you'll interpret the results of your model(s), and communicate results to stakeholders. As with the other frameworks, communication is incredibly important! During this stage, you may come to realize that further investigation is needed, or more data. That's totally fine -- figure out what's needed, go get it, and start the process over! If your results are satisfactory to all stakeholders involved, you may also go from this stage right into putting your model into production and automating processes necessary to support it.
Regardless of the quality of your results, it's very important that you be aware of the business requirements and stakeholder expectations at all times! Generally, no matter which of the above processes you use, you'll communicate your results in a two-pronged manner:
- A short, high-level presentation covering your question, process, and results meant for non-technical audiences
- A detailed Jupyter Notebook demonstrating your entire process meant for technical audiences
In general, you can see why Data Scientists love Jupyter Notebooks! It is very easy to format results in a reproducible, easy-to-understand way. Although a detailed Jupyter Notebook may seem like the more involved of the two deliverables listed above, the high-level presentation is often the hardest! Just remember -- even if the project took you/your team over a year and utilized the most cutting-edge machine learning techniques available, you still need to be able to communicate your results in about 5 slides (using graphics, not words, whenever possible!), in a 5 minute presentation in a way that someone that can't write code can still understand and be convinced by!
In this lesson, you learned about the different data science process frameworks including CRISP-DM, KDD, and OSEMN. You also learned that the data science process is iterative and that a typical data science project involves many different stakeholders who may not have a technical background. As such, it's important to recognize that data scientists must be able to communicate their findings in a non-technical way.