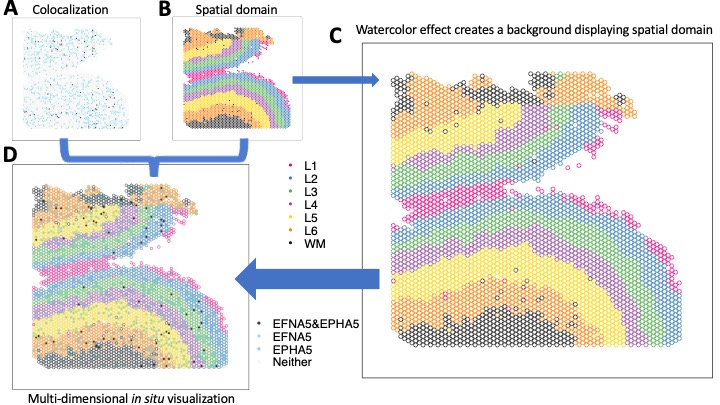
The goal of escheR is to create an unified multi-dimensional spatial visualizations for spatially-resolved transcriptomics data following Gestalt principles.
Our preprint describing the innovative visualization is available from bioRxiv.
You can install the development version of escheR from GitHub with:
# install.packages("devtools")
devtools::install_github("boyiguo1/escheR")
The authors are submitting the package to Bioconductor.
To use escheR, we assume the input data are provided as a SpatialExperiment Bioconductor object. For people whose data are stored as a Seurat object, we advise to convert to a SpatialExperiment object before applying the workflow below.
Please find an end-to-end tutorial at https://boyiguo1.github.io/escheR/
Our preprint describing escheR is available from bioRxiv:
- Guo B, Hicks SC (2023). “escheR: Unified multi-dimensional visualizations with Gestalt principles.” bioRxiv. doi:10.1101/2023.03.18.533302

