-
Develop a single pixel model of VIS-NIR & thermal observations. Calculate the at-lens radiance for each band. Inputs for this are:
- Reference solar spectrum
- Blackbody temperature
- Scene reflectance/ emissivity
- (Optional) Atmospheric transmission
-
From first-order instrument parameters, calculate optical power from scene onto pixel and signal-to-noise ratio (SNR)/ or noise-equivalent differential temperature (NEDT).
This requires first order optical, filter, and detector properties:- Focal length
- Aperture Diameter
- Pixel pitch
- Detectivity
-
Parameterize the pixel detectivity based on operational / environmental parameters (e.g. integration time, temperature).
Also, include a first-order contribution for lens and filter thermal emission (bb curve * residual coating emissivity), which will drive calibrations.
Generate SNR/ NEDT over range of detector parameters. -
Run sensitivity studies based on scene model parameters, as well as system conditions of (3).
Blackbody radiance calculations complete with dimensional analysis (using Pint) are being developed in the HYTRAN module.
In the meantime, an end-to-end SNR modeling prototype will be developed using a combination of validated pyspectral radiance functions and HYTRAN instrument models. (More on the complete planned HYTRAN capability later.)
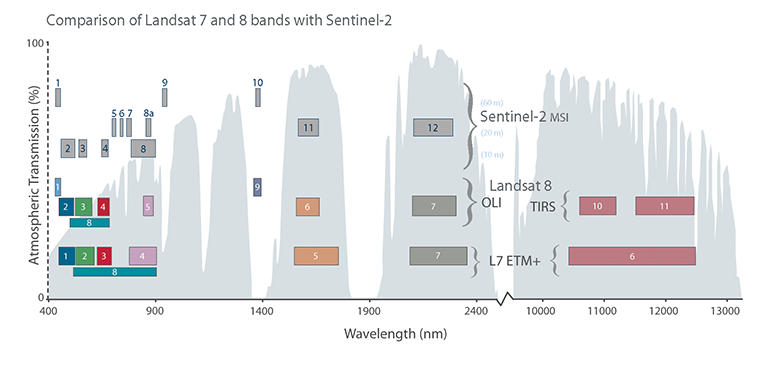
The below image is a great high-level example of what we're after. This is a visual comparison of the Landsat 7 & 8 vs. the Sentinel-2 bands vs. wavelength, superposed on a standard atmospheric transmission spectrum.
Atmospheric spectra will be a part of our model, but we will go one step further and dynamically model the signal of interest over the visible, NIR/SWIR bands dominated by solar reflectance as well as the thermal signal of longer wavelengths.
Dash app specific functions:
- Pick a reference spectrum from a dropdown
- Set a ground temperature
- Select a reference atmosphere, once we have data
- Pick an instrument band selection for display, as in above plot
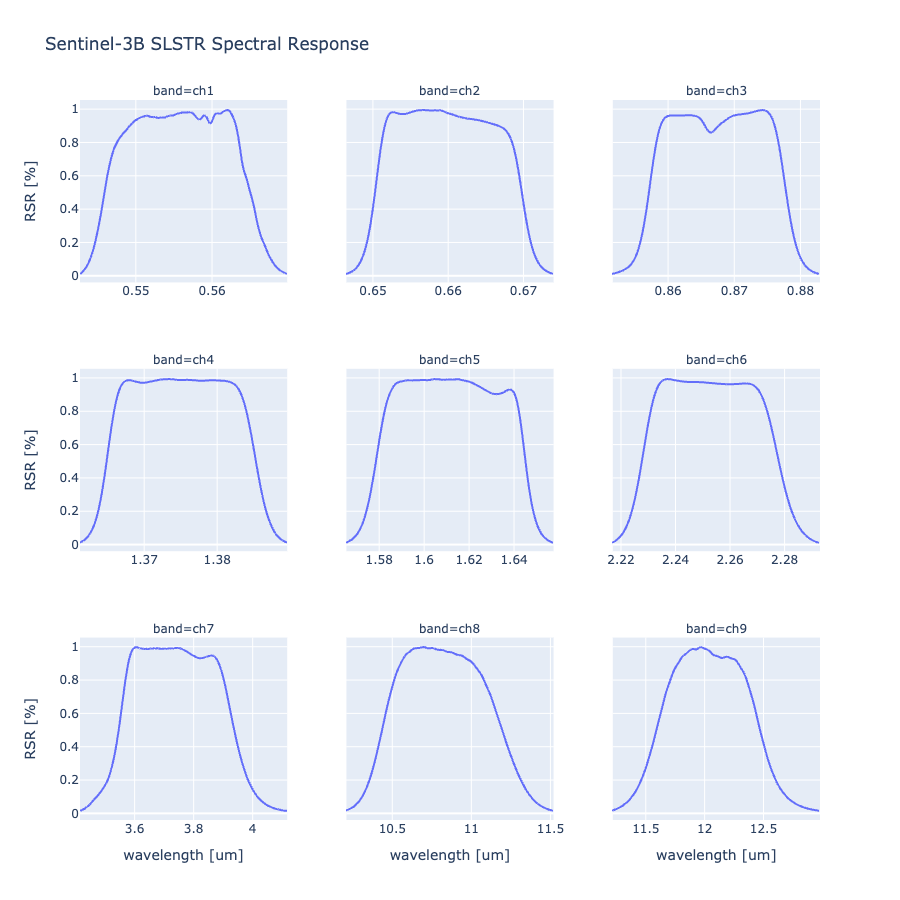
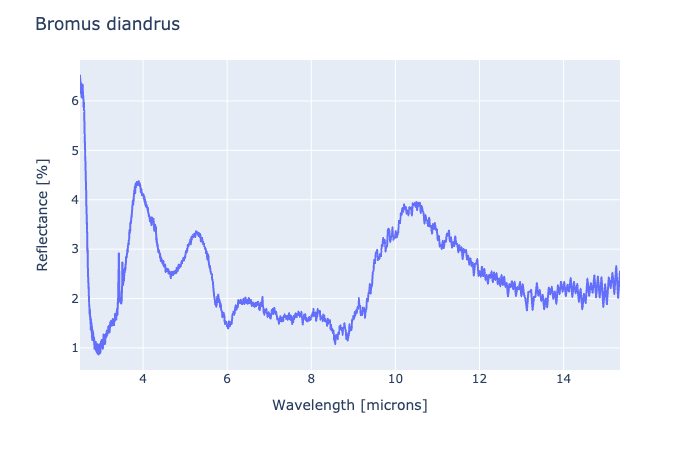
All of the data for this phase can be conveniently held on the same x-axis of wavelength (we'll use microns). The bands for e.g. Landsat (except TIRS) & Sentinel-3 are already available through Pyspectral. ECOSTRESS/ ASTER reference spectra are available through SPy. See spy_basics.ipynb for simple interface setup, or NEDT_calcs.ipynb for a more complete treatment with HYTRAN.
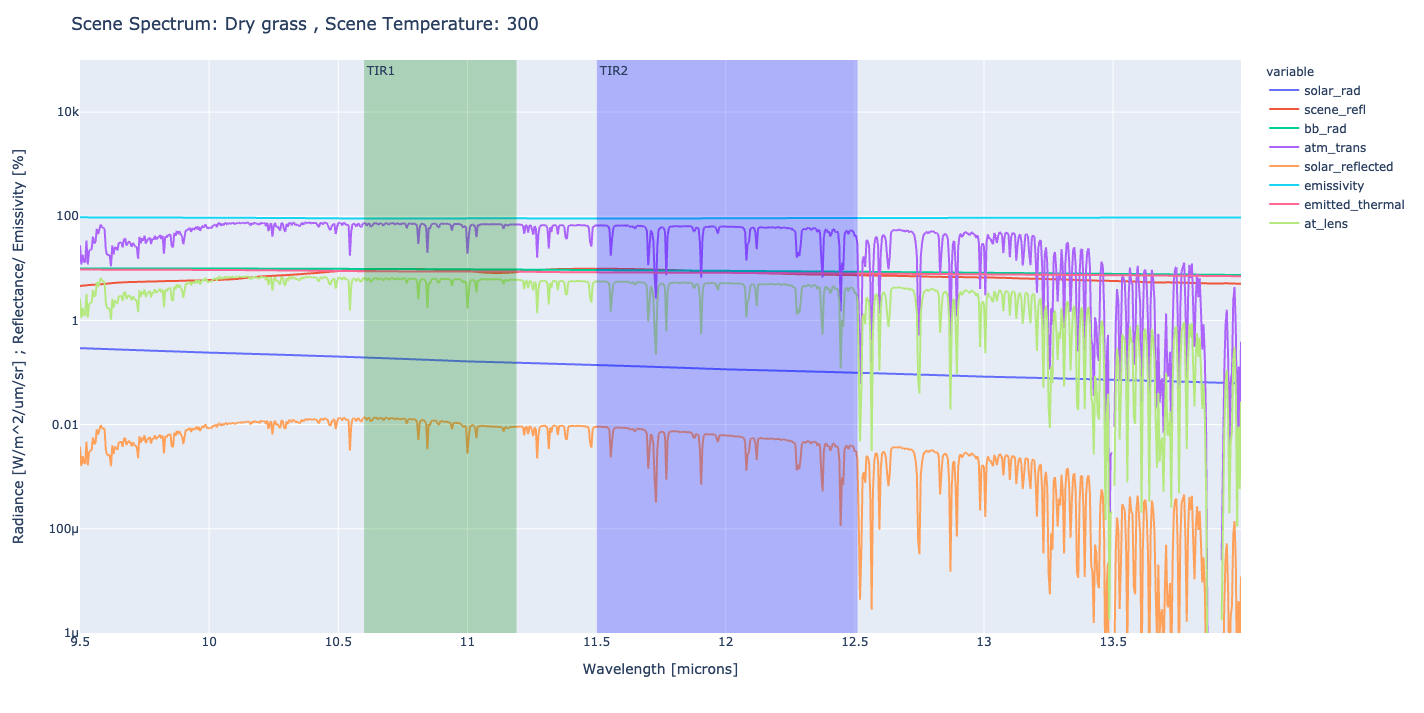
The script spy_scene.py is a much simpler reworking of the above studies, to enable quick development of a Dash application along the same lines. It outputs six total curves based on user-selected temperature, wavelength domain, and a reference reflecatance spectra. (Uses the standard TOA for solar and currently no atmosphere.)
Below is a plot of what spy_scene.py currently produces. Everything is all mashed up in one dataframe/ plot which needs some cleaning up!
In-house python module for scene and instrument configuration to run performance modeling. Will support the inclusion of various spectral and atmospheric data once interfaces are defined.
A helpful if basic package that has similar goals for scene modeling as HYTRAN, plus some spectral response curves of various Earth observing instruments. Currently used features:
- Spectral Response Functions
Seespy_basics.ipynbfor a test case with Sentinel-3 bands.
Containes ECOSTRESS spectra interface, basic set of hyperspectral imaging algorithms.
- https://www.spectralpython.net/libraries.html#ecostress-spectral-library
Seespy_basics.ipynbfor a test case of a spectrum lookup. Need a good user interface for Dash app.


