Lainey Reed ekr42@cornell.edu
The R code in this repository is based off of the package phenopix, which is designed to work with a mounted camera to calculate various vegetation indices over a large photoset. Instead of a mounted camera, the two functions in the script titled "extractVIs7.R" work with a photoset where the vantage changes often, allowing the user of the code to draw a number of regions in each photo and identify the plants within them.
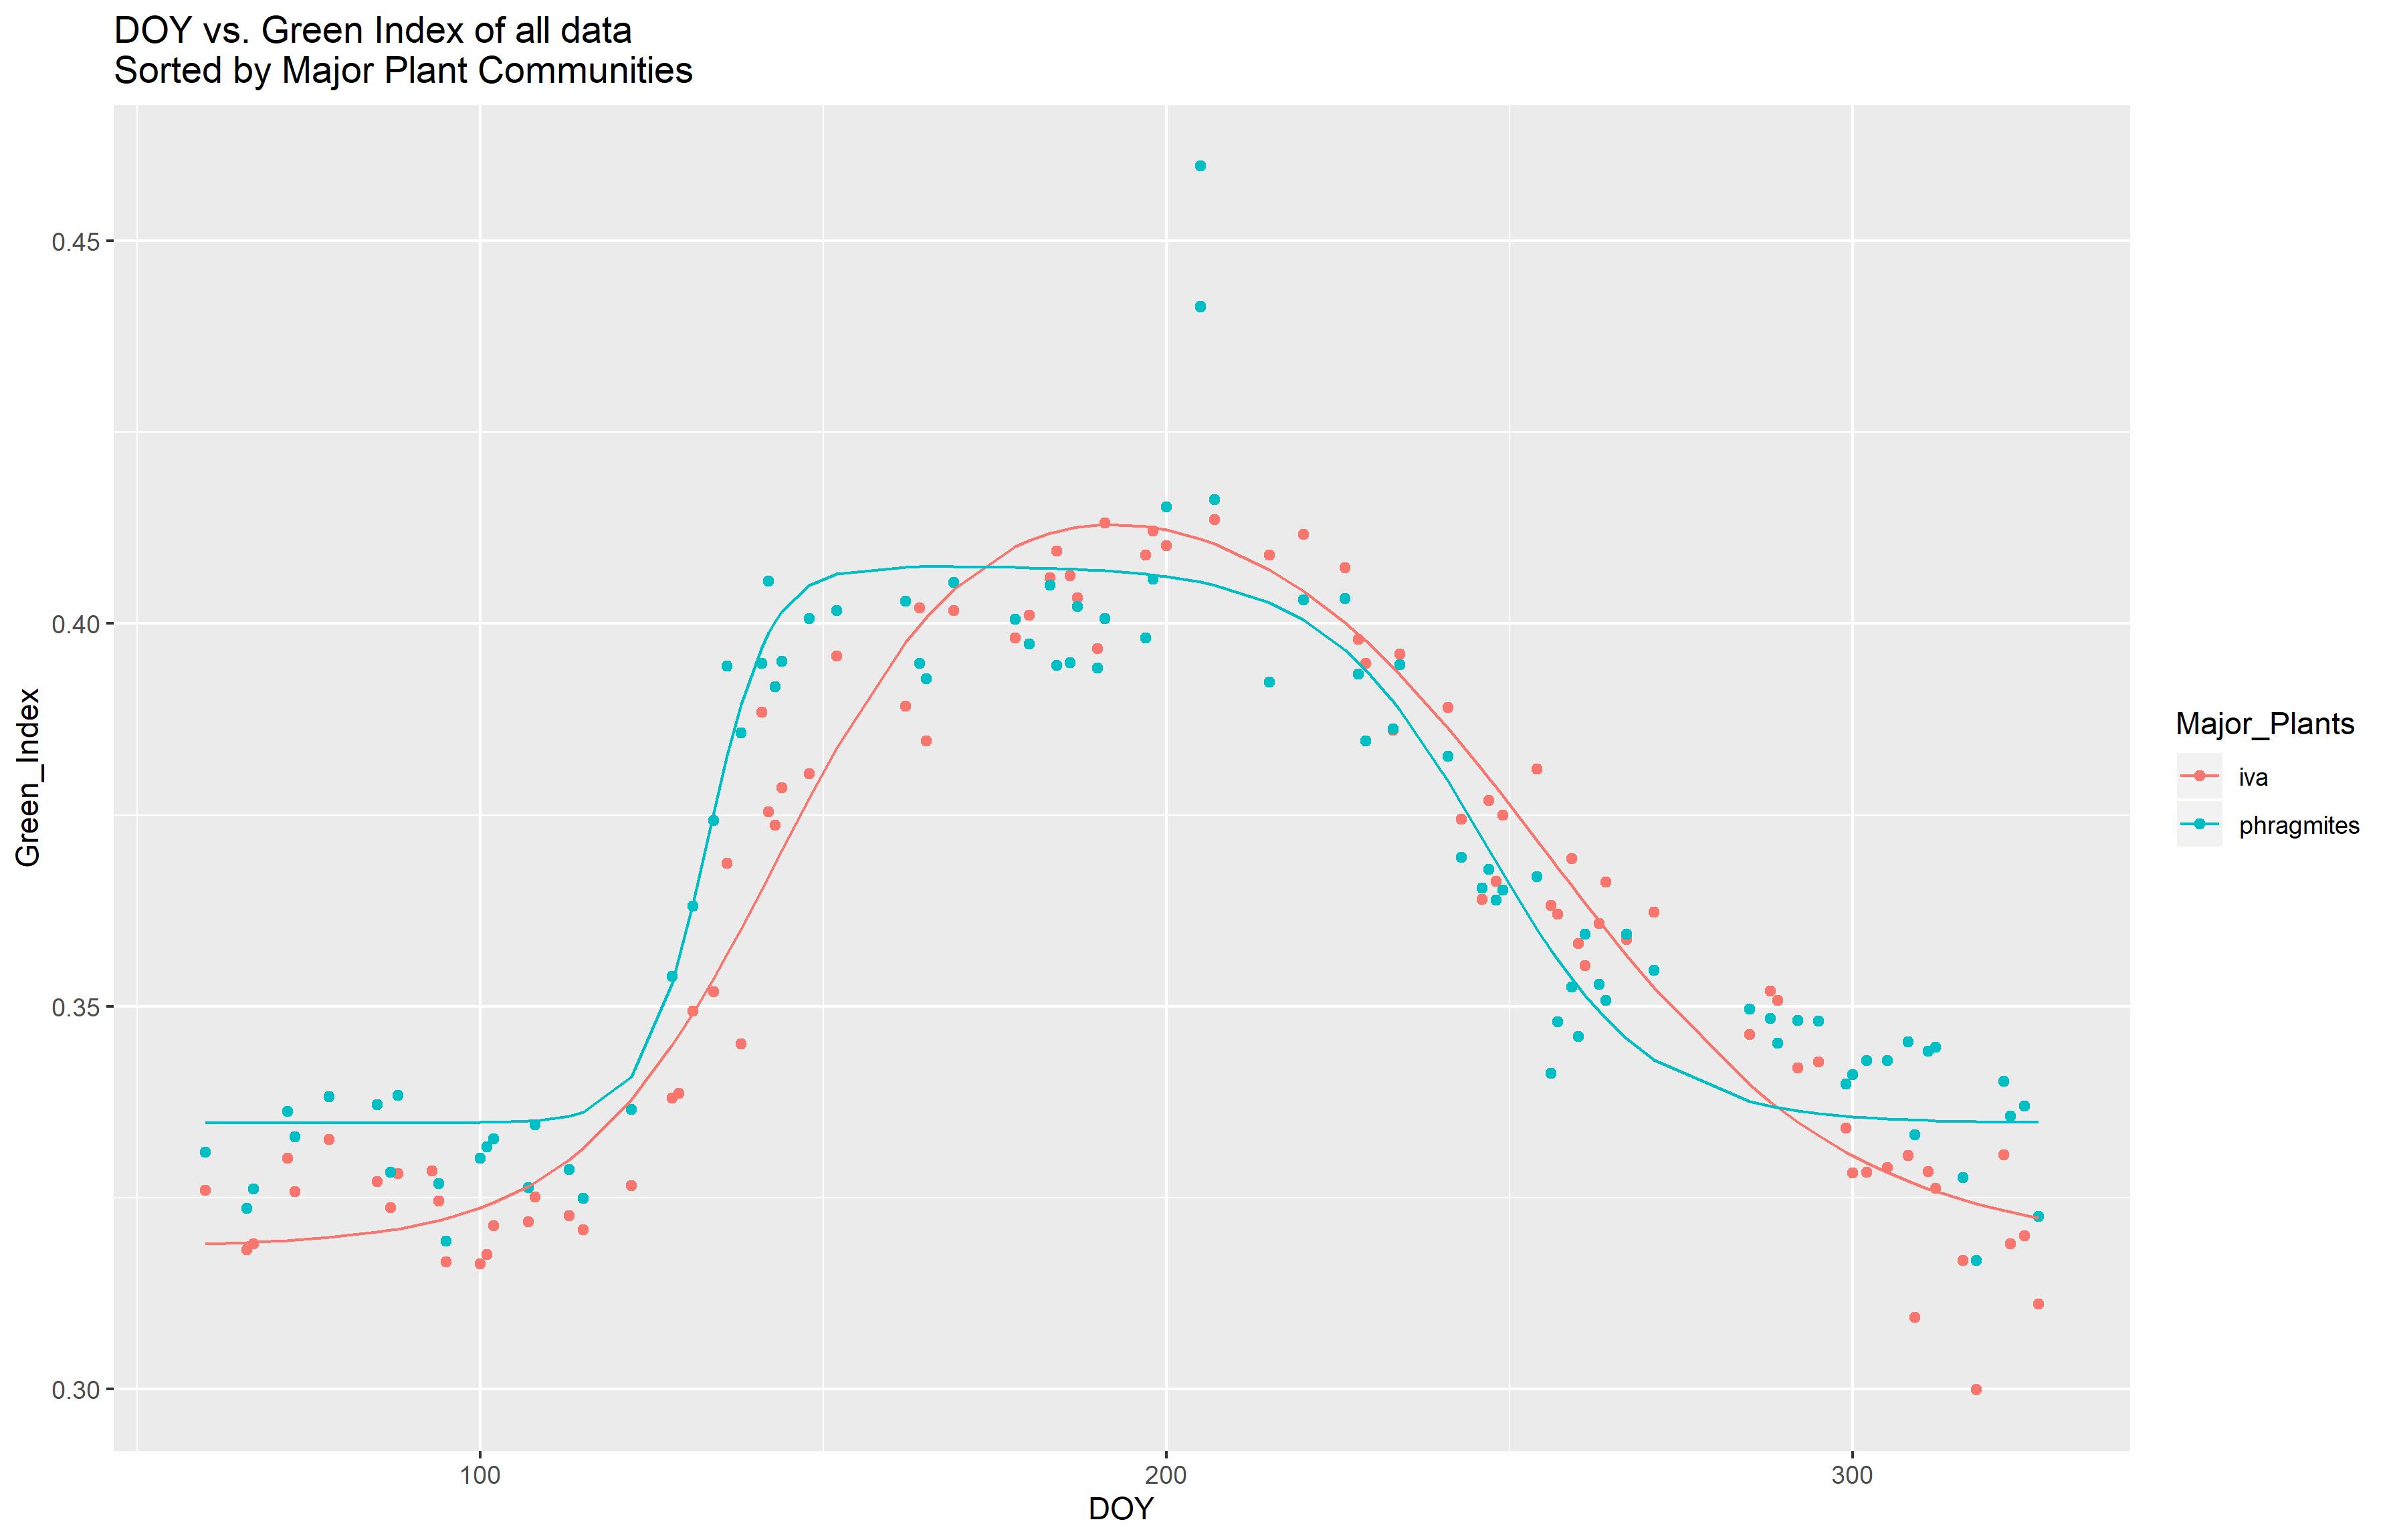
Using these two functions, I was able to fit the Green Index data to multiple curves, sorted by plant group, with a set of photos taken in the Smithonsian Environmetnal Research Center's Global Change Research Wetland (GCREW) (All photos obtained from the @GCREW Facebook page). The data could be useful for determining key phenological transitions from an exisitng photo set, and could be used to compare seasonal phenology between years. I hope to come back at the end of this year and run the code with the photos from the remainder of 2019 and compare between the two years.
Contained within this repository is the full set of visual index data which was run with 650 images from the GCREW facebook page, as well as a subset of that data with the corresponding images, regions of interest (ROIs) and figures for the fitted data to use as an example.
Fit curves with subset of data
The ideal dataset for this project is one with an inconsistent vantage point and with a large amount of photos over the entire year. For this model to work, there need to be photos of dead plants at the beginning and end of the growing season, and throughout the length of the green up and green down.
Photos should be named in the following format: "vantage.name_MM_DD_YY_HHMM.jpg" and all be in the located in the folder "Pics". This naming format takes advantage of the phenopix packages "extractDateFilename" function which will pull the date from the file.
The program will save generated visual index data into the VIs folder, ROIs will be saved in the ROI folder (as rdata, csvs, and as photos, a future edit will try to make this somewhat more efficient).
There are two main scripts contained within this repository. All are designed to work with R.
phenopix raster jpeg SDMTools data.table nls.multstart nlstools tidyverse broom lubridate
This script contains two edited functions from the phenopix package and allows the user to identify regions and plants within them, and then extracts visual data from the regions. The main body of the program runs through a loop which calls the two functions to go with each photo in the photoset. The final output is a csv file called "VI_data.csv" that is saved to the VIs folder and should be used in the second script. There is a subset of data, with photos, ROI data, and VI data, included with this repository.
This is the first of the two functions. It takes the picture, asks the user how many regions they want to draw, and then loops allowing the user to draw the specified number of regions and identify the major and minor plants within them. Then it saves a photo of the region and a csv and r file containing the coordinates.
Note: the major and minor plants are somewhat arbitrarily defined in this project. I defined major plants as plants having significant cover within a region, while minor plants show up in the region without having significant cover. The model only fits curves to major plants. The regions within photos should be large as possible for accuracy, but also ideally should contain only one plant, for the sake of reducing noise. In the case of the GCREW plants, often the c4 grass was mixed with other plants, and that is why I had to include the possiblity of including multiple plants within a region.
The second function takes the region and extracts VIs from it automatically.
This script takes the VI data from the previously saved "VI_data.csv" and is able to fit a non linear double logistic curve to the data. The shape of the curve was taken from Forbrich et. al 2018. The code fits curves separated by years and plant groups. All plots are saved as pdfs to the folder "Figures."
Forbrich, I., Giblin, A. E., & Hopkinson, C. S. (2018). Constraining marsh carbon budgets using long‐term C burial and contemporary atmospheric CO2 fluxes. Journal of Geophysical Research: Biogeosciences, 123(3), 867-878.
Phenopix package for R: https://CRAN.R-project.org/package=phenopix