Reading music notes from its image to detect the symbols and notes
- Earlier , "example.jpg" file was not present in the same directory so , we have placed all the input images and example.jpg in the same directory.
- Earlier , only template1 ,template2 were used due to a minor bug in the for loop ,increased the changes to consider all the templates.
- Previously we have submitted our code just 5-7 minutes late if we recollect it correctly and we were penalized of about 10 % for that becuase the date of commit is mentioned as feb24th .Please do consider the minute delay .
- 'omr.py' script is in 'src' folder
- One has to manually set the flag in line 496 in omr.py file to True in main function to generate results for both hammingscore and eucledian score functions.
- Initially you can start with setting flag to False and test only for Hamming score . Apart from images this mode will result in one file "detection.txt".
- If you want to compare the results, you have to set the flag to True. This would take really long time to compute and would result in two files - detection.txt file based on hamming scores and detection1.txt file based on eucledian score.
- One should ensure all the template files are in the same directory as python script and should follow the similar naming convention i.e. template1.png, template2.png etc since we have hardcoded the template image file names and should also ensure example.png file in the same directory and also all the test input images in the same directory to ensure correctness.
- Function Convolution2d convoles an image with a 2D kernel
- Reflective padding is done on the borders of the image
- As a part of convolution process, kernel is vertically and horizontally flipped to implement it as a correlation process
- Function ConvolutionSeperable convolves an image with a 2D kernel which is separable into an outer product of two 1D vectors
- This function takes an image, one vertical vector and a horizontal vector
- In this function also, reflective padding is done
-
Function scoringHamming considers binary image . the template and its corrsponding MxN region over the image and then computess the hamming distance score for the region . We have simiplified the expression with some math .We have used the following formula for computing the hamming distances .
F(i,j) = 2* Image o Template + ( 1*(MxN) - Sum(Corres. Region in Image) - Sum(Template pixels) )
-
We have performing the convolution operation (Image o Template ) using the inbuilt function from numpy to increase the performance even though we have implemented the convolution operation ourselves in the thrid function .
-
Once we have computed the scores , the function detectBoundaries is used for detecting the most likely symbols by scanning the image and computes the score for each region which is of size of the template and then we are filtering out regions based on threshold and drawing the regions on the image .
-
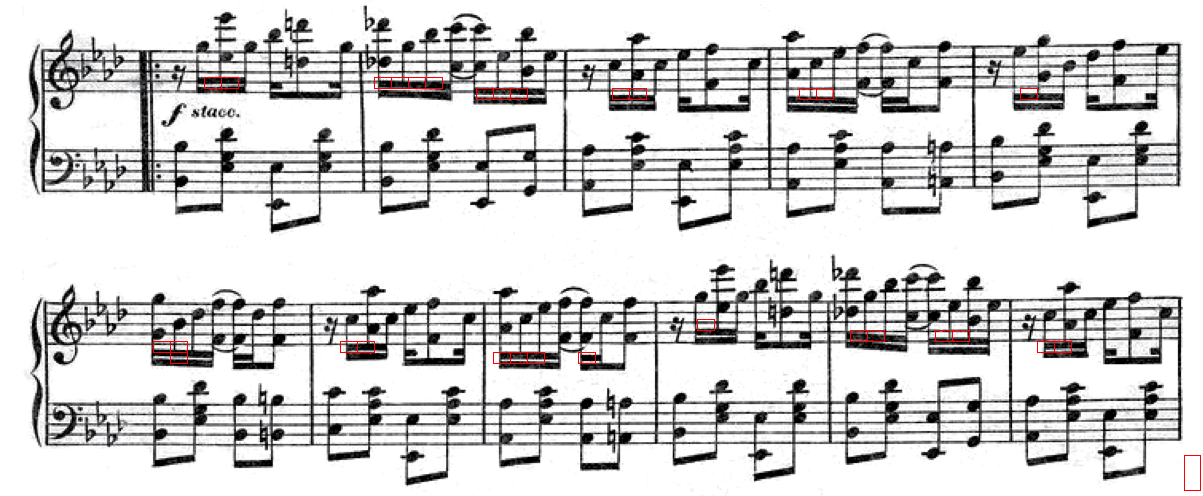
Usually the thresold is set by finding the region with maximum score and discarding the regions with values less than Maximum Score * Alpha , where alpha can have values ranging from 0.35-0.85 and we have obtained quite different results for various combinations of templates and thresholds .Values between 0.65-0.75 yielded good results . Some of the regions drawn might miss capturing the complete template / region because while scanning the regions for computing its respective score we are shifting the regions by the corresponding template size, so a part of the symbol might be outside .In order to overcome this problem we also tried to shift th region pixel by pixel but one of the main challenges is this results in too many regions with almost similar score near the target symbol because the single pixel shift does not change the score enough to help us clearly determine the exact region . So , probably a better approach would be somewhere in the middle , try to fix the region size , but it has its own downsized affects , another better approach is find the highest score among all the regions within a certain range/cluster .
-
Results were satisfactory for filled-notes , but weren't great for eighth_rest and quarter_rest .We also did not use the function classifySymbols for our final results as we need to stiff figure out some issues , so we have used a default value to classify the symbols.
- Function scoringFunction is an alternate approach for scoring the regions for corresponding template , where we have pre computed D and then computed values for each pixel .Even though the number of loops reduced from 6 to 4 , it is taking usually much longer to compute D due to its very high time complexity .So, even though we have defined this functionality we are not using it for image pipeline .
In Hough Transform, all the points in the Accumulator matrix are increased by a fixed number (INC) if their corresponding shape in image space contains the point/line that is in consideration. After this, the points with the maximum number of votes in the Accumulator matrix are taken as our points of interest, which might represent the shape we are looking for in the image space. This is what we implemented.
- What we are trying to detect?
A set of five parallel, straight, horizontal, equidistant lines.
- How can it be represented by only two parameters?
By taking the first line's y-coordinate (r) and the spacing between the lines as the two parameters (s), we can represent the set of lines (Staff). We will set the Accumulator array’s dimensions to represent these two dimensions. We will need all the rows as possibilities but we can only take a few possible space parameters from intuition (as space between Staffs is generally between 5 to 20 pixels, though we can give us enough room by taking 1 to 40).
- When do we modify the Accumulator array?
We are doing this when we encounter a long, straight, horizontal line in the image (which is present in row y). We can detect this using the horizontal edge map.
- How do we modify the Accumulator array?
We consider each of the long, straight, horizontal line that we have detected to belong to five possible cases.
These cases are:
Case-1: This line is the first line of the Staff.
Case-2: This line is the second line of the Staff.
Case-3: This line is the third line of the Staff.
Case-4: This line is the fourth line of the Staff.
Case-5: This line is the fifth line of the Staff.
The equation in (r, s) that represents these possibilities is: r = (1-s/b)*y
Value of b for different cases:
Case-1: b = infinity
Case-2: b = y
Case-3: b = y/2
Case-4: b = y/3
Case-5: b = y/4
We will increment all the cells in the Accumulator array by INC, whose co-ordinates are close to any (r, s) that satisfy any of the five cases mentioned above. This is done for all the lines we have detected in the previous step.
- How do we get the prediction?
We take all the co-ordinates of the maximum values in the Accumulator array. From these co-ordinates we can get the spacing between the lines accurately with a higher confidence interval.
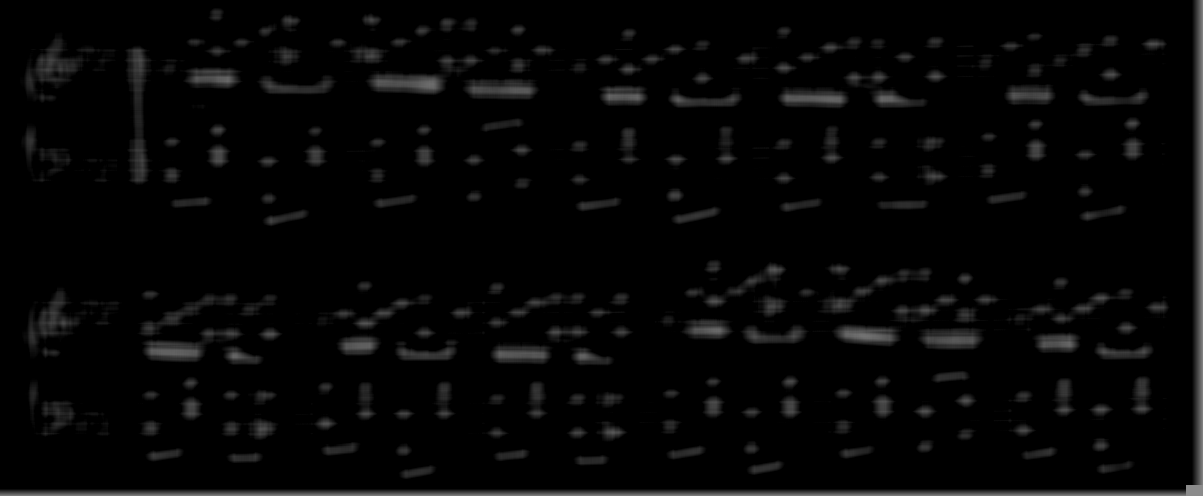
This is what the Hough space will look like (e.g. for music1.png).
The brightest spots are our predictions.
- What do we do with this prediction?
Using this spacing, we can calculate the scaling factor (scale) by dividing the note head template’s height with our predicted space. We can use this scaling factor to resize our note head template accordingly to get better results while detecting the notes.
- What are the assumptions made?
We assume that the input to this function is a binary horizontal edge map that has edges’ value as 1 and 0 otherwise and that there is only one row of pixels for any horizontal edge. We also assume that Staffs in the image are perfectly horizontal and cover most of the width of the image.
- What is the accuracy of this function?
This function works perfectly when all the assumptions are met (We tested this out by giving synthetic/custom input). For the given input images we had trouble preparing an ideal input image for this function. We were sometimes getting multiple edges for a Staff line and in some other input images few other assumptions were also not being met. We got a correct scaling factor for music1 and music2.
- How can this be improved?
We can work to get an ideal binary horizontal edge map as input (part 1)and also consider different techniques for cases when the staff lines might not cover a majority of the width of the image (part 2) or when they are not perfectly horizontal (part 3). We can consider using a Canny edge detector for the part 1. We can consider taking parts of the rows of the image instead of the entire row to over come the parts 2 and 3.
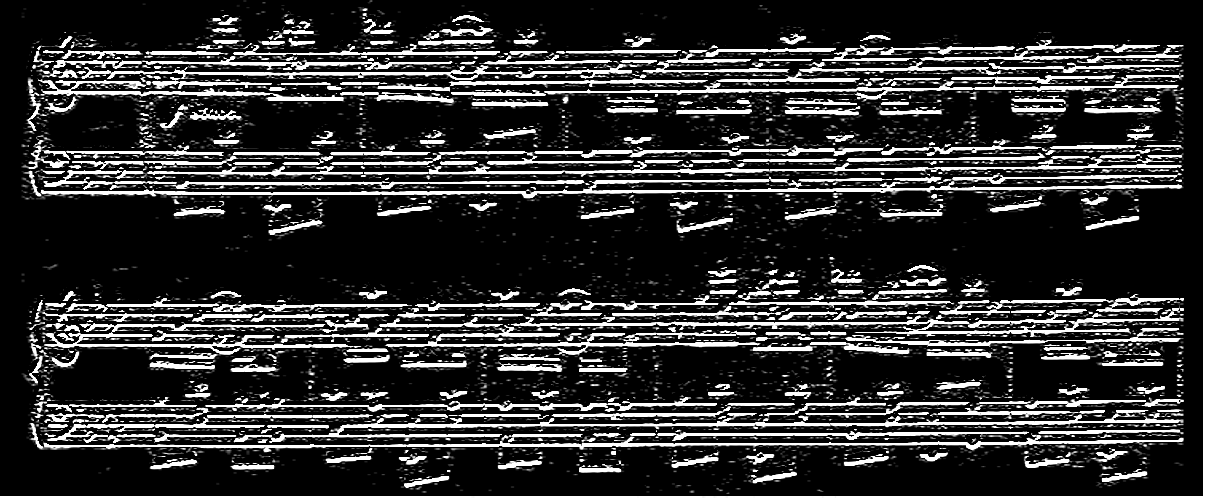
- Function imagePipeline is used for running the whole process of OMR , where we first load the image , converting the images to greysclae images , we generate sobel vectors and convolve with the images and generate Dx, and Dy ,which are edge maps , but we are using Dy edgemap for performing houghTransforms because we are trying to detect the horizontal edges.Once we obtain the scaling factor, we scale the template accordingly and then compute either hamming distance scores or compute scores based on eculedian distances and then identify the regions which have higher scores for the corresponding templates and then draw boundaries for corresponding regions and tag the corresponding symbol based on the template used to detect .We perform this operation for all the templates and draw all possible regions on the image and save it.As mentioned earlier we can use only hammingdistance function score or we can use both hammingdistance function and score function to compute sepearte scores and generate seperate regions and finally seperate images for each function.


