MeasureStartup.exe <path_to_exe> <args_to_exe> <iterations> <delay_in_secs>
A small utility that can measure the startup time of a UI .NET application by sending events of the form *PaintDotnetTrace. It launches the given application and launches it iterations times. It closes the application after delay_in_secs seconds before launching the next time. As soon as it launches the application, it emits the PaintDotnetTrace/AppLaunched event. This event can then be correlated to the corresponding AppStarted event (details below) that will be emitted by the application itself. AppStarted - AppLaunched should give approxiamate duration to start the application, including but not limited to assembly loading and JITting the methods.
The application that needs to be profiled will also need to add below code of EventSource and then the respective methods should be called from corresponding places to log the event.
using System;
using System.Diagnostics.Tracing;

namespace PaintDotNet.PaintDotnetEvents;

[EventSource(Name = "PaintDotnetTrace")]
public sealed class AppEventSource : EventSource
{
#pragma warning disable CA2211 // Non-constant fields should not be visible
    public static AppEventSource Log = new AppEventSource();
    private static bool firstIdleLogged = false;
#pragma warning restore CA2211 // Non-constant fields should not be visible

    // The numbers passed to WriteEvent and EventAttribute
    // must increment with each logging method.
    [Event(2)]
    public void AppStarted() { WriteEvent(2, ""); }

    [Event(3)]
    public void AppReady() { WriteEvent(3, ""); }

    [Event(4)]
    public void AppIdle()
    {
        if (firstIdleLogged)
        {
            return;
        }
        WriteEvent(4, "");
        firstIdleLogged = true;
    }
}You need to have PerfView installed. There might be other ways to measure it, but I haven't explored them.
Execute the following command:
path\to\perfview -KernelEvents:Process -OnlyProviders:*PaintDotnetTrace collect outputfile.etl
This command will have perfview listen to the PaintDotnetTrace events only. Next, launch the app multiple times using MeasureStartup.
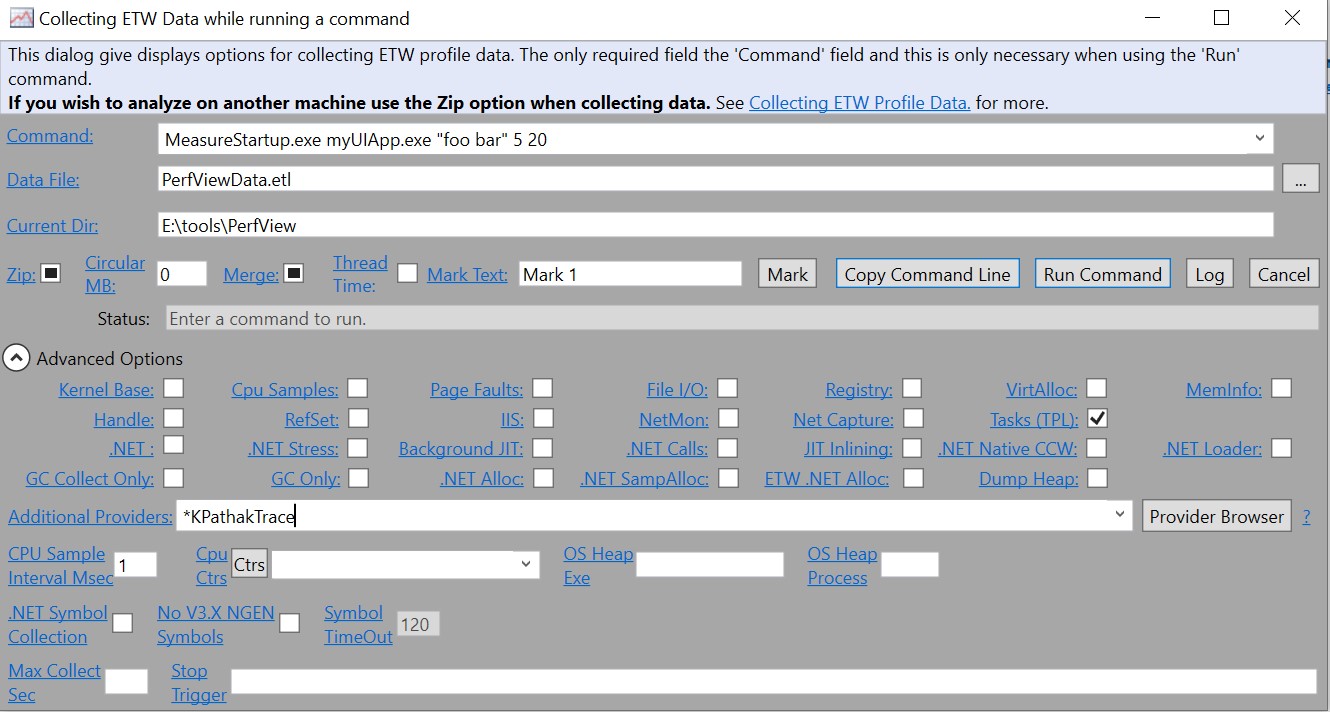
Alternatively, MeasureStartup can directly be launched from PerfView, using "Collect -> Run" menu as shown below:
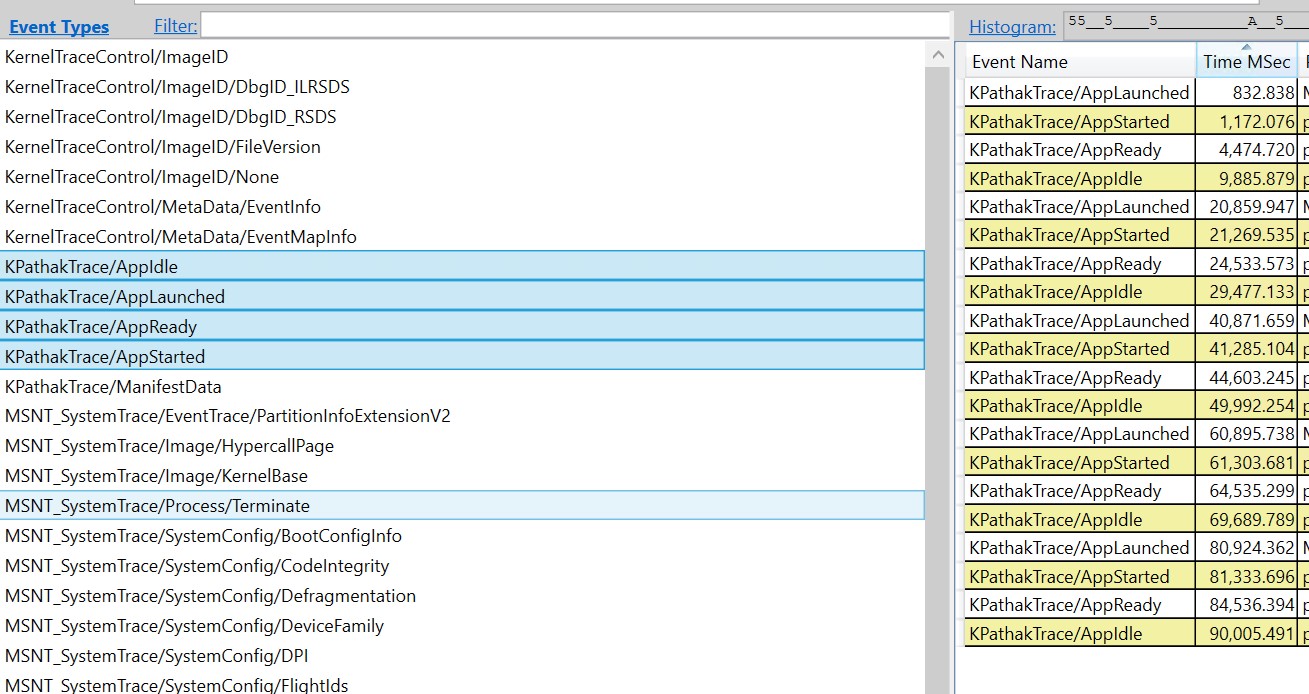
In perfview, open the .etl file "Events" section and you should see events like below:

