#Growing Neural Gas in R
Note: Growing-Neural-Gas is now part of gmum.R package and this repository is no longer active.
Easy to install and use package for fast online GNG algorithm.
This package contains fast C++ implementation of online clustering algorithm Growing Neural Gas wrapped as R package using Rcpp. It produces topological graph, that you can easily convert to igraph, or save to efficient binary file.
This algorithms is widely used for dynamic clustering problem. Package is designed with focus on big datasets. It is already possible to cluster dataset without making its copy, with different dataset types (bagging, sequential or probability sampling). In the near future it will be possible to stream dataset from csv file.
Comparison of performance of original implementation and with improvements suggested by D. Fiser, J. Faigl, M. Kulich
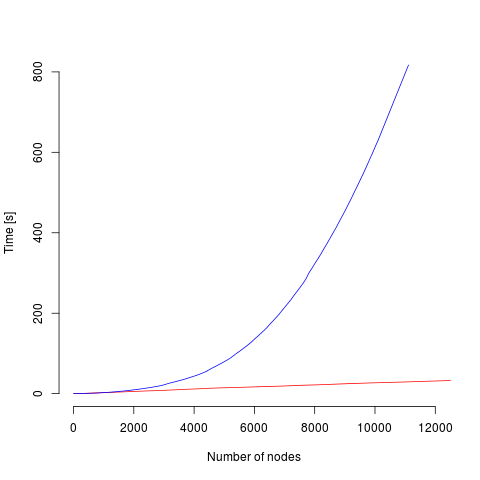
Daniel Fiser, Jan Faigl, Miroslav Kulich optimization paper Growing neural gas efficiently
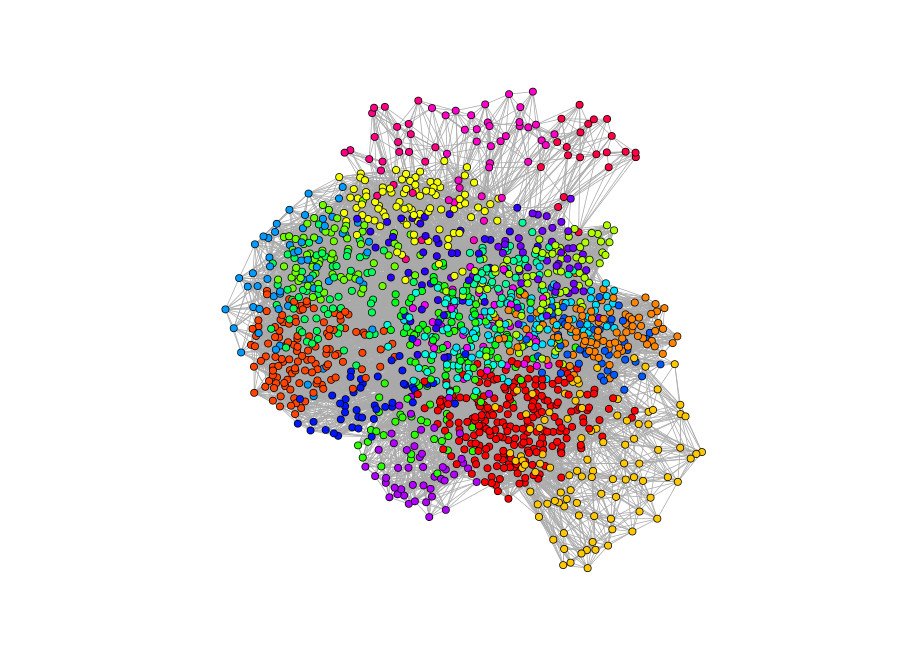
MNIST dataset clustering (raw images)
You can install it as an R package, it is easiest to do it using devtools.
devtools::install_github("kudkudak/Growing-Neural-Gas")For more details (Windows installation) see src/README.md
##Usage
For more detailed usage see code in demo folder, or in tests/testthat folder. You can also refer to R package documentation (pdf version gng.pdf).
Clustering of the UCI wine dataset

In this example we will construct a clustering of UCI wine dataset using offline GNG.
library(GrowingNeuralGas)

# Load data
data(wine, package="rattle")
scaled_wine <- scale(wine[-1])

# Train in an offline manner
gng <- GNG(scaled_wine, labels=wine$Type, max.nodes=20)

# Find closest node to vector [1,...,1]
vct = rep(1, 13)
predict(gng, vct)

# Convert to igraph and print mean degree of the network
ig = convertToGraph(gng)
mean(degree(ig))

# Find mean error
meanError(gng)

# Plot with first 2 coordinates as position
plot(gng, mode=gng.plot.2d.errors, vertex.color=gng.plot.color.cluster,
     layout=gng.plot.layout.igraph.fruchterman)
##List of functions
This is not a full documentation. Please refer to R package documentation (pdf version gng.pdf ).
-
GNG(...) - constructor for GNG object. Parameters:
-
beta - Decrease the error variables of all node nodes by this fraction. Forgetting rate. Default 0.99
-
alpha - Alpha coefficient. Decrease the error variables of the nodes neighboring to the newly inserted node by this fraction. Default 0.5
-
lambda - how often to add new vertices. Default is 200
-
max.node - Maximum number of nodes (after reaching this size it will continue running, but won't add new nodes)
-
eps.n - Default 0.05
-
eps.v - Default 0.0006
-
max.edge.age - Maximum age of edge, after which it is deleted. Decrease if your graph is not following changes of the dataset.
-
k - Utility parameter. Defaults to NULL. Controls speed of removal of obsolete nodes, a common value is 1.3.
-
-
OptimizedGNG(...) - constructor for simplified and optimized (linear) GNG object. Parameters:
-
beta - Decrease the error variables of all node nodes by this fraction. Forgetting rate. Default 0.99
-
alpha - Alpha coefficient. Decrease the error variables of the nodes neighboring to the newly inserted node by this fraction. Default 0.5
-
lambda - how often to add new vertices. Default is 200
-
max.node - Maximum number of nodes (after reaching this size it will continue running, but won't add new nodes)
-
eps.n - Default 0.05
-
eps.v - Default 0.0006
-
max.edge.age - Maximum age of edge, after which it is deleted. Decrease if your graph is not following changes of the dataset.
-
value.range - Defaults to c(0,1). All example features have to be in this range.
-
-
run(gng), pause(gng), terminate(gng) - execution control
-
node(gng, gng_index) - returns node given index
-
save(gng, filename) - save gng
-
meanError(gng) - mean error in the graph
-
numberNodes(gng) - returns number of nodes
-
errorStatistics(gng) - vector of errors every second
-
plot(gng, mode, layout, vertex.color start_s) - plots gng using one of the presets (gng.plot.rgl3d, gng.plot.2d, gng.plot.2derrors). If plotting erros you can specify second from it will plot the errors.
-
centroids(gng) - using igraph algorithm GNG will write centroids of found clusters (community centers)
-
convertToGraph(gng) - converts GNG to igraph
-
predict(gng, x) - return gng_index of the closest node in the graph to given example
-
insertExamples(gng, M) - inefficient adding examples to the graph
Feel free to contribute to the code. Contributions should be posted as pull requests. For testing please refer to tests folder.