Prometheus Exporter for KubeArmor
Prometheus Exporter calculates various metrics based on alerts generated by KubeArmor and provides the metrics to Prometheus.
Exporter Deployment
Here, you can simply deploy the Prometheus exporter.
$ cd kubearmor-prometheus-exporter/deployments
~/kubearmor-prometheus-exporter/deployments$ kubectl apply -n [target namespace] -f exporter-deployment.yaml
Prometheus Deployment (with Grafana)
If you do not have a Prometheus setup, you can quickly set up the Prometheus with Grafana.
$ cd kubearmor-prometheus-exporter/deployments/prometheus
.../deployments/prometheus$ kubectl create namespace kubearmor
.../deployments/prometheus$ kubectl apply -f prometheus-grafana-deployment.yaml
The prometheus-grafana-deployment.yaml is highly inspired from the Cilium's example deployment of Prometheus and Grafana (https://.../cilium/cilium/.../examples/kubernetes/.../prometheus/monitoring-example.yaml).
- Grafana: A visualization dashboard with Cilium Dashboard pre-loaded.
- Prometheus: a time series database and monitoring system.
Prometheus Access
Expose the port on your local machine
kubectl -n kubearmor port-forward service/prometheus --address 0.0.0.0 --address :: 9091:9090
Grafana Access
Expose the port on your local machine
kubectl -n kubearmor port-forward service/grafana --address 0.0.0.0 --address :: 3000:3000
Note: In vagrant, you will need to configure port-forwarding to access the Prometheus and Grafana services.
For Prometheus
vagrant ssh -- -L 9090:127.0.0.1:9091
You should be able to see the following metrics on Prometheus UI at localhost:9090.
For Grafana
vagrant ssh -- -L 3000:127.0.0.1:3000
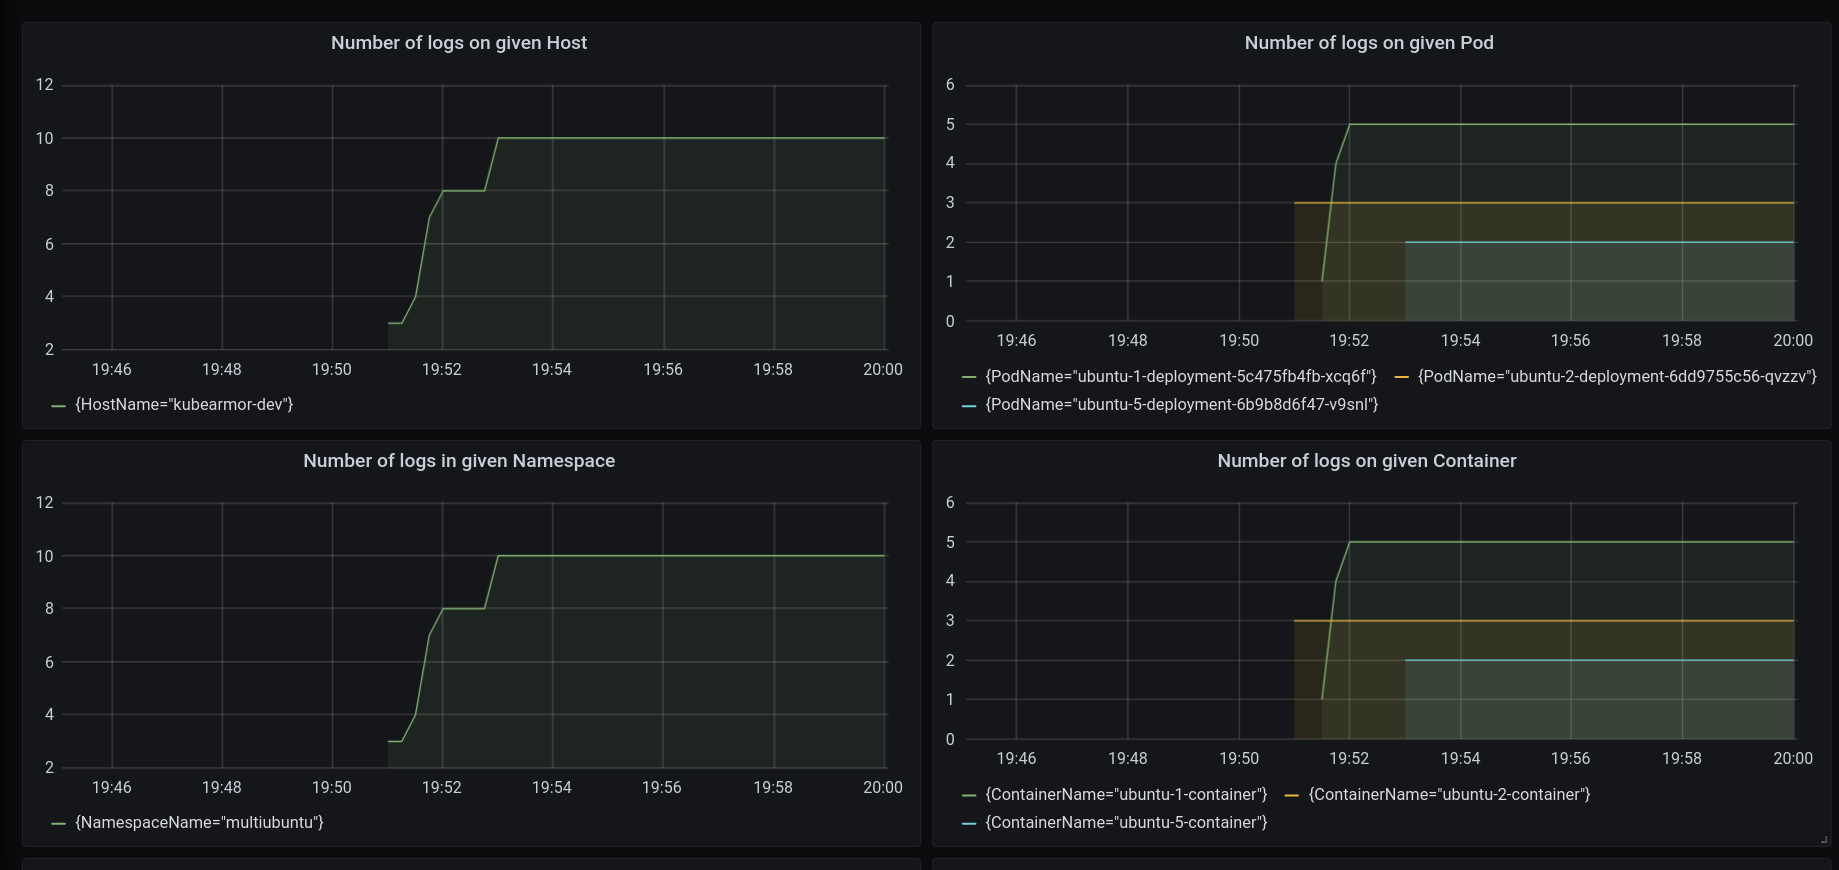
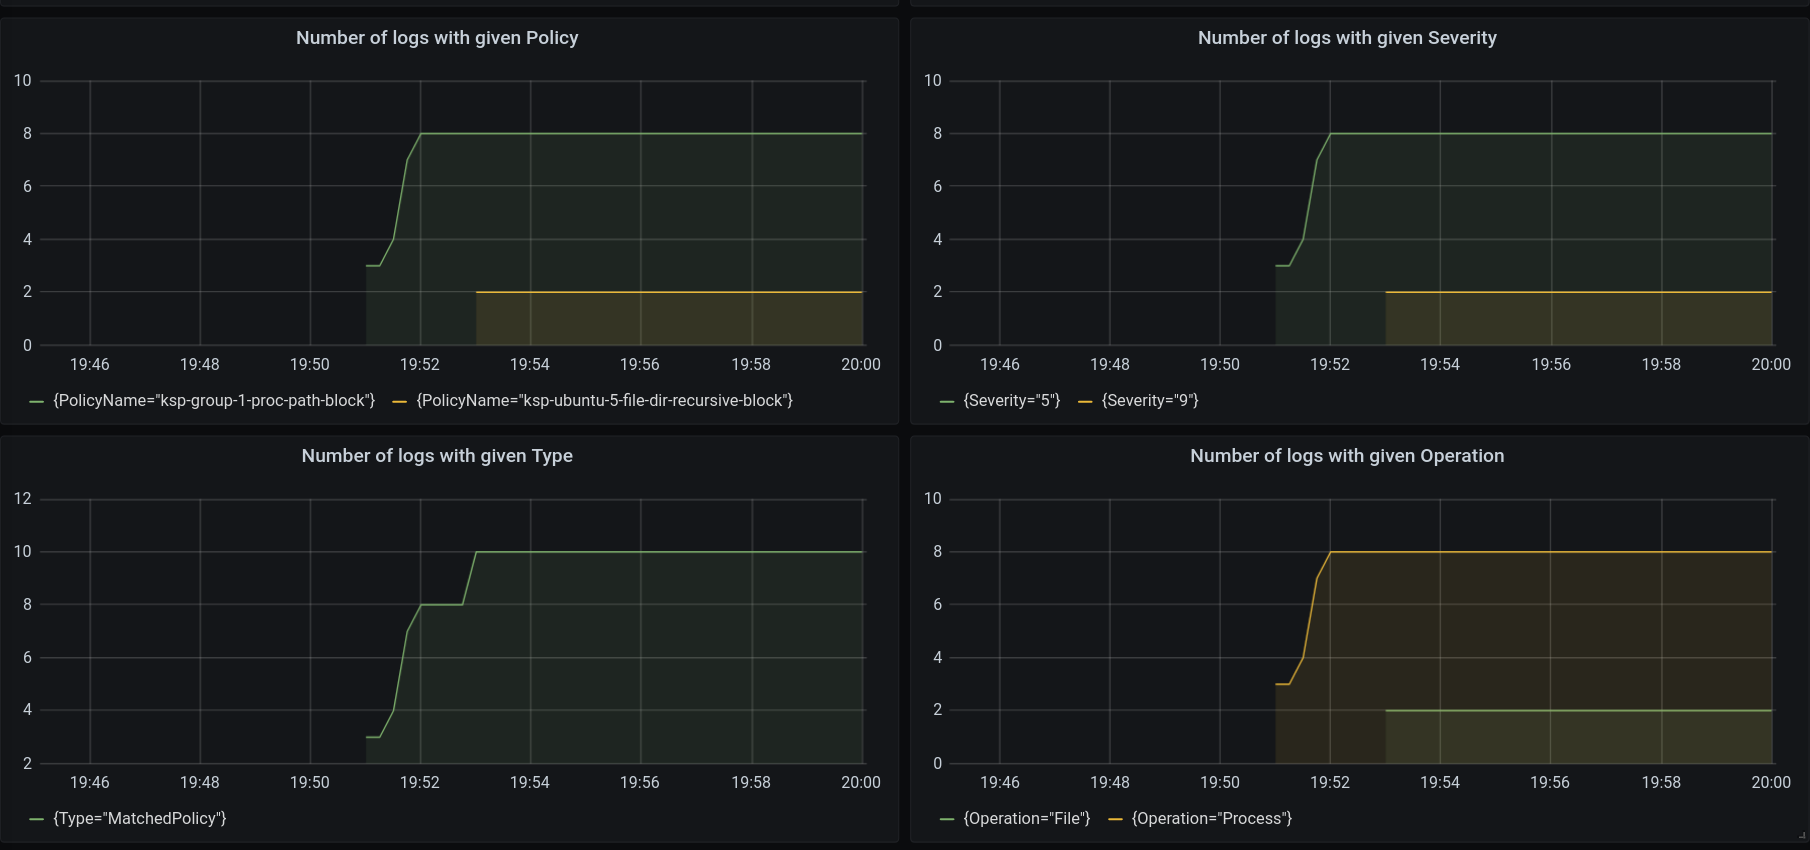
To view the Grafana Dashboard, head over to localhost:3000. You should be able to view the KubeArmor Dashboard.
Metrics
| About Metrics | Label | Metric Name |
|---|---|---|
| Number of alerts per Host | HostName | kubearmor_alerts_in_host_total |
| Number of alerts per Namespace | NamespaceName | kubearmor_alerts_in_namespace_total |
| Number of alerts per Pod | PodName | kubearmor_alerts_in_pod_total |
| Number of alerts per Container | ContainerName | kubearmor_alerts_in_container_total |
| Number of alerts per Policy | PolicyName | kubearmor_alerts_with_policy_total |
| Number of alerts per severity | Severity | kubearmor_alerts_with_severity_total |
| Number of alerts per type (MatchedPolicy, MatchedHostPolicy, MatchedNativePolicy) | Type | kubearmor_alerts_with_type_total |
| Number of alerts per operation (Process, File, Network, Capabilities) | Operation | kubearmor_alerts_with_operation_total |
| Number of alerts per action (Allow, Audit, Block) | Action | kubearmor_alerts_with_action_total |


