Substrate/PolkaDOT Prometheus scrapper with curl and custom logging to the journaled system to receive the metrics in Grafana with Promntail including new or changed fields.
- No need to install Grafana
- No need to setup Loki
- Serveless Setup and Installation
- Full controll on what is send as logs
- Substrate changes can be obtained easy
- More....
- Create a bash script in "/usr/sbin/" and paste the code below, you can modify the scrapping time at
sleep 15 - Control what is logged to journald grep commnad at
grep -v '#' | grep '_count'The current logged metric are all with_count - Change inside the script with your Substrate/Polkadio Prometheus PORT
- http://localhost:/metrics
- Or run polkadot daemon with a custom one by adding prometheus flags to your configuration file
- Specify Prometheus exporter TCP Port Flag --prometheus-port
#!/bin/bash

set -euf -o pipefail
exec 1> >(logger -s -t $(basename $0)) 2>&1

while true;
do
    curl -sb -S http://localhost:<PORT>/metrics | grep -v '#' | grep '_count'
    sleep 15
done
- Create system unit to enable the scrip with "vi /etc/systemd/system/metrics.service"
[Unit]
Description=Prometheus Scrapper.
After=network.target

[Service]
Type=simple
ExecStart=/bin/bash /usr/sbin/metrics.sh

Restart=always
[Install]
WantedBy=multi-user.target
- Reload the systemctl daemon
systemctl daemon-reload
- Enable the service
systemctl enable metrics.service
- Start the service
systemctl start metrics.service
- Check the service
systemctl status metrics.service
apt install sudo unzip -y \
&& sudo mkdir /opt/promtail \
&& cd /opt/promtail \
&& wget https://github.com/grafana/loki/releases/download/v2.2.1/promtail-linux-amd64.zip \
&& sudo unzip promtail-linux-amd64.zip
server:
  http_listen_port: 0
  grpc_listen_port: 0
  log_level: error
clients:
  - url: <DLOKI>
positions:
  filename: /tmp/positions.yaml
  ignore_invalid_yaml: true
scrape_configs:
- job_name: journal
  journal:
    max_age: 60s
    labels:
      job: systemd-journal
  relabel_configs:
    - source_labels: ['__journal__systemd_unit']
      target_label: 'unit'
    - source_labels: ['__journal__hostname']
      target_label: 'hostname'
    - source_labels: ['__journal__host']
      target_label: 'host'
  pipeline_stages:
  # Get this logs
  - match:
      selector: '{job="systemd-journal", unit="metrics.service"}'
      stages:
      - regex:
          expression: '.*(<output>)'
      - labels:
          level:
          output: log
          stream: stream
          timestamp: time
      - timestamp:
          source: timestamp
          format: RFC3339Nano
      - output:
          source: output
- Test the config with promtail
./promtail-linux-amd64 -config.file ./substrate-metrics.yaml --dry-run
- Create Grafana Cloud Account and obtain your Loki URL with API key for Promtail
- Choose the label "UNIT" in your log query and look for "metrics.service" that is runing on the machine
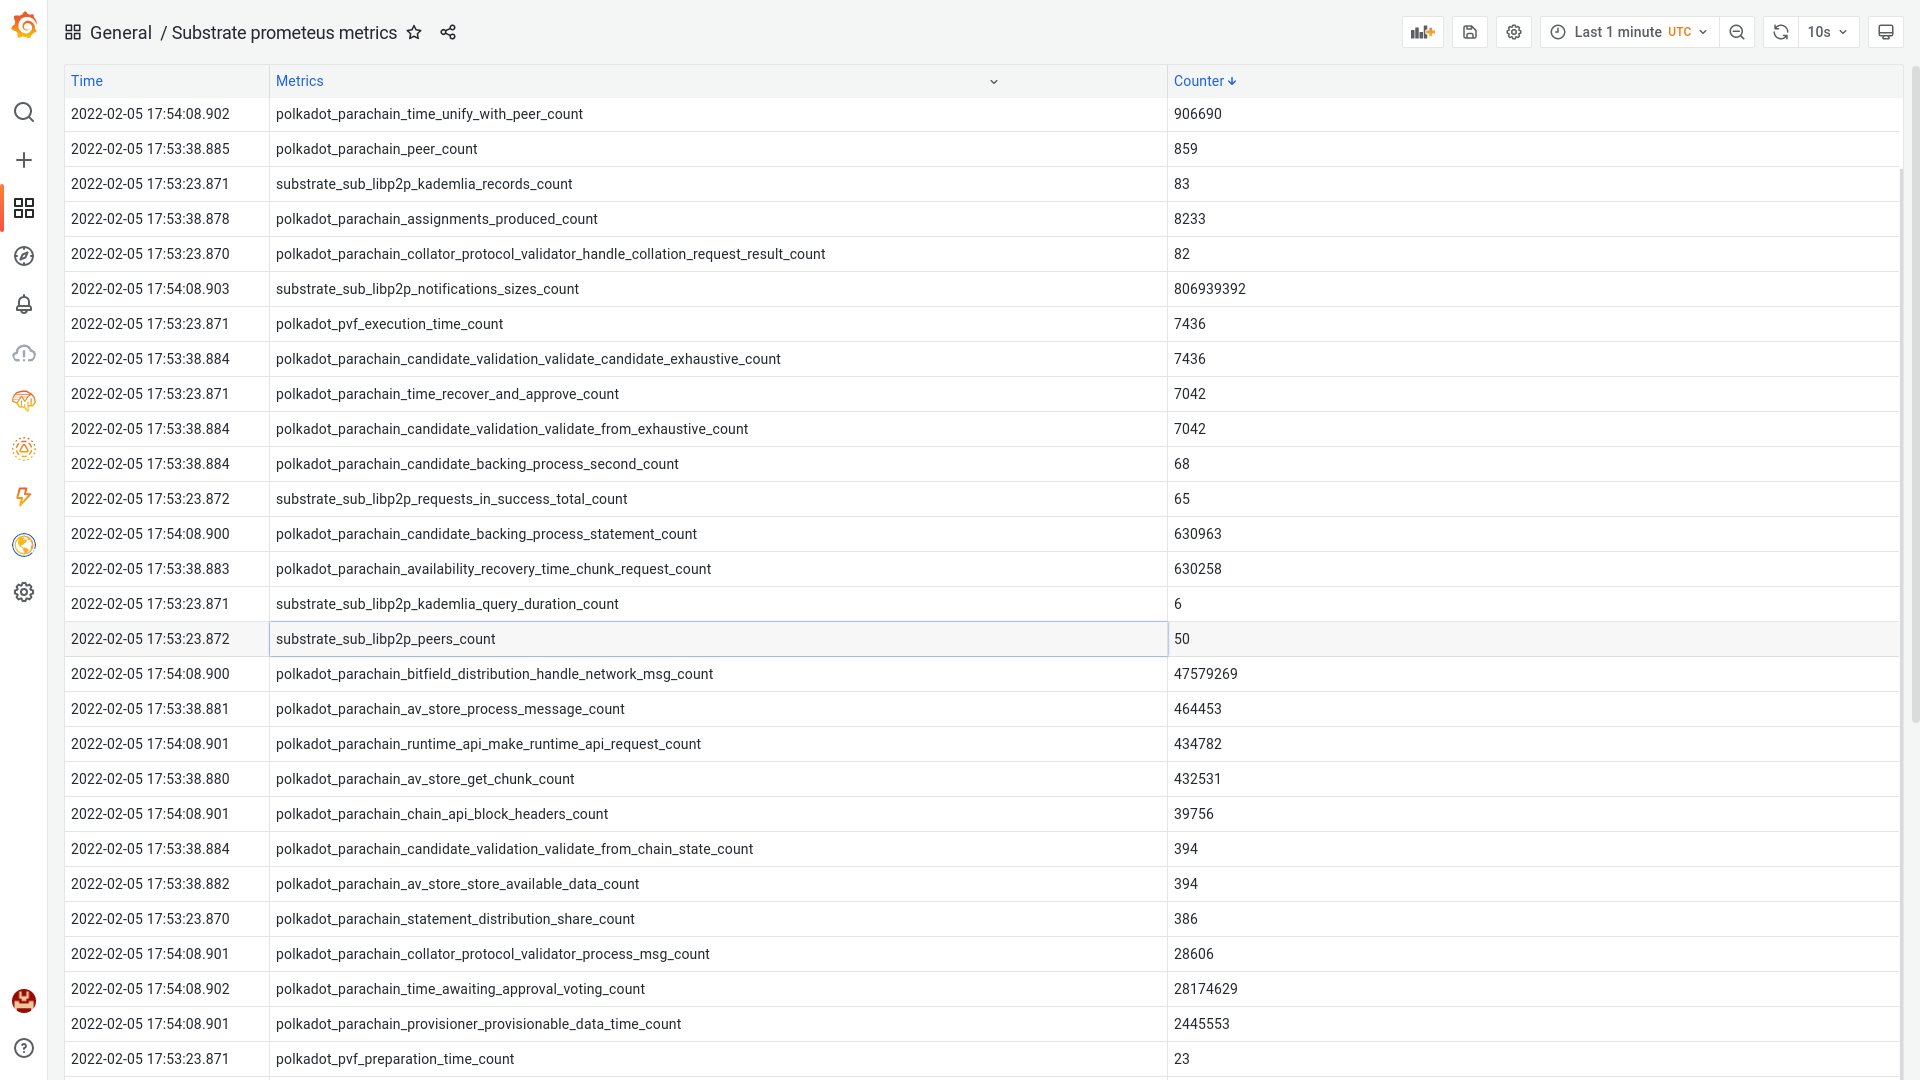
- Query example:
{unit="metrics.service"} | regexp "(?P<metric>^[a-zA-Z0-9_]+)(?P<json>\\{([^}]+)\\})\\W(?P<counter>[0-9]+)"
- Filtering on the queries with exact matching or regex
|= "polkadot_"
|= "substrate_"
|~ "substrate_.*kademlia"
- Example
{unit="metrics.service"} | regexp "(?P<metric>^[a-zA-Z0-9_]+)(?P<json>\\{([^}]+)\\})\\W(?P<counter>[0-9]+)" |~ "substrate_.*kademlia"
-
Display name for Validators. KSMNETWORK && KSMNETWORK-WEST
-
Riot @gtoocool:matrix.org
-
KUSAMA (KSM) Address
H1bSKJxoxzxYRCdGQutVqFGeW7xU3AcN6vyEdZBU7Qb1rsZ -
PolkaDOT (DOT) Address:
15FxvBFDd3X7H9qcMGqsiuvFYEg4D3mBoTA2LQufreysTHKA