Redis is a wonderful distributed key-value datastore, useful for facilitating information across services.
Grafana is a fantastic tool for visualizing time series data in real time, useful for monitoring business-critical metrics.
Unfortunately, Grafana does not natively come packaged with Redis as a datasource. This would generally entail the usage of a thirdparty data collector such as InfluxDB or Prometheus.
Fortunately, the team at Redis Labs have developed an official Redis plugin for Grafana, using their own RedisTimeSeries project.
This article will detail the testing of the integration of this plugin into Grafana. As dummy data, I've chosen to monitor the metrics of various fruits. Specifically, I'll be monitoring the rapidly fluctuating stock and price of: apples, bananas, and cherries.
In this test, everything will run in docker containers in a single docker-compose, so we don't have to worry about installing any thirdparty dependencies (except for, of course, docker, but that should be on every developer's machine :^))
The source code for this test can be found here
# https://github.com/kraxx/grafana-redis-test/blob/master/docker-compose.yml

version: "3.3"
services:

  redis:
    image: redislabs/redistimeseries
    ports:
      - 6379:6379
    network_mode: host

  grafana:
    image: grafana-with-redis-plugin
    depends_on:
      - redis
    ports:
      - 3000:3000
    network_mode: host
    volumes:
      - ./grafana/:/etc/grafana/provisioning/

  python_script:
    image: python:alpine
    depends_on:
      - redis
    network_mode: host
    volumes:
      - ./script/:/etc/my-script/
    command: >
      sh -c "pip install -r /etc/my-script/requirements.txt &&
      python3 /etc/my-script/redis_insert.py"
RedisTimeSeries is a time series database built on top of Redis.
We can interact with it pretty much the same way we do with Redis,
but with the addition of the TS commands.
Commands prepended with TS are associated with creating key-value pairs associated
with a time series. A timestamp is generally included, with * being the current time.
As per usual, redistimeseries exposes port 6379 for its outgoing db connection.
This redistimeseries instance is launched as redis in our docker-compose.yml.
I've written a simple python script that:
- Connects to the Redis instance.
- Creates 6 keys: a stock for each fruit in the format of
stock:fruit, and a price in the format ofprice:fruit. All values initiated at50for simplicity. The keys will additionally be labeled (for filtering in Redis) with the following:label:(stock|price)fruit:(apple|banana|cherry)
- Runs a loop that, for every
1 second:- randomly increments/decrements a random
fruit's stock - randomly increments/decrements a random
fruit's price
- randomly increments/decrements a random
This file is copied to a python:alpine docker image and ran from there.
In our docker-compose.yml, this is the python_script service.
# https://github.com/kraxx/grafana-redis-test/blob/master/script/redis_insert.py

# This script generates fruit stock & prices,
# and randomly increments/decrements their numbers.

import time
import random
import redis

r = redis.Redis(host="localhost", port=6379, db=0)
fruits = ("apple", "banana", "cherry")


# Creates stock and price keys for every fruit in fruits.
# Initializes values to 50.
def create_keys():
    for fruit in fruits:
        r.execute_command('TS.CREATE stock:{0} LABELS label stock fruit {0}'.format(fruit))
        r.execute_command('TS.CREATE price:{0} LABELS label price fruit {0}'.format(fruit))

        r.execute_command('TS.ADD stock:{0} * 50'.format(fruit))
        r.execute_command('TS.ADD price:{0} * 50'.format(fruit))


# Randomly increments/decrements a random fruit for the given label by 1-5 units.
def update_random(label):
    fruit = fruits[random.randint(0, 2)]
    amount = random.randint(1, 5)
    command = "TS.INCRBY" if bool(random.getrandbits(1)) else "TS.DECRBY"

    r.execute_command("{0} {1}:{2} {3}".format(command, label, fruit, amount))


if __name__ == "__main__":
    random.seed(time.time())
    create_keys()
    time.sleep(1)

    while True:
        update_random("stock")
        update_random("price")
        time.sleep(1)
Grafana is a time series data visualization tool, that displays pretty graphs for all your monitoring needs.
As the redis datasource is not included by default, it needs to be installed. This can be simply set via environment variable into the official grafana image. However, I have included a script to build a custom grafana image that installs the plugin once, so it doesn't need to be installed every time the image is run.
#!/usr/bin/env bash

docker build -t grafana-with-redis-plugin -f ./grafana/Dockerfile .
When you launch the image, you can visit the local web portal via http://localhost:3000.
The default login credentials are admin:admin.
If you navigate to Configuration > Data Source > Add Data Source, you'll find the Redis data source available:
You can then create a new panel under a dashboard, and choose this Redis as a data source:
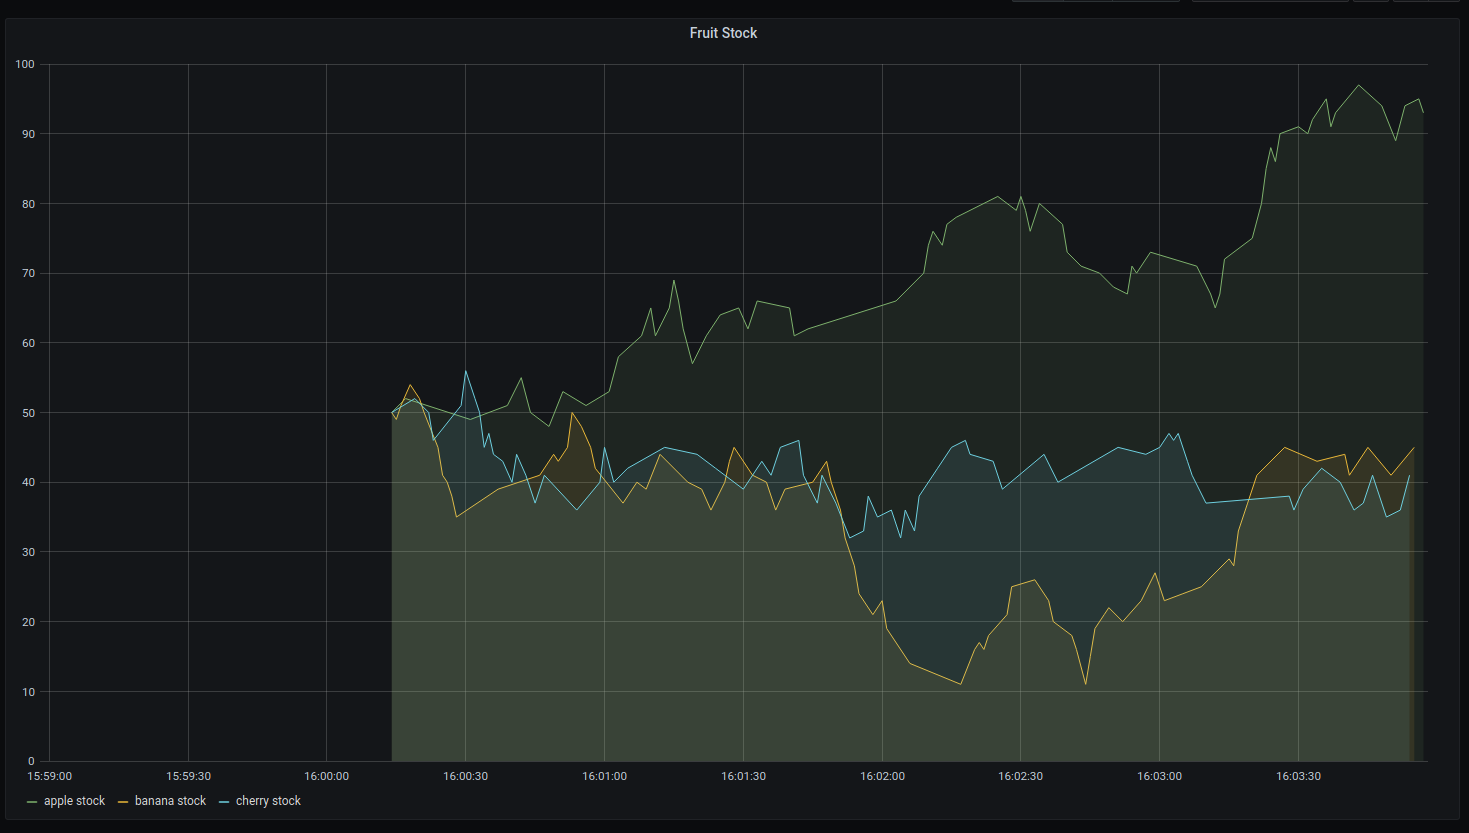
We can use the labels we set on our keys to separate each fruit, as well as set the stock label.
And voila:
As a convencience, I have included the Grafana dashboards and datasource configurations in the grafana directory.
This service is grafana-with-redis-plugin in our docker-compose.yml.
You can clone the repository and run this app for yourself.
The steps are simple:
./build.sh(might have to runchmod 744 ./build.shon it) to build the custom Grafana image.docker-compose up- Navigate to your local Grafana dashboard at http://localhost:3000.
- Login with the default credentials:
admin:admin.
You should be able to see your fruits undergoing a turbulent market roller coaster under the Juicy Fruits dashboard.
RedisTimeSeries works well for a simple distributed key-value store, and its integration with Grafana is relatively hassle-free.
If you require additional metrics, however, such as the number of GETS, SETS, and other associated metrics, you will require a data exporter and another database.


