Gain an understanding of how launch dates and funding goals affect kickstarter campaign outcomes for theater plays using data from 2009 to 2017.
To describe and visualize kickstarter campaign outcomes for theater plays based on launch dates and funding goals.
The large kickstarter dataset was organized and drilled down to the subcategory of Theater: Plays.. After compliling only these data, I used a Unix timestamp converter to set the dates and filter by month, day, and year. Then, I created a pivot table to see months and map a line graph to read the trends in the data. For the second analysis, I looked at successful and failed theater plays based on the goals set by the creater in US dollars. Using the same data set, the percent of the total campaigns was graphed based on the tiered amounts asked requested.
Some challenges this data presented were being in Unix time stamp at the outset. These were overcome by using a converter and storing the data in new date format in created columns. Other challenges with this dataset are some limitations in regard to the amount of data first presented in total vs the much smaller subset of data used for this analysis. Kickstarers here are also only in English-speaking countries led by the United States. This works for our analysis, as the campaign proposed will take place in the US, however could be limiting for other such analyses.
 Figure 1. Total number of Kickstarter theater successes and failures based on launch time of year by months.
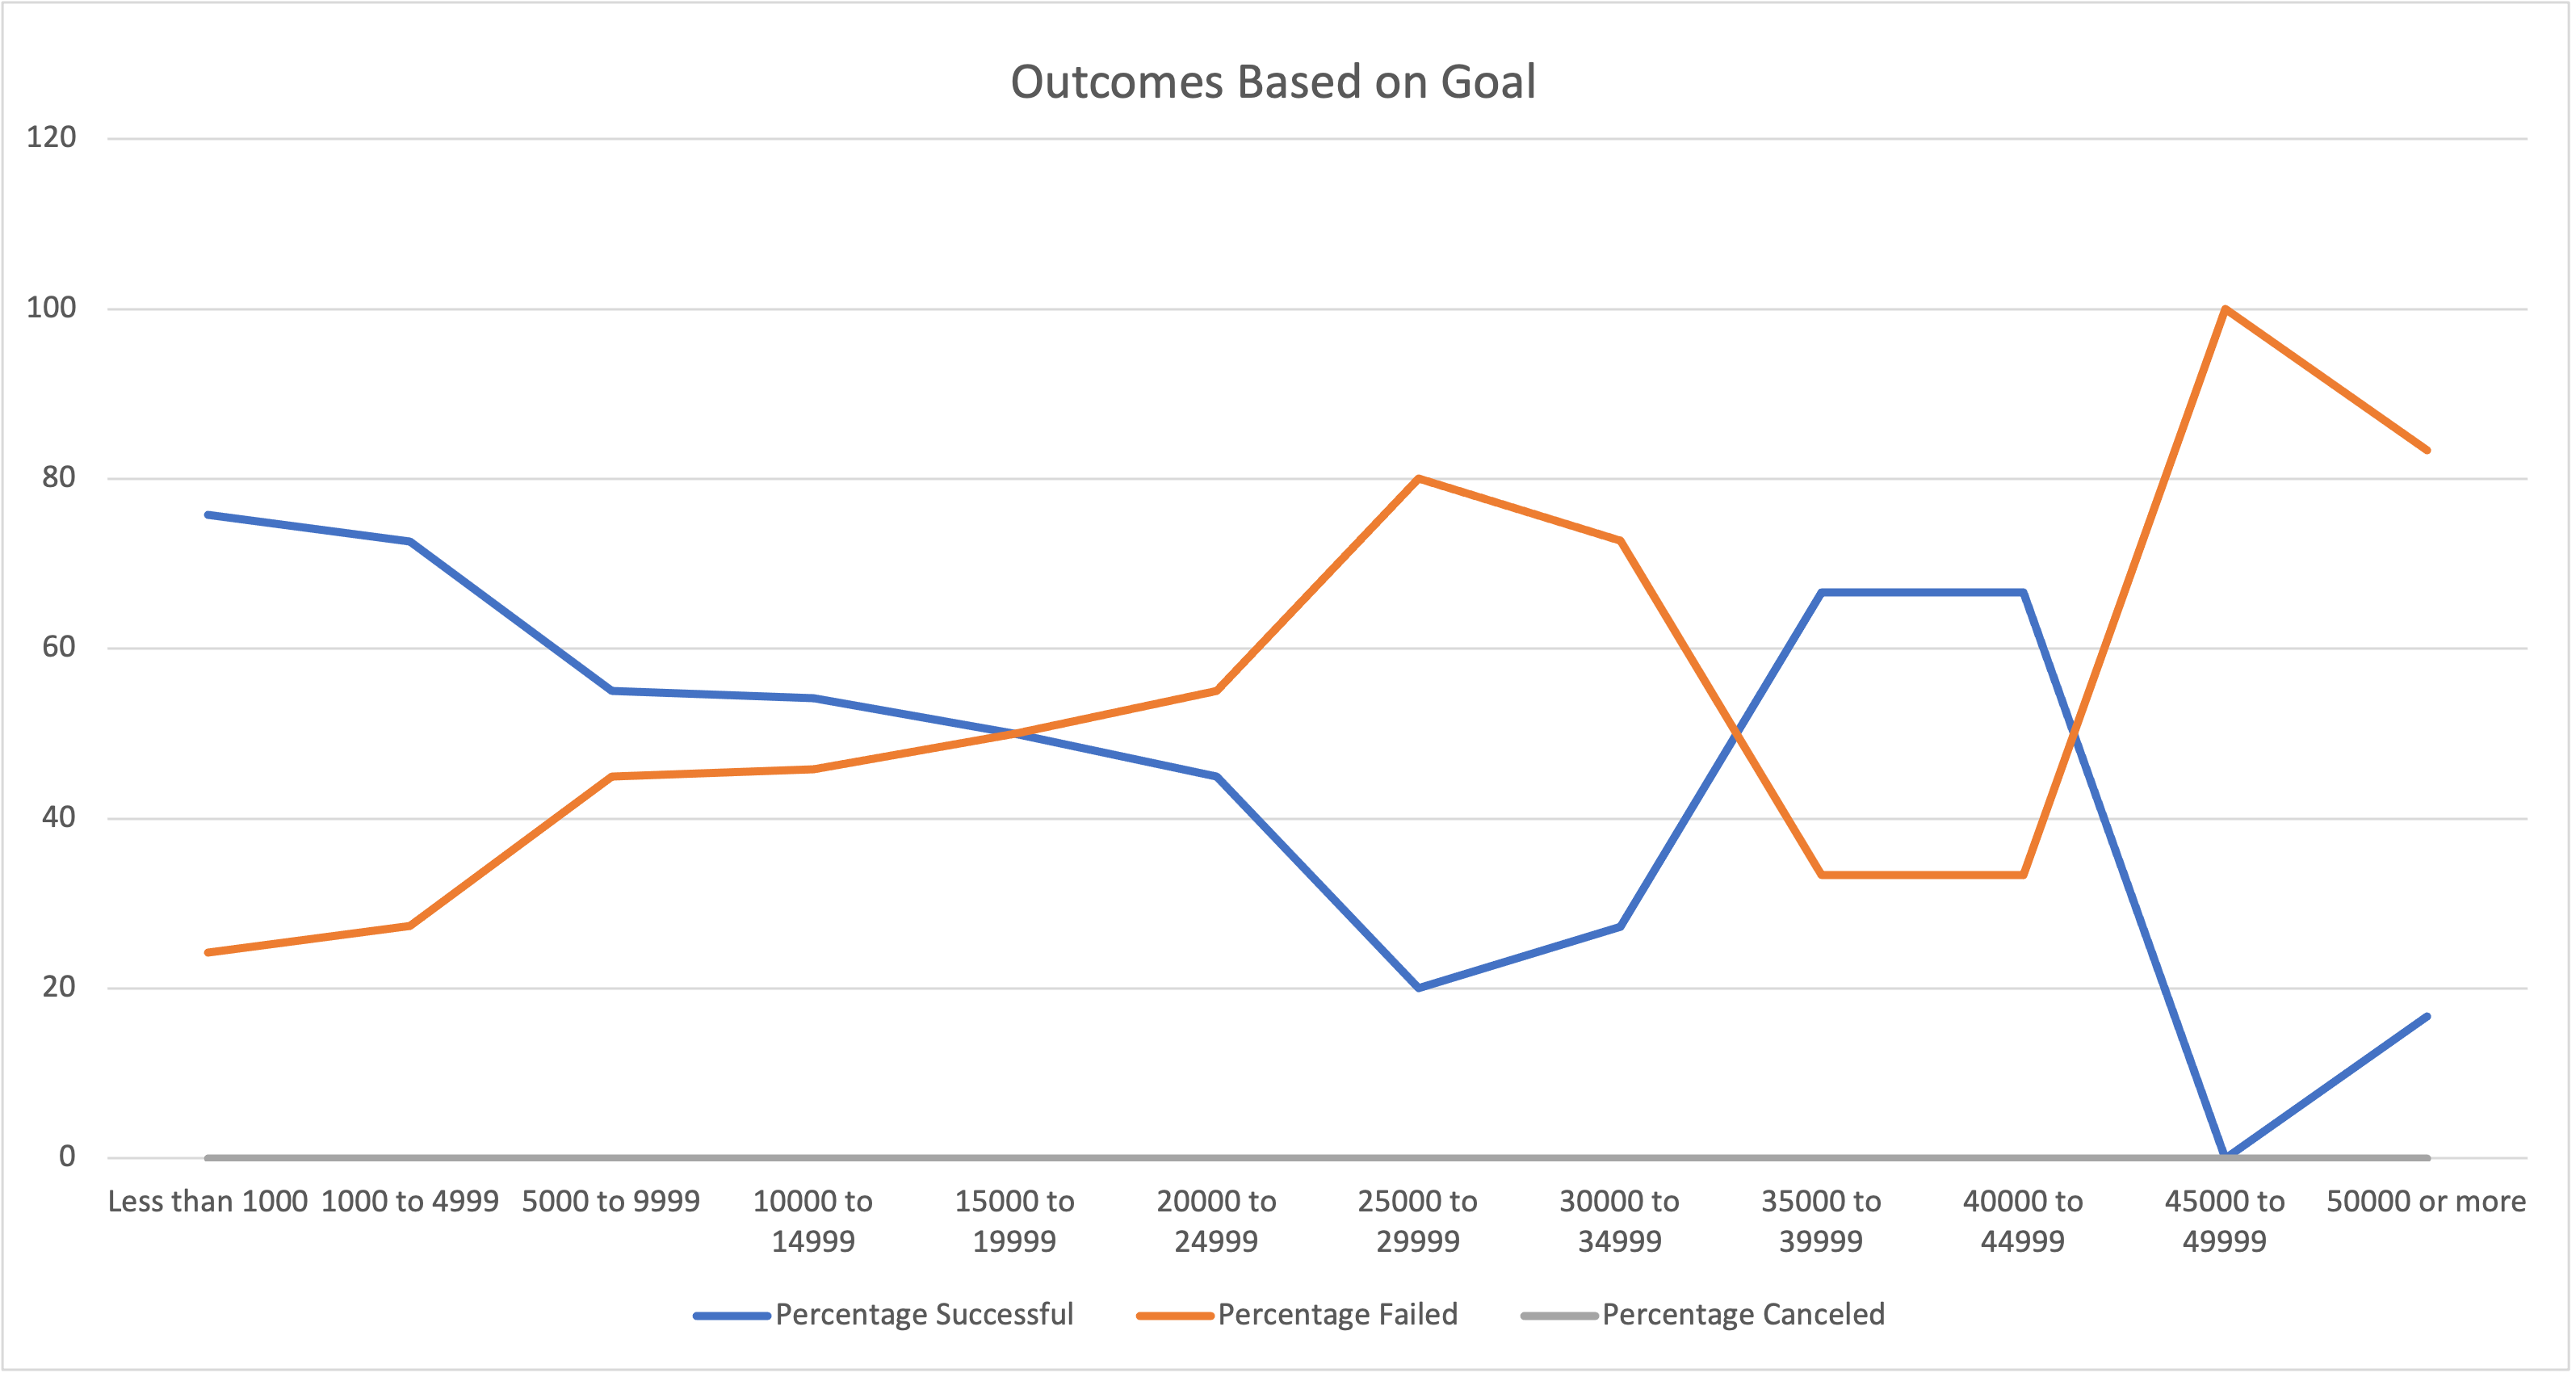 Figure 2. Kickstarter theater outcomes (by percent successful or failed) based on launch goals requested in USD.
-What are two conclusions you can draw about the Outcomes based on Launch date?
Based on the Figure 1. the Kickstarter theater campaigns started a successful launch in the late spring, peaking in the month of May, and remaining more favorable than any other time of year through the summer dropping below optimal by August. The worst month for a successful outcome is December.
- What can you conclude about the Outcomes based on Goals?
Based on Figure 2. the highest percentage of successful campaigns launched were in the less than $1000 USD range with almost 80% of those reaching their goals of funds. The highest propensity of failure occured over $45,000 USD, and in general the trend for failure outpaced success for campaigns over $15,000 USD.
- What are some limitiations of this dataset?
Some limitations in these data are that they all come from English speaking countries. While the dataset itslef is quite large and spans a number of years, it is realitively small when we are looking at only the Theater, Play subcategory. Speaking in terms of today and the global pandemic, these numbers might have significantly shifted in the month of the year category; with Spring/Summer increasing due to the outdoor option for some plays. Would looking at day of the week return a different outcome than just month of the year?
- What are some other possibile tables and/or graphs that we could create?
Other ways to look at the data where we might find outliers and anomalies would be to use a box and whisker. A stacked bargraph could also be a way to look at the Outcomes grouped by Goals data and see the interplay.