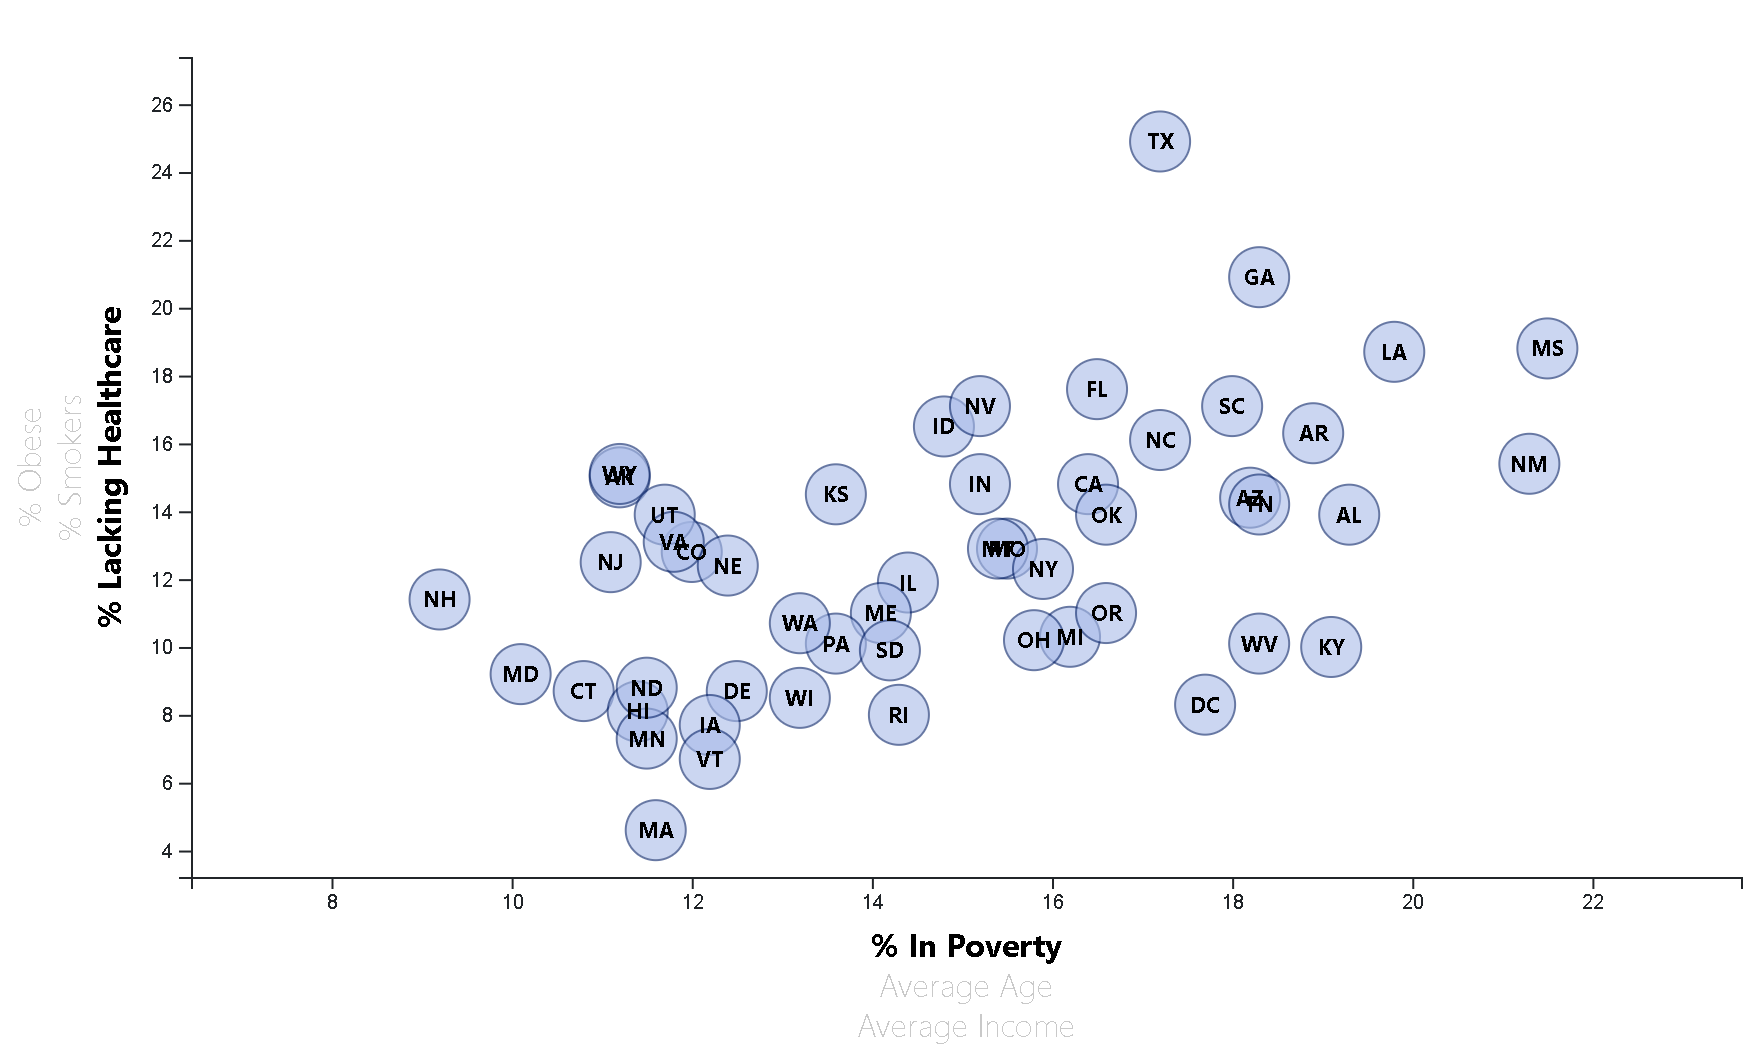
This project focused on visualizing health risks facing particular demographics. The data set included with the assignment is based on 2014 ACS 1-year estimates from the US Census Bureau with data on state rates of poverty, age, income, healthcare, obesity, and smoking.
Languages and libraries used:
- Javascript
- D3
- HTML
- CSS
The final app can be viewed at: https://klharp.github.io/D3-DataJournalism/.
Using D3, created a scatter plot between two of the data variables Healthcare vs. Poverty.
- Rendered the state abbreviations within the circle elements.
- Scaled the axes appropriately.
- Styled the text and circle elements.
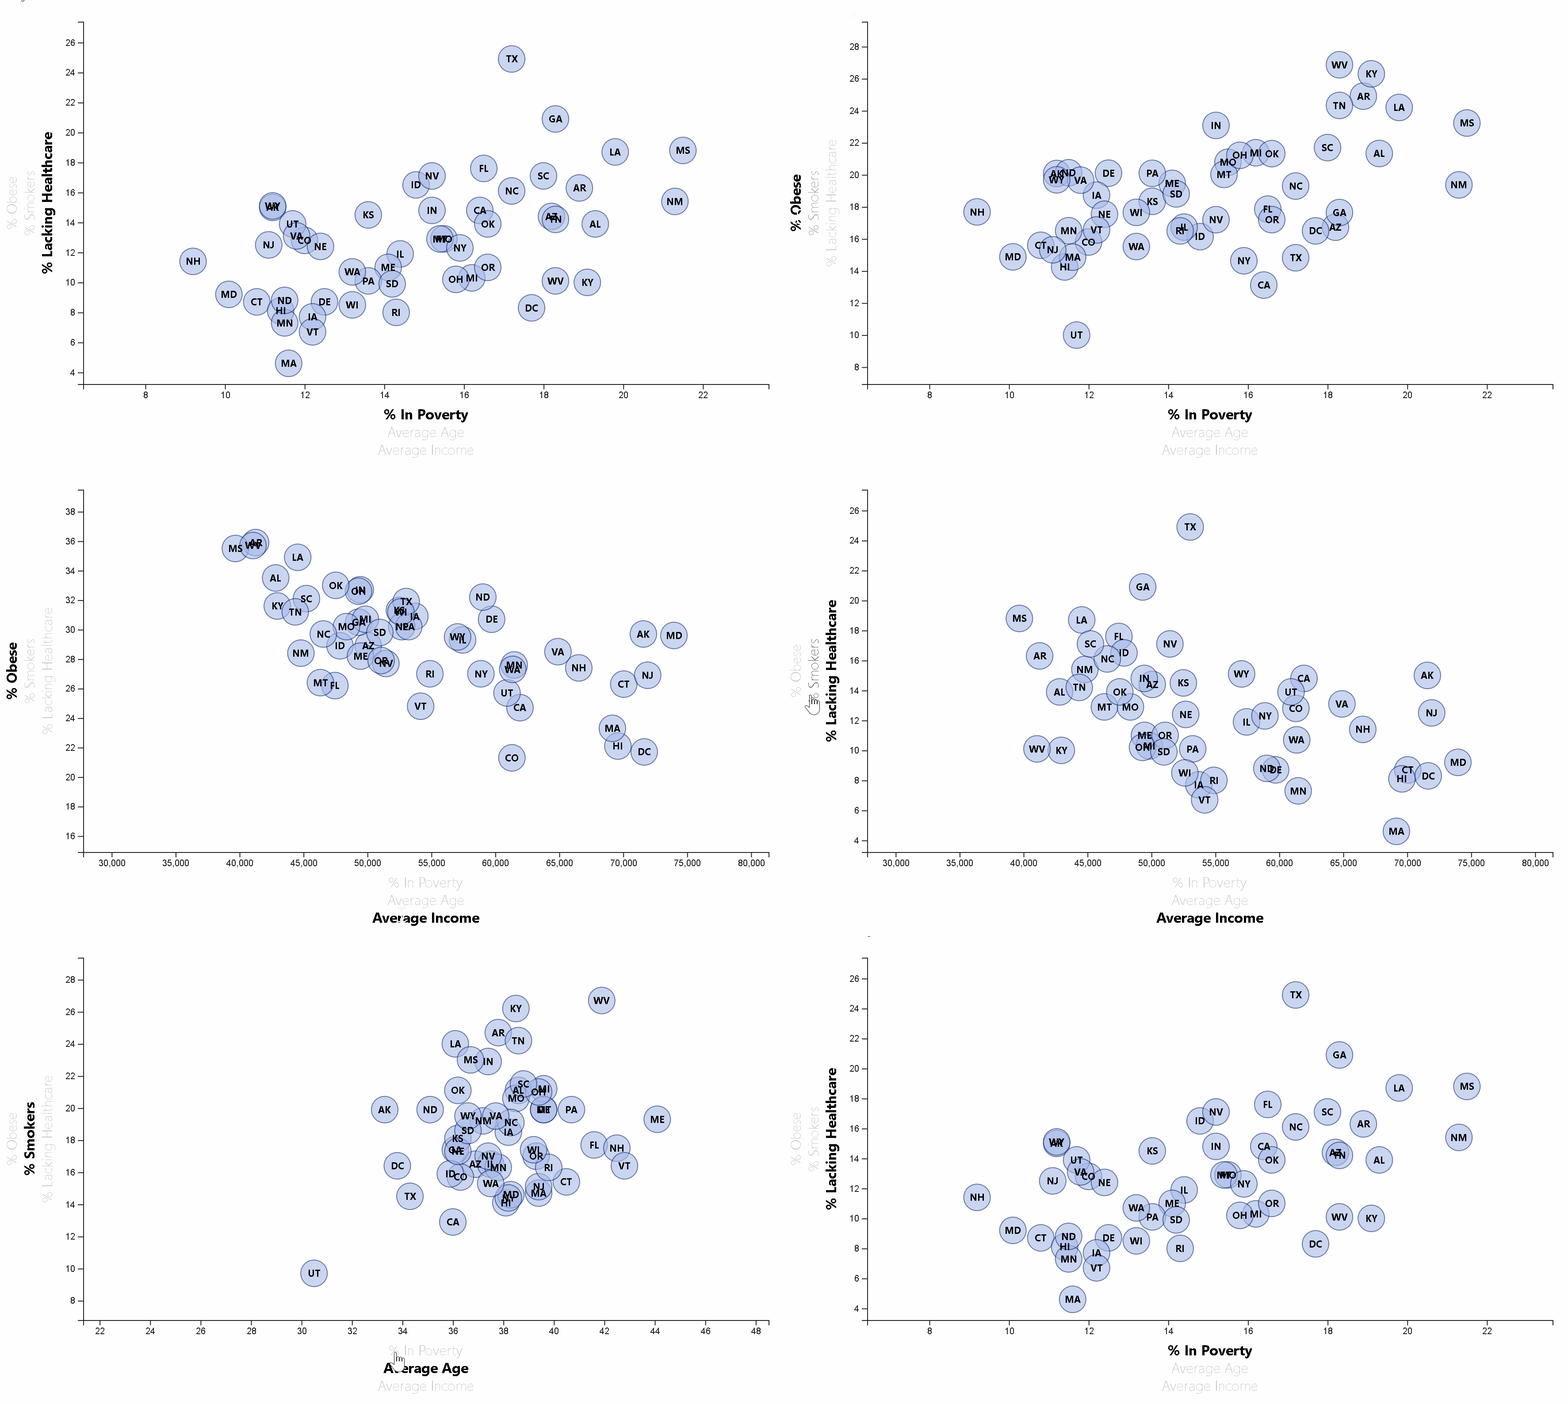
Make graph(s) dynamic and interactive.
- Made responsive.
- Added more demographics and risk factors. Additional axis labels have click events so users can decide which data to display.
- Transitions were applied.
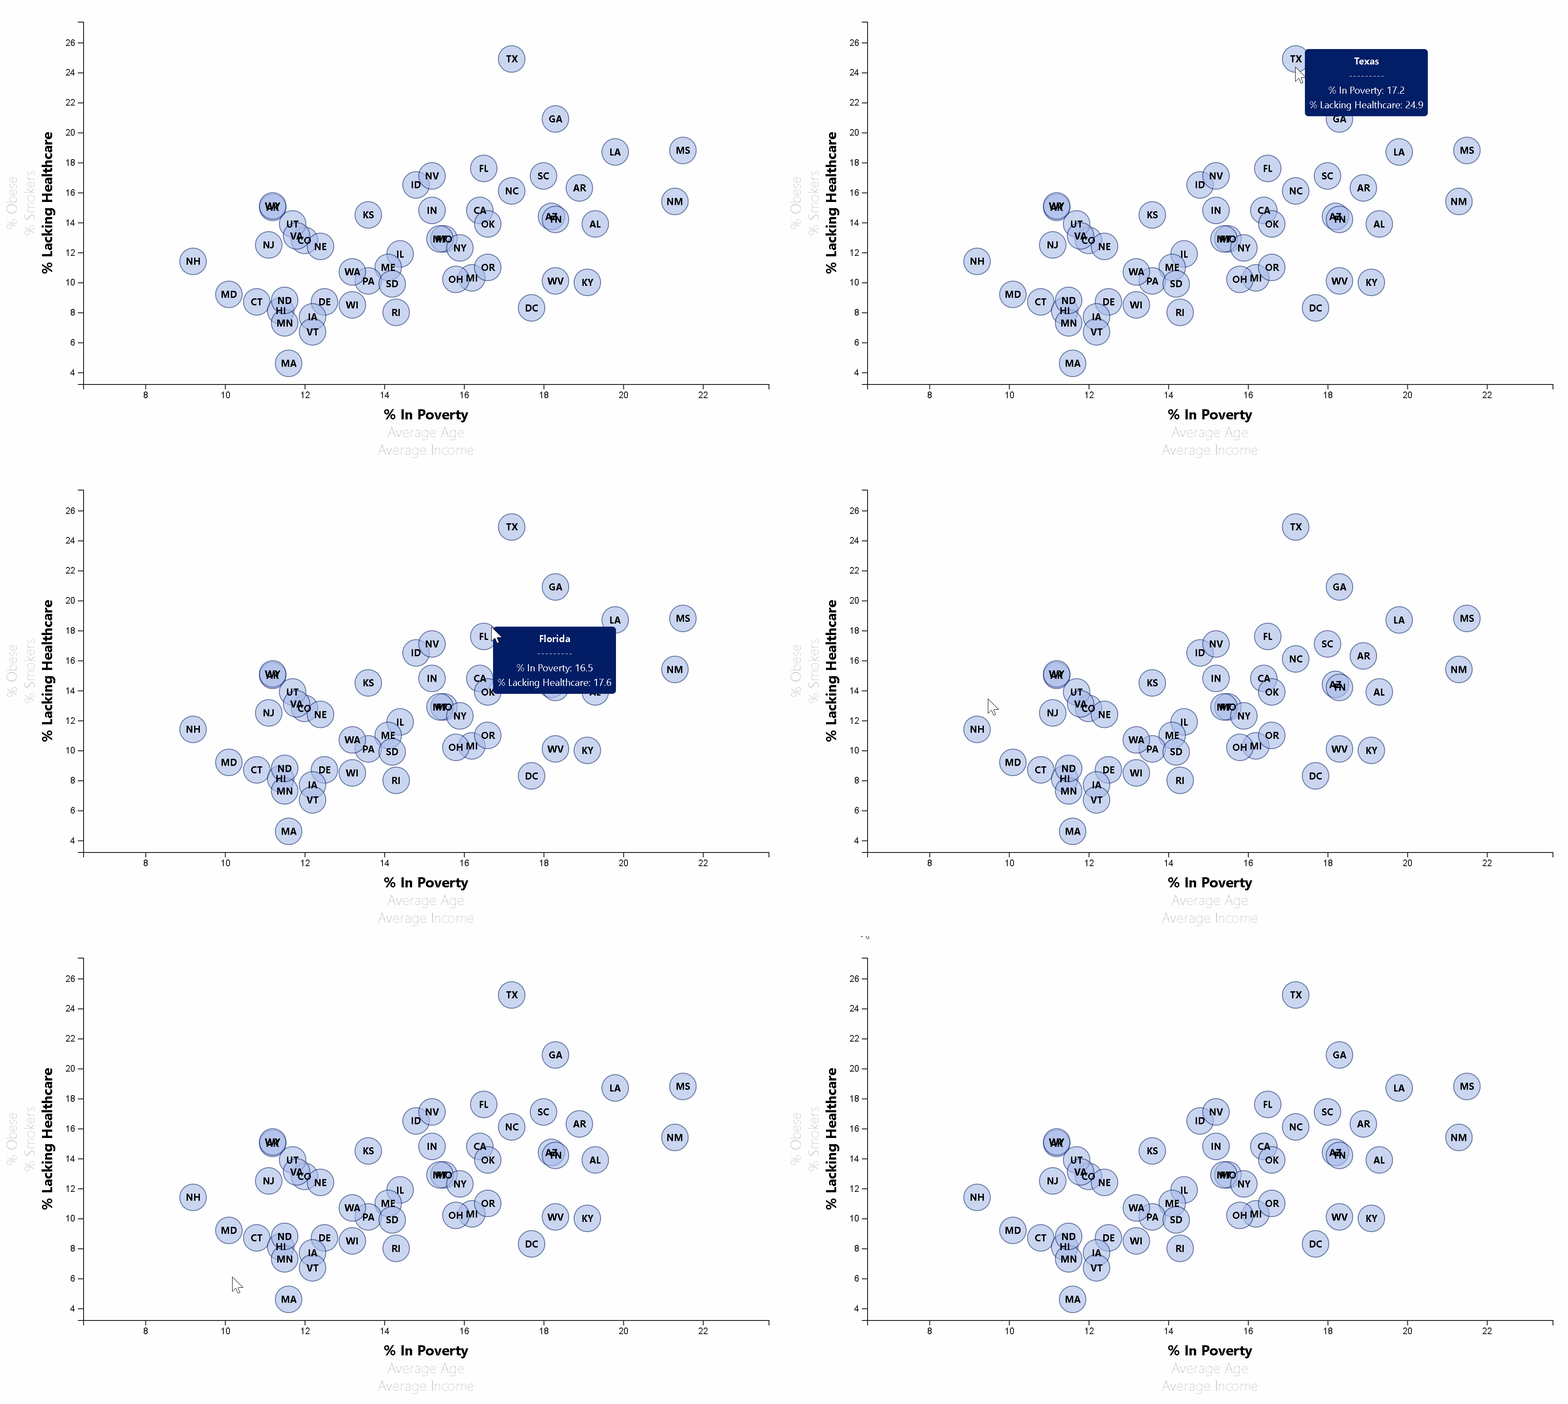
- Tooltips were added to reveal specific data when the user hovers the cursor over the circle element.
- The tooltip dynamically provides data for both the chosen X and Y axes.
- Styled the tooltip element.


