The "Self Organizing Recurrent Network Simulator" allows you to create different Neuron-Groups, define their Behaviour and connect them with Synapse-Groups.
With this Simulator you can create all kinds of biological plausible networks, which, for example, mimic the learning mechanisms of cortical structures.
Python 3 is required.
Use pip install -r requirements.txt to install the following requirements:
Numpy
QT5
PyQtGraph
Matplotlib
Scipy
Sklearn
ImageIO
Pillow (PIL)
To start an example you have to move to an example folder
"Self-Organizing-Recurrent-Network-Simulator/Testing/Example/" and execute it with the following command:
python3 ...Main.py
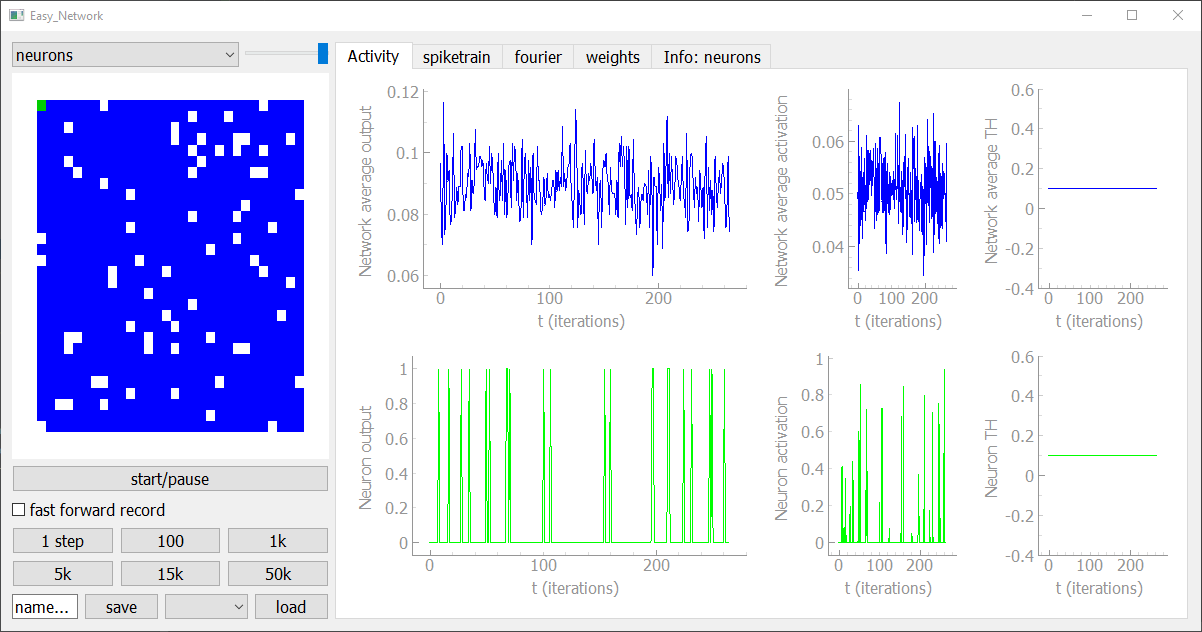
The user interface allows you to display your network in an interactive way and you can add new visualization modules, too. In the sidebar on the left hand side you can see the activiy of the selected neuron-group in the current timestep, as well as buttons to save, load, fast forward, pause and start the simulation. The tabs on the right hand side give you all kinds of visualizations and controlls to analyse the network.
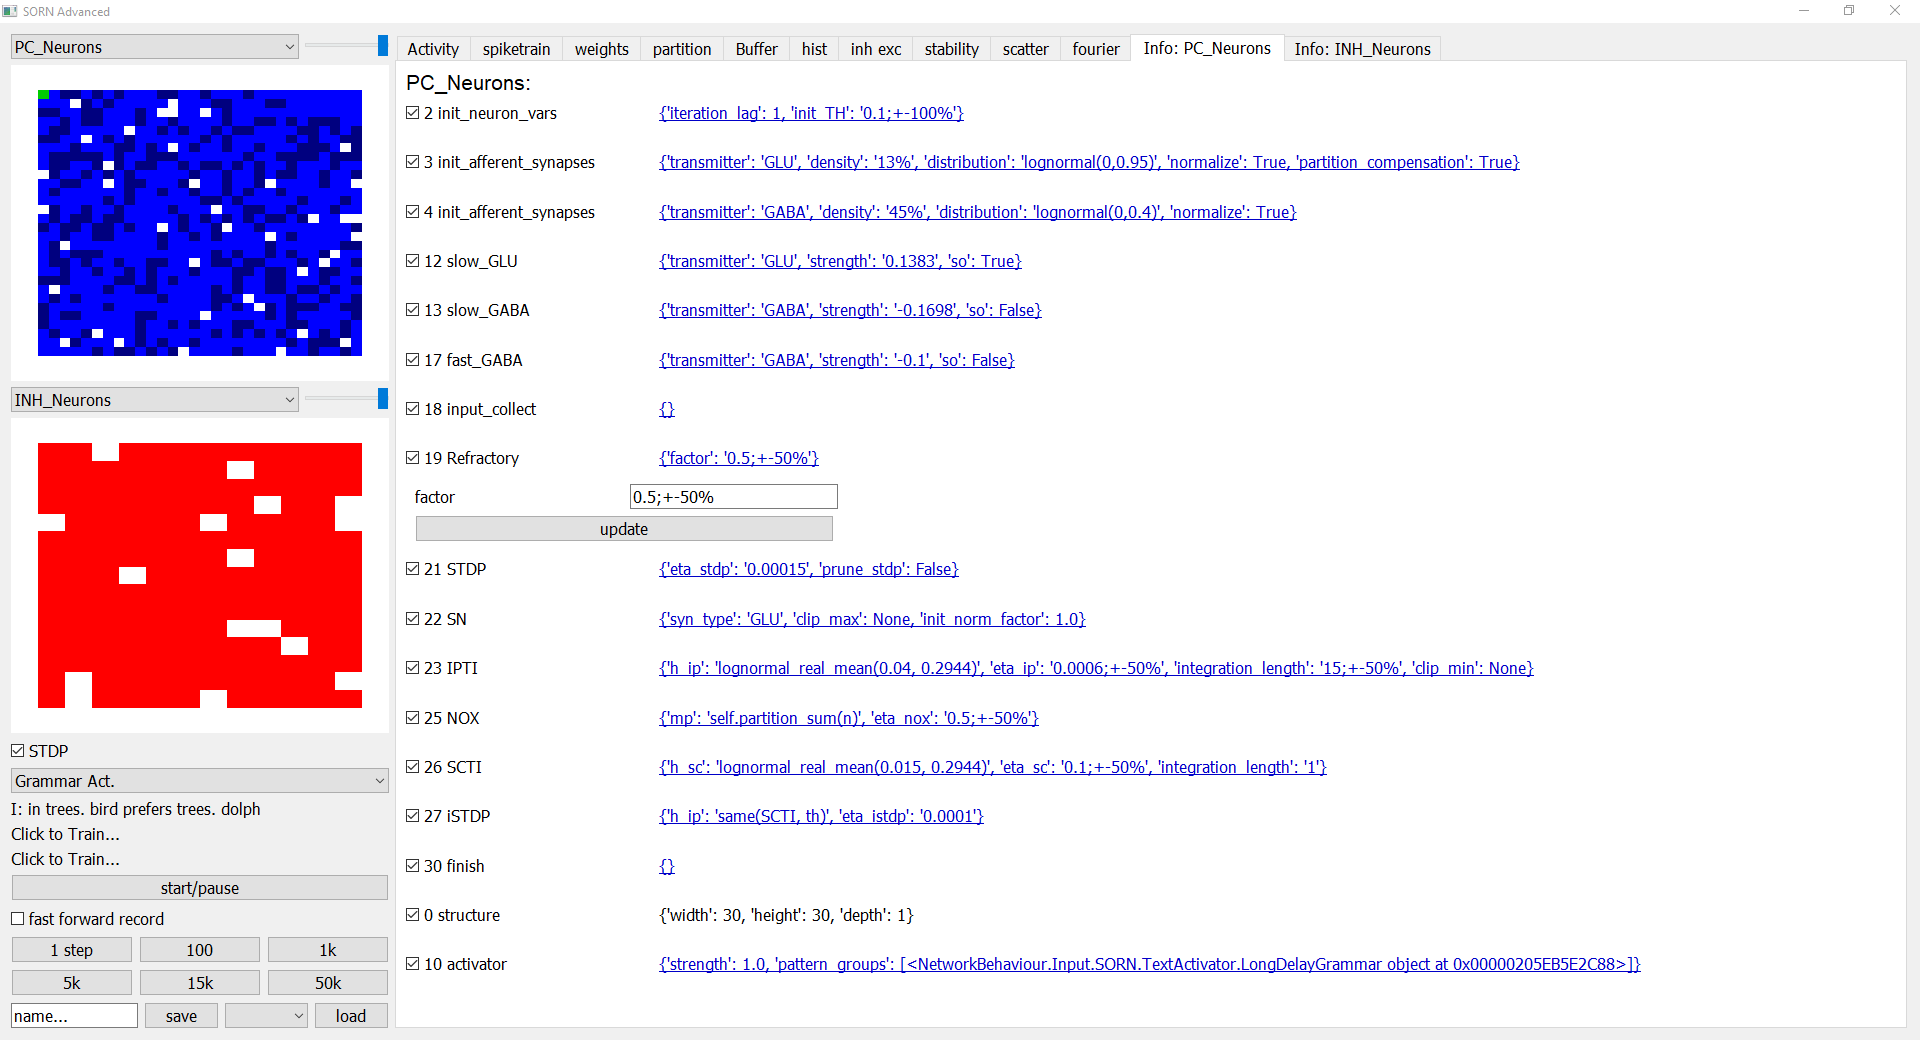
The "Info:" tab gives you an overview over the behaviours and the corresponding parameters. Each behaviour can be
enabeled or disabeled and its parameters can be changed in realtime by clicking on the underlined text, which opens and
closes a submenu. By clicking "update" the set_variables() (infos below) function of the behaviour is called with the
new parameters so the behaviour is reinitialized.
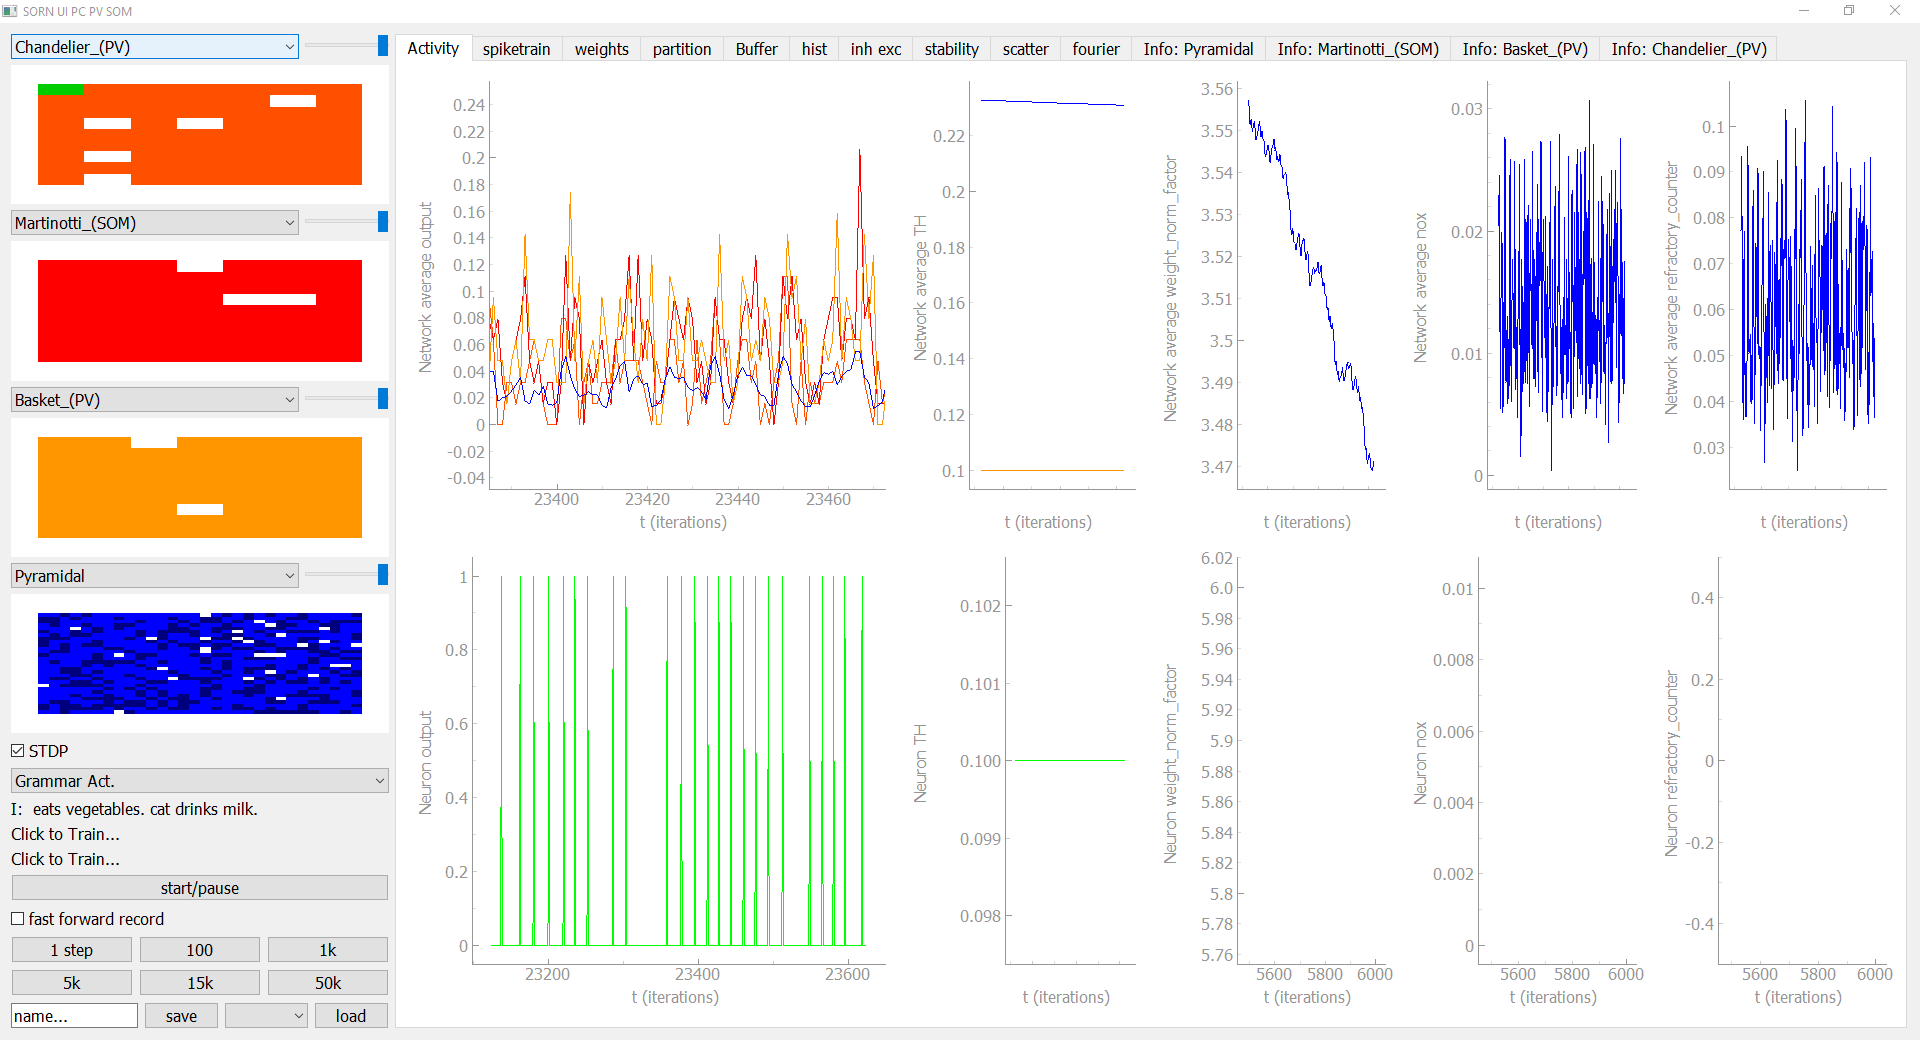
If you have defined an input source and feed it to the network, the corresponding input module will occur in the sidebar. In this grammar example you can see which characters are currently feed into the network and you can train a readout classifier to predict the current and the next character to test how much temporal information is stored in the Network.
A basic network grid with three behaviours (index defines execution order), recurrent connections and local receptive fields can be created like this:
Easy_Network = Network()

Easy_Neurons = NeuronGroup(net=Easy_Network, tag='neurons', size=get_squared_dim(number_of_neurons), behaviour={
        1: Easy_neuron_initialize(),
        2: Easy_neuron_collect_input(),
        3: Easy_neuron_generate_output(threshold=0.1)
    })

SynapseGroup(net=Easy_Network, src=Easy_Neurons, dst=Easy_Neurons, tag='GLUTAMATE', connectivity='(s_id!=d_id)*in_box(10)')

Easy_Network.initialize()
Each Behaviour has the following layout where set_variables is called when the Neuron Group is initialized while
new_iteration is called repeatedly every timestep. neurons points to the parent neuron group the behaviour belongs to.
class Basic_Behaviour(Neuron_Behaviour):

  def set_variables(self, neurons):
    return

  def new_iteration(self, neurons):
    return
A behaviour that collects all the inputs from the Synapses tagged with "GLUTAMATE" and adds some random noise can look like this:
class Easy_neuron_collect_input(Neuron_Behaviour):

    def set_variables(self, neurons):
        self.add_tag('Easy_neuron_collect_input')
        neurons.sensitivity = self.get_init_attr('sensitivity', 1.0, neurons)

        #create random synapse weights
        for synapse_group in neurons.afferent_synapses['GLUTAMATE']:
            synapse_group.W = synapse_group.get_random_synapse_mat()*0.0001
            #synapse_group.get_synapse_mat() #equivalent to np.zeros(s.get_synapse_mat_dim())

    def new_iteration(self, neurons):
        for s in neurons.afferent_synapses['GLUTAMATE']:
            neurons.activation += s.W.dot(s.src.output)*neurons.sensitivity

        neurons.activation += neurons.get_random_neuron_vec(density=0.1)
To simulate timesteps you can use the following commands:
network.simulate_iteration()
network.simulate_iterations(iterations=1000)
The Network activity and the Neurons positions can be plotted like this ("100: recorder" can alternatively be added when the Neuron Group object is initialized):
recorder=NeuronRecorder(['np.mean(n.output)'], tag='my_recorder')
Easy_Network.add_behaviours_to_neuron_group({100: recorder}, Easy_Neurons)
Easy_Network.simulate_iterations(iterations=1000)

plt.plot(Easy_Network['np.mean(n.output)',0,'np'])# 'np.mean(...)' code is also used as a tag
plt.show()

plt.scatter(Easy_Neurons.x, Easy_Neurons.y)
plt.show()
The tagging system allows you to access all kinds of synapses, neuron groups, behaviours and recorded values in an efficient way with one command:
#tags can be added to the constructor
obj(tag='tag1,tag2,tag3')
obj.add_tag('tag')

#retruns a list of all the objects tags
object.tags

#returns a list of all neuron groups tagged with "neurons"
Easy_Network['neurons']

#returns a list of all synapse groups tagged with "GLUTAMATE"
Easy_Network['GLUTAMATE']

#retruns the first neuron group tagged with "neurons" (equivalent to Easy_Network['neurons'][0])
Easy_Network['neurons', 0]

#returns a list of all behaviours tagged with "Easy_neuron_collect_input" from all neuron groups
Easy_Network['Easy_neuron_collect_input']

#returns a list of all behaviours tagged with "my_recorder" in the object Easy_Neurons
Easy_Neurons['my_recorder']

#returns one output recording and casts it to numpy array. (equivalent to np.array(Easy_Network.NeuronGroups[0].behaviour[100].variables['n.output']))
Easy_Neurons['n.output',0,'np']

#returns one output recording and casts it to numpy array.
recorder['n.output',0,'np']

#the commands can also be combined. Here the command returns output recording of the neuron group tagged with "neurons" and casts it to an numpy array.
Easy_Network['neurons', 0]['n.output',0,'np']
To implement your own UI Tab you have to implement a class with three functions.
"add_recorder_variables(...)" defines which variables you want to record. Here the Neurongroup.excitation variable is
recorded and used in the following code.
initialize(...) initalizes your tab and places the ui elements. You can use all kinds of PyQt elements as well as
pygraph plots.
update(...) is called at every timestep and updates the UI elements based on the current network state.
import pyqtgraph as pg
import numpy as np

class my_scatter_tab():

    def add_recorder_variables(self, neuron_group, recorder):
        if hasattr(neuron_group, 'excitation'):
            recorder.add_varable('n.excitation')
        if hasattr(neuron_group, 'inhibition'):
            recorder.add_varable('n.inhibition')

    def initialize(self, Network_UI):
        self.my_scatter_tab = Network_UI.Next_Tab('my_scatter')

        Network_UI.Add_element(QLabel('my_scatter_tab'))

        Network_UI.Next_H_Block()

        p = Network_UI.Add_plot(x_label='Excitation', y_label='Inhibition')
        self.scatter = pg.ScatterPlotItem()
        p.addItem(self.scatter)

    def update(self, Network_UI):
        if self.my_scatter_tab.isVisible():
            group=Network_UI.network[Network_UI.neuron_select_group, 0]

            if hasattr(group, 'excitation') and hasattr(group, 'inhibition'):
                exc = np.array(group['n.excitation', 0][-1000:])
                inh = np.array(group['n.inhibition', 0][-1000:])

                exc = np.mean(exc, axis=0)
                inh = np.mean(inh, axis=0)

                self.scatter.setData(exc, inh)

...

NUI.Network_UI(my_Network, label='My Network', group_display_count=1, modules=[
    UI_sidebar_activity_module(1),
    my_scatter_tab(),#<---- add new tab object
    info_tab(),
    sidebar_fast_forward_module(),
    sidebar_save_load_module()
]).show()