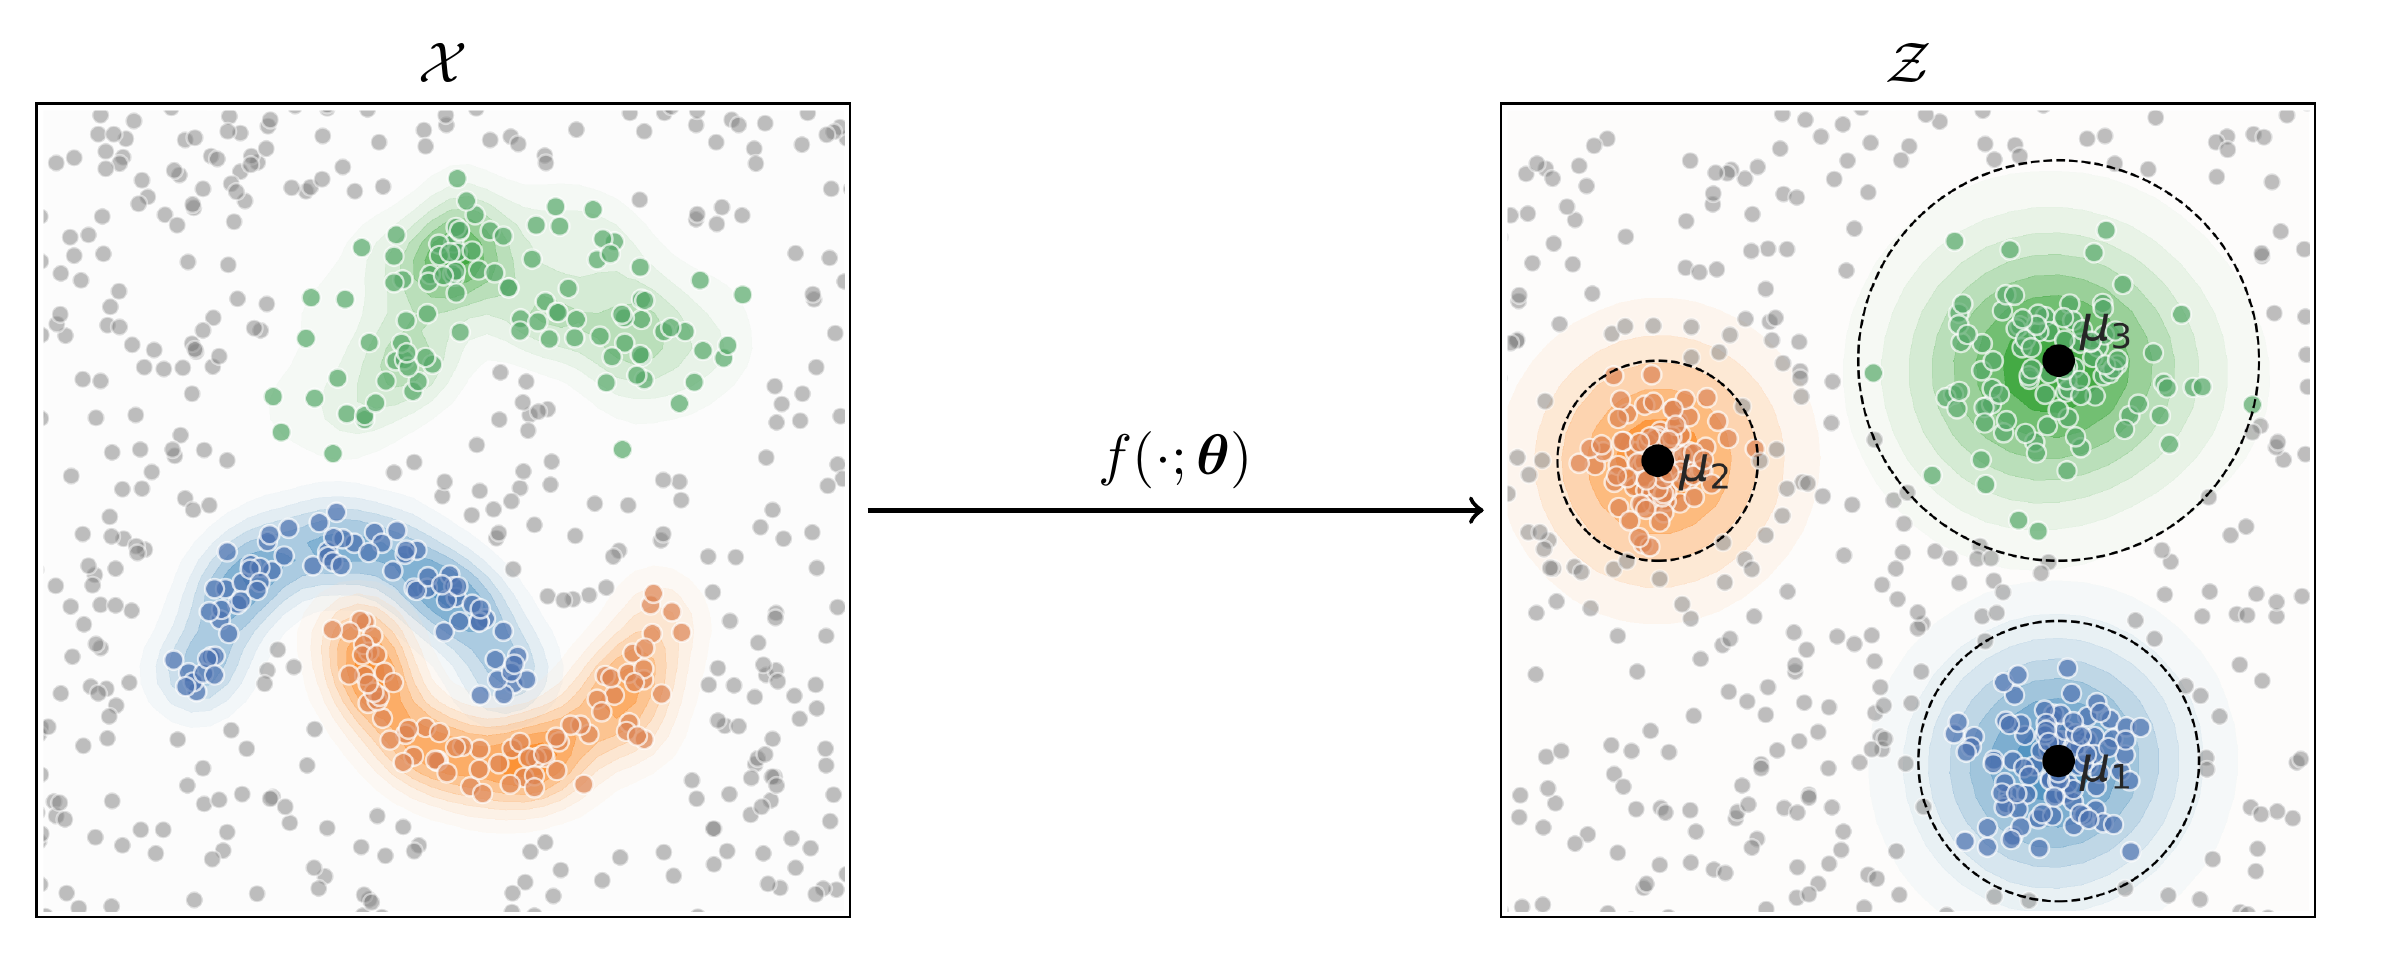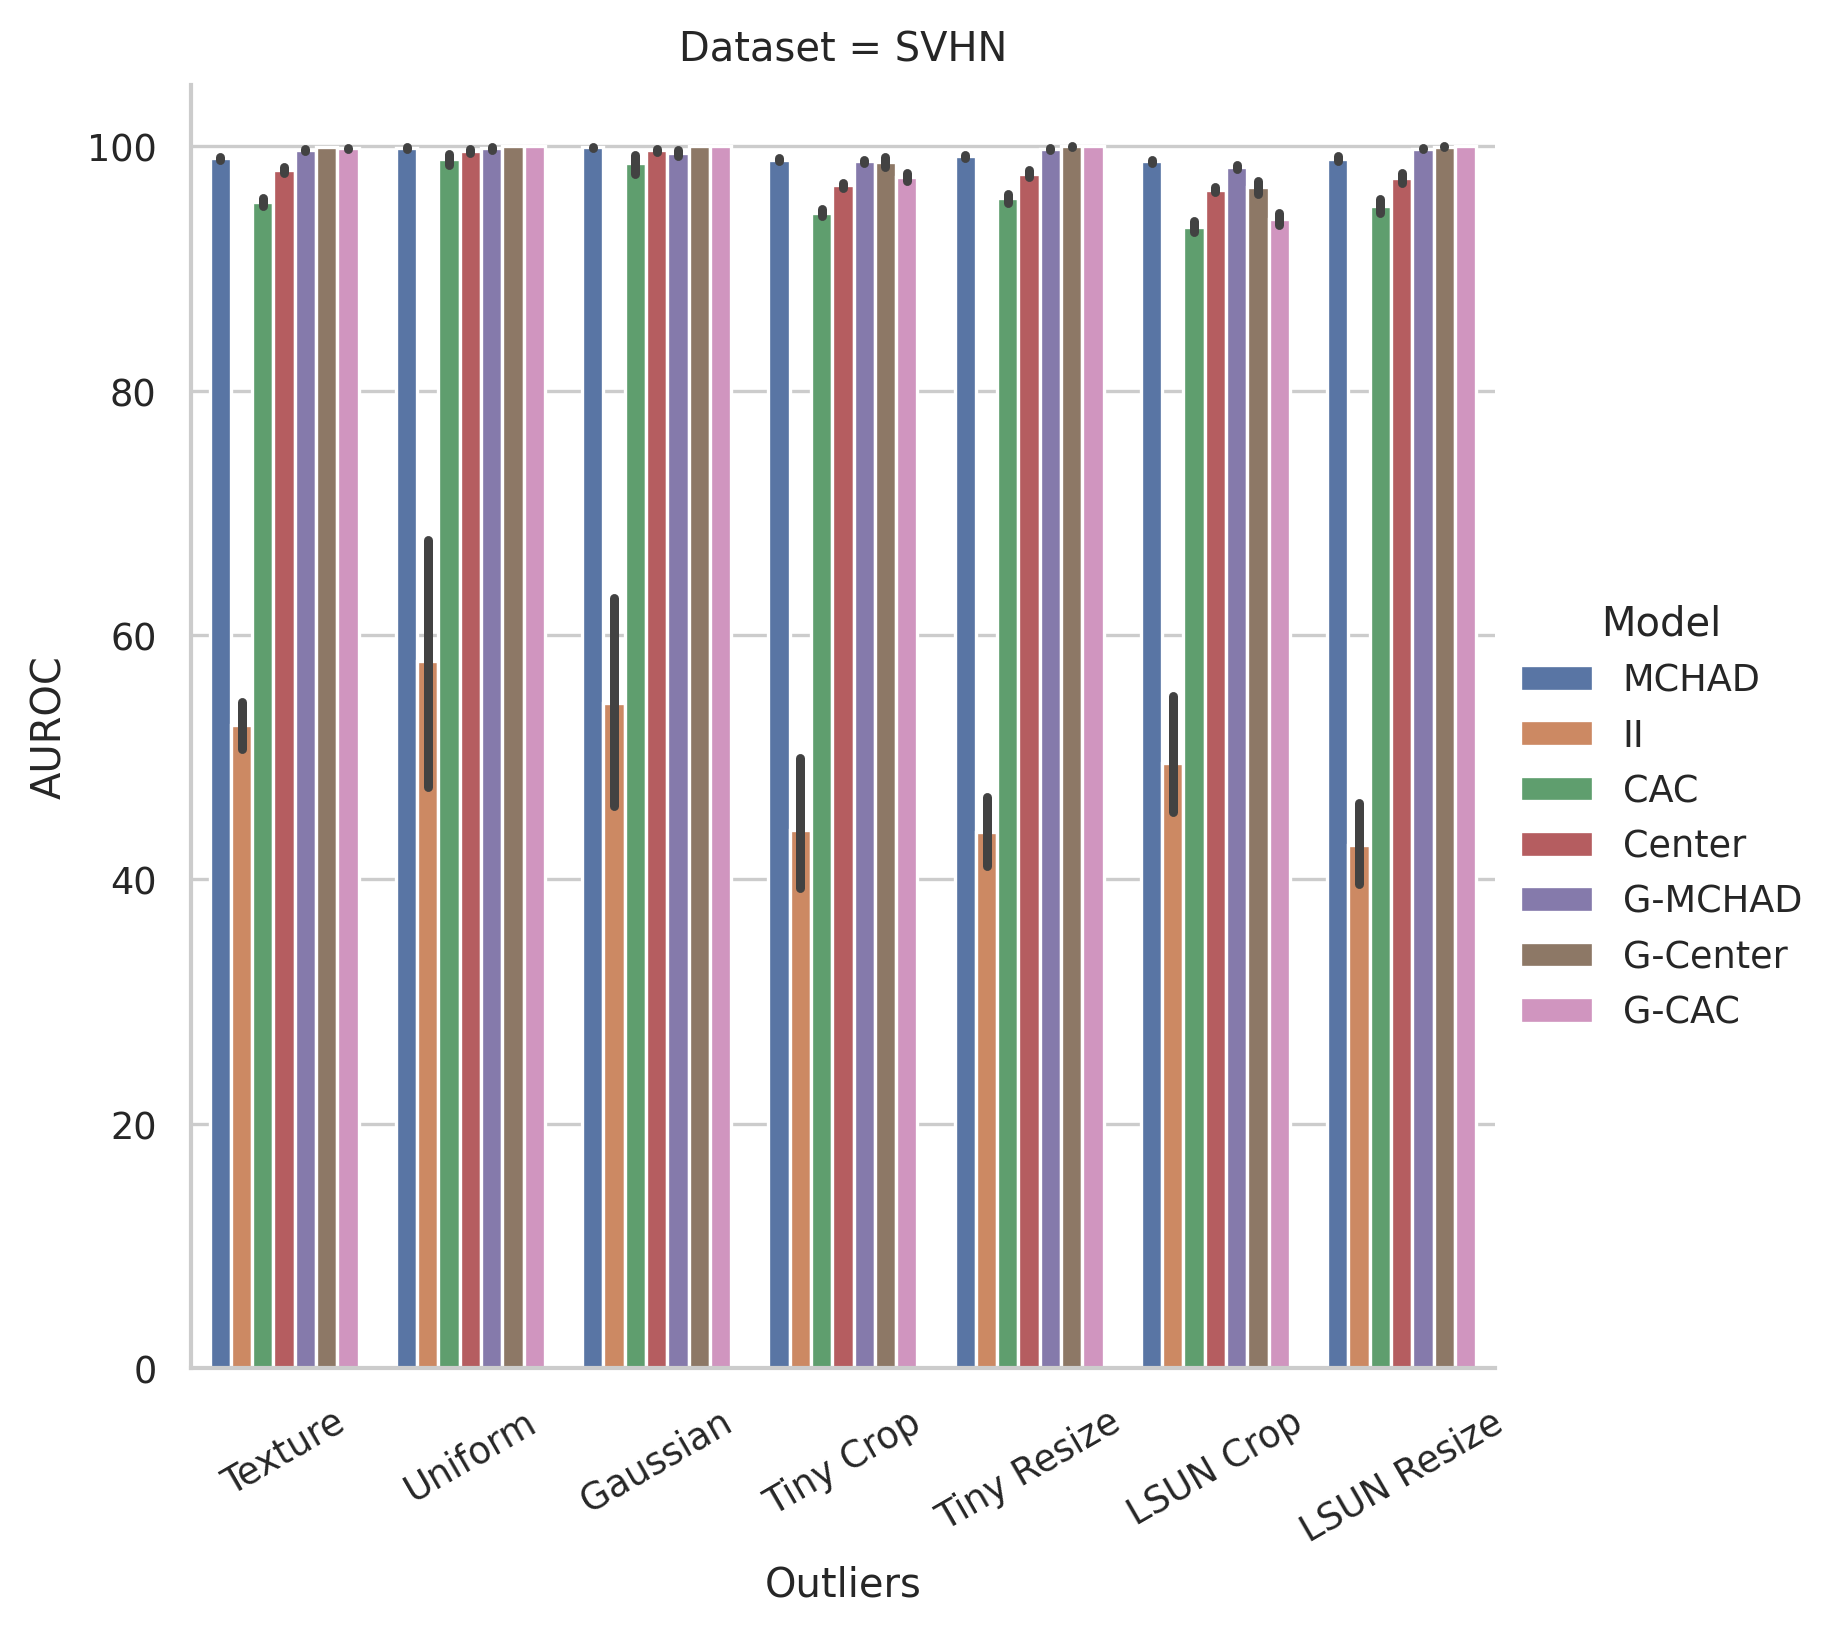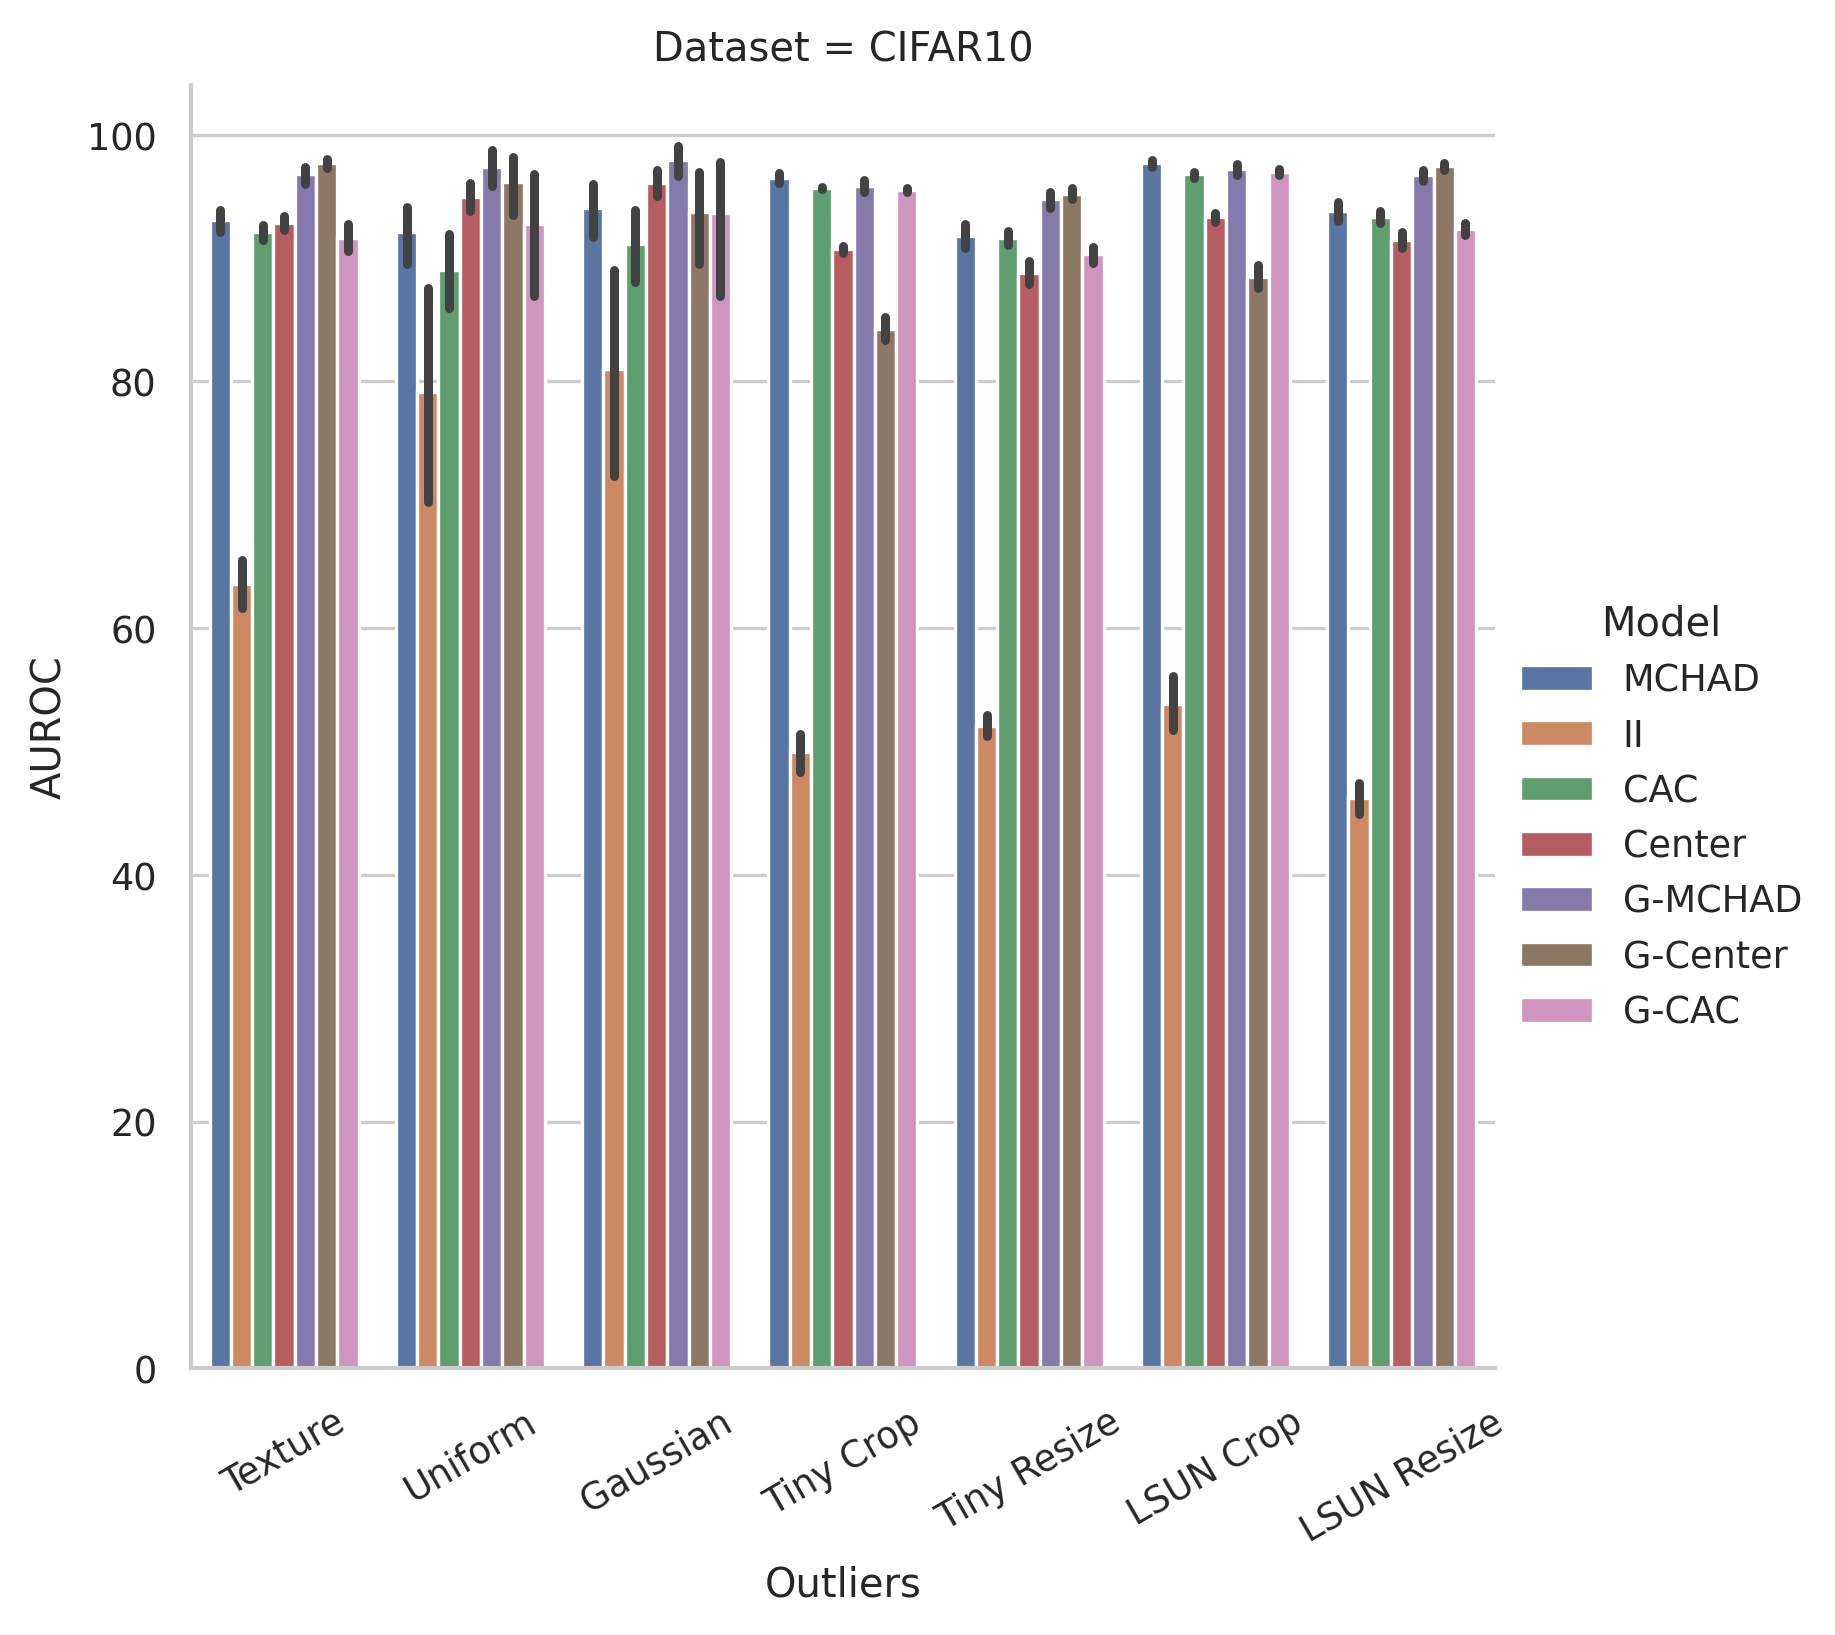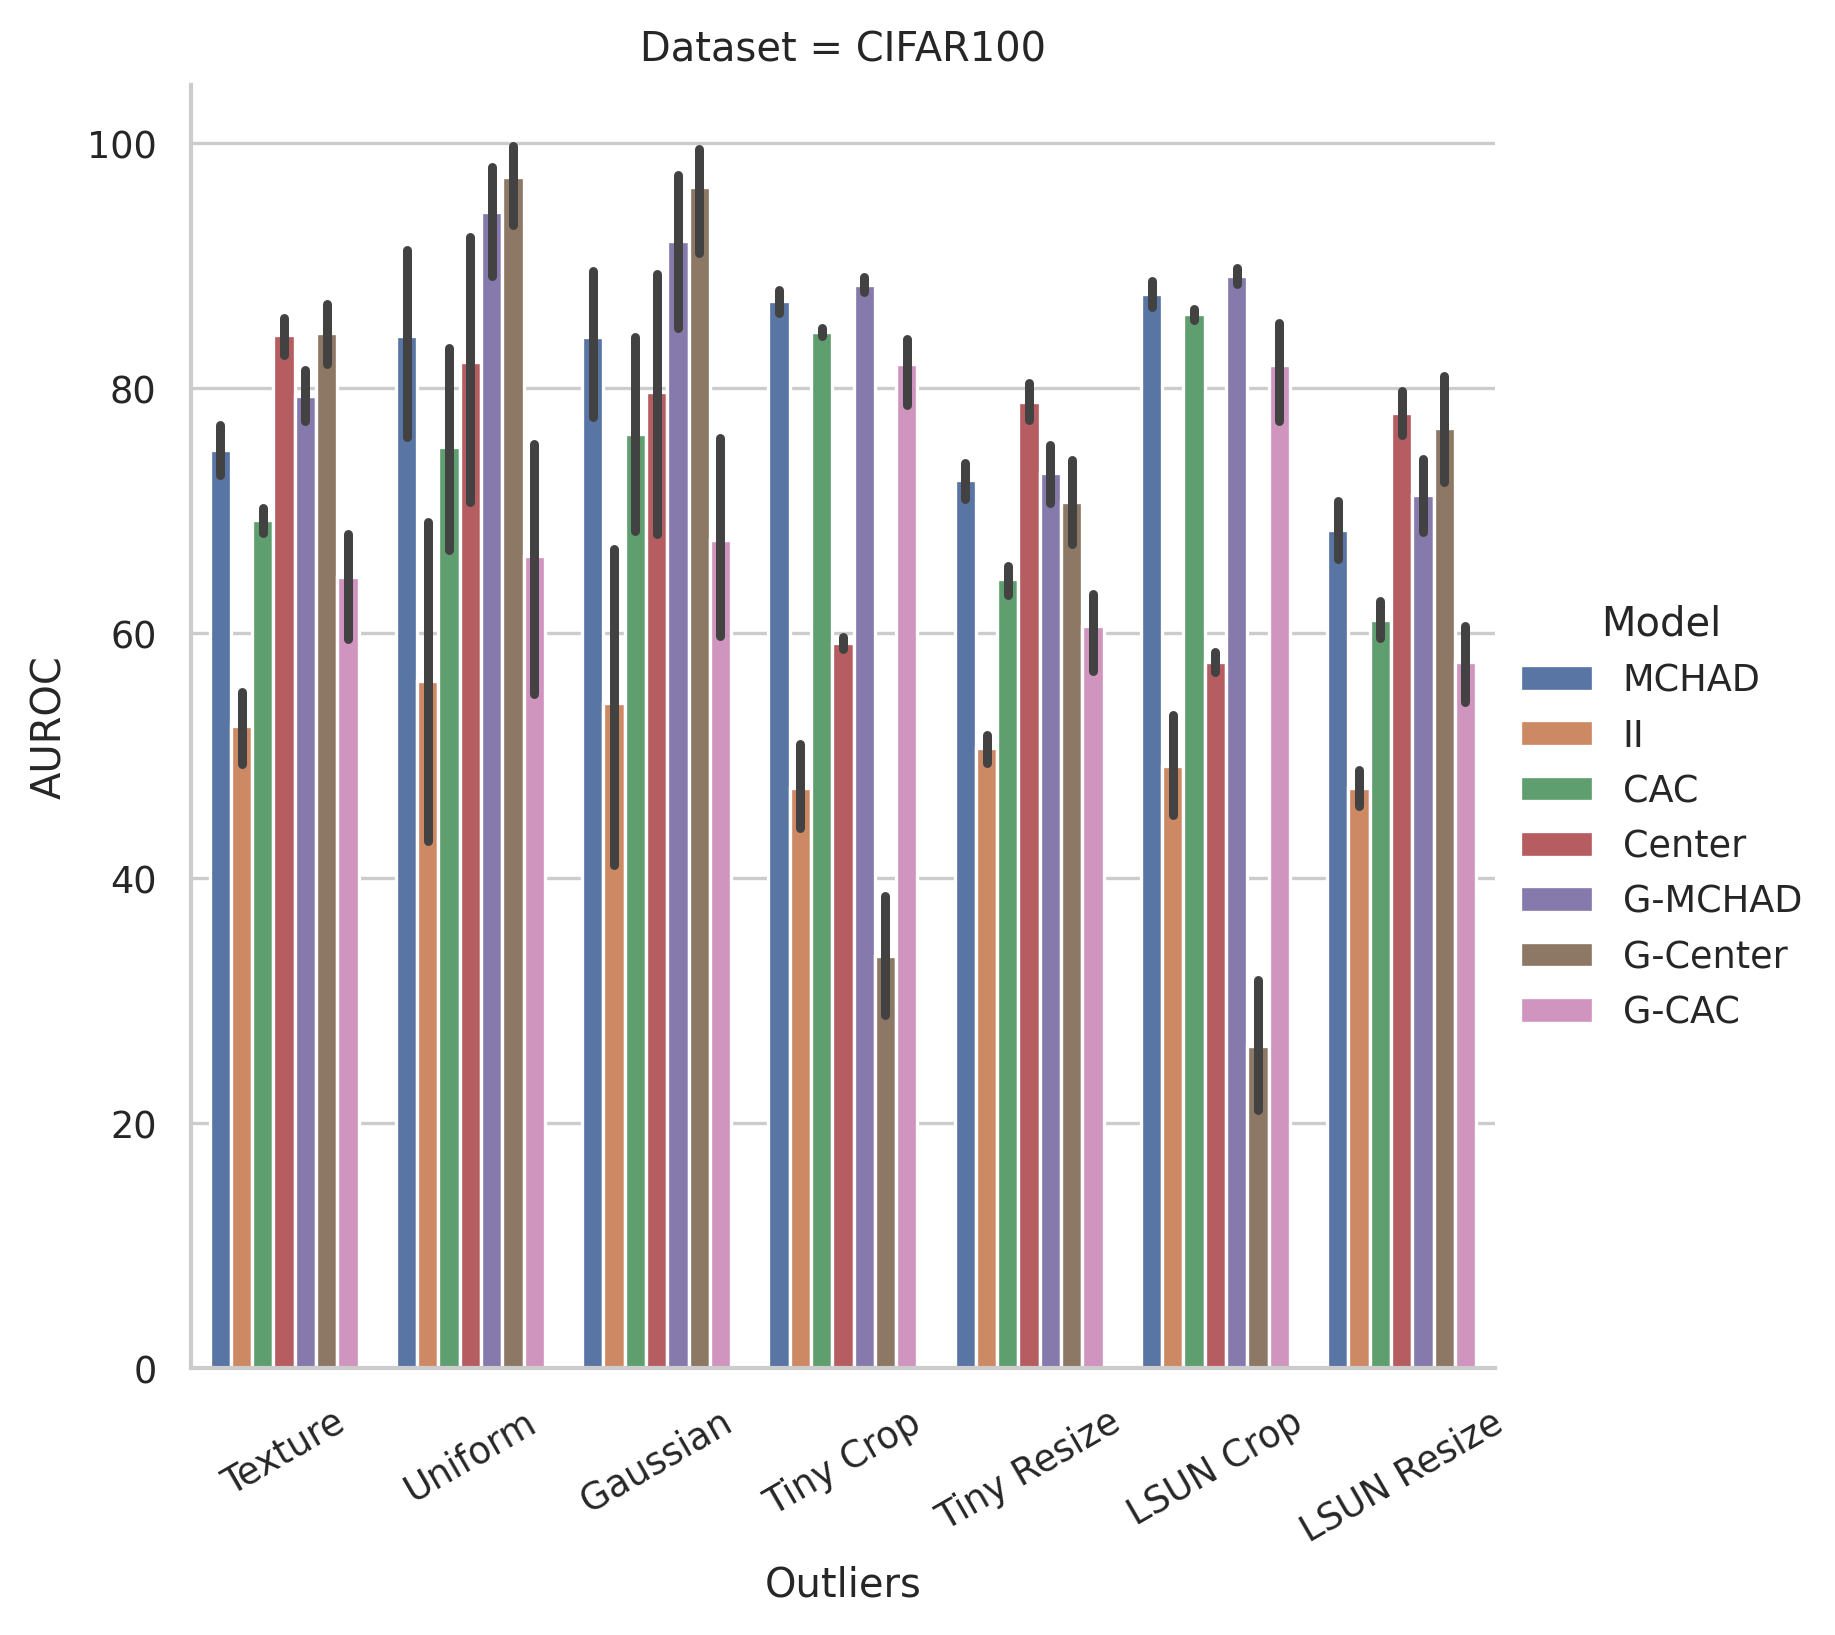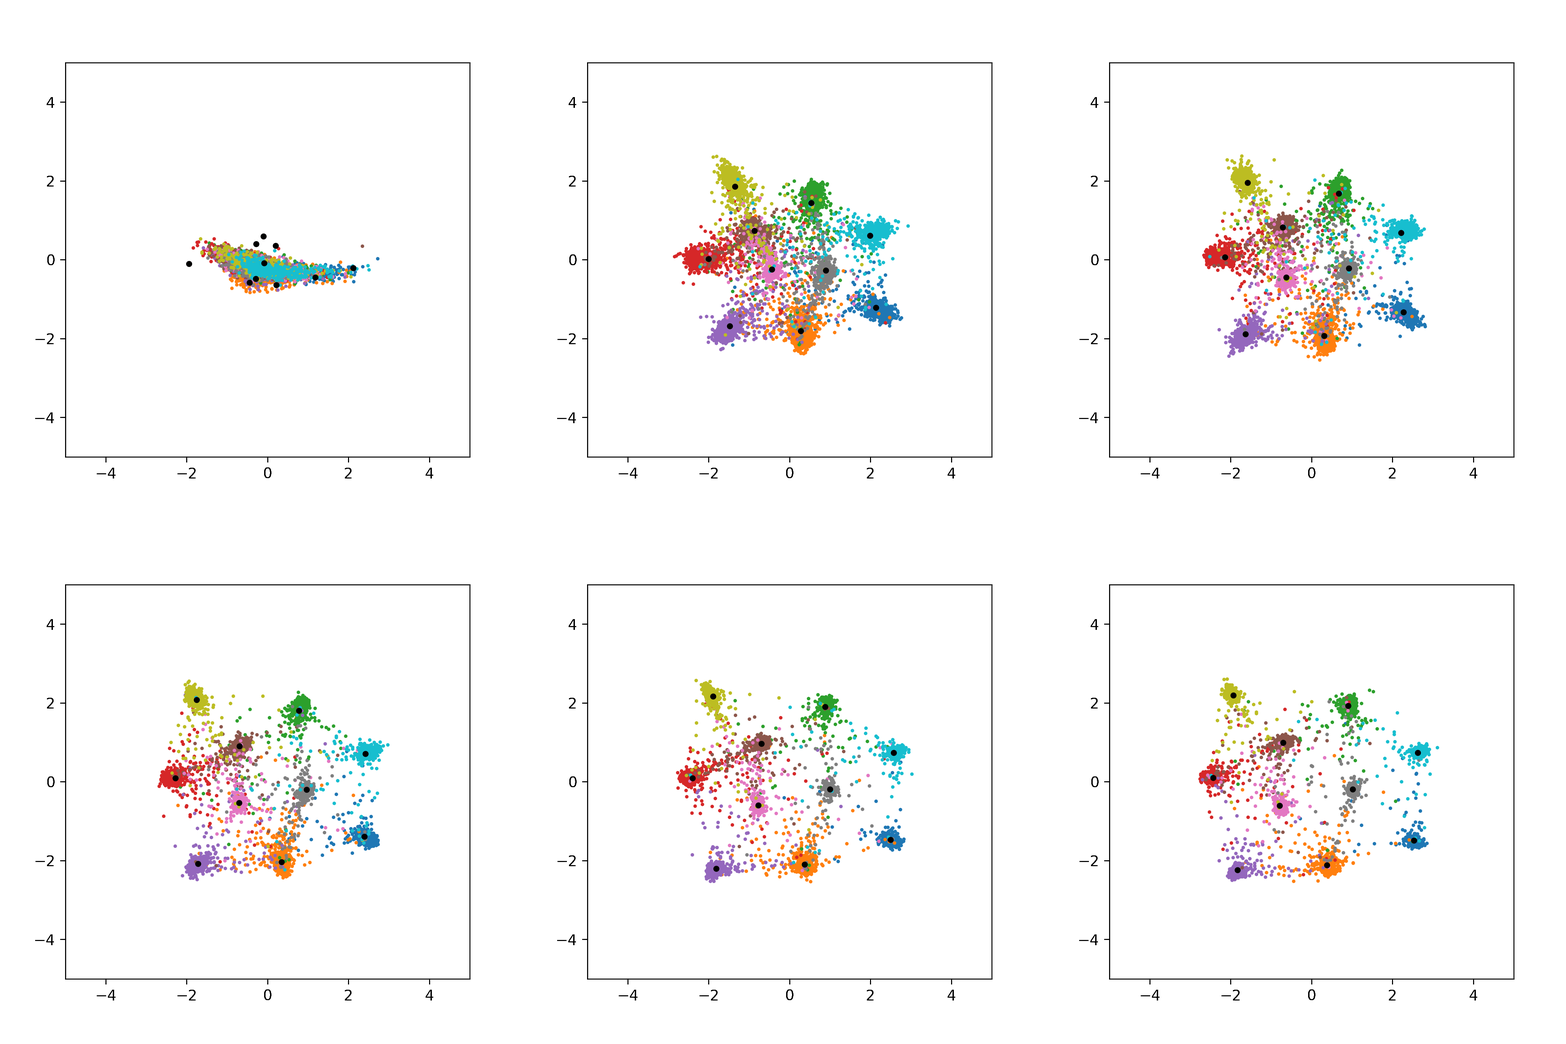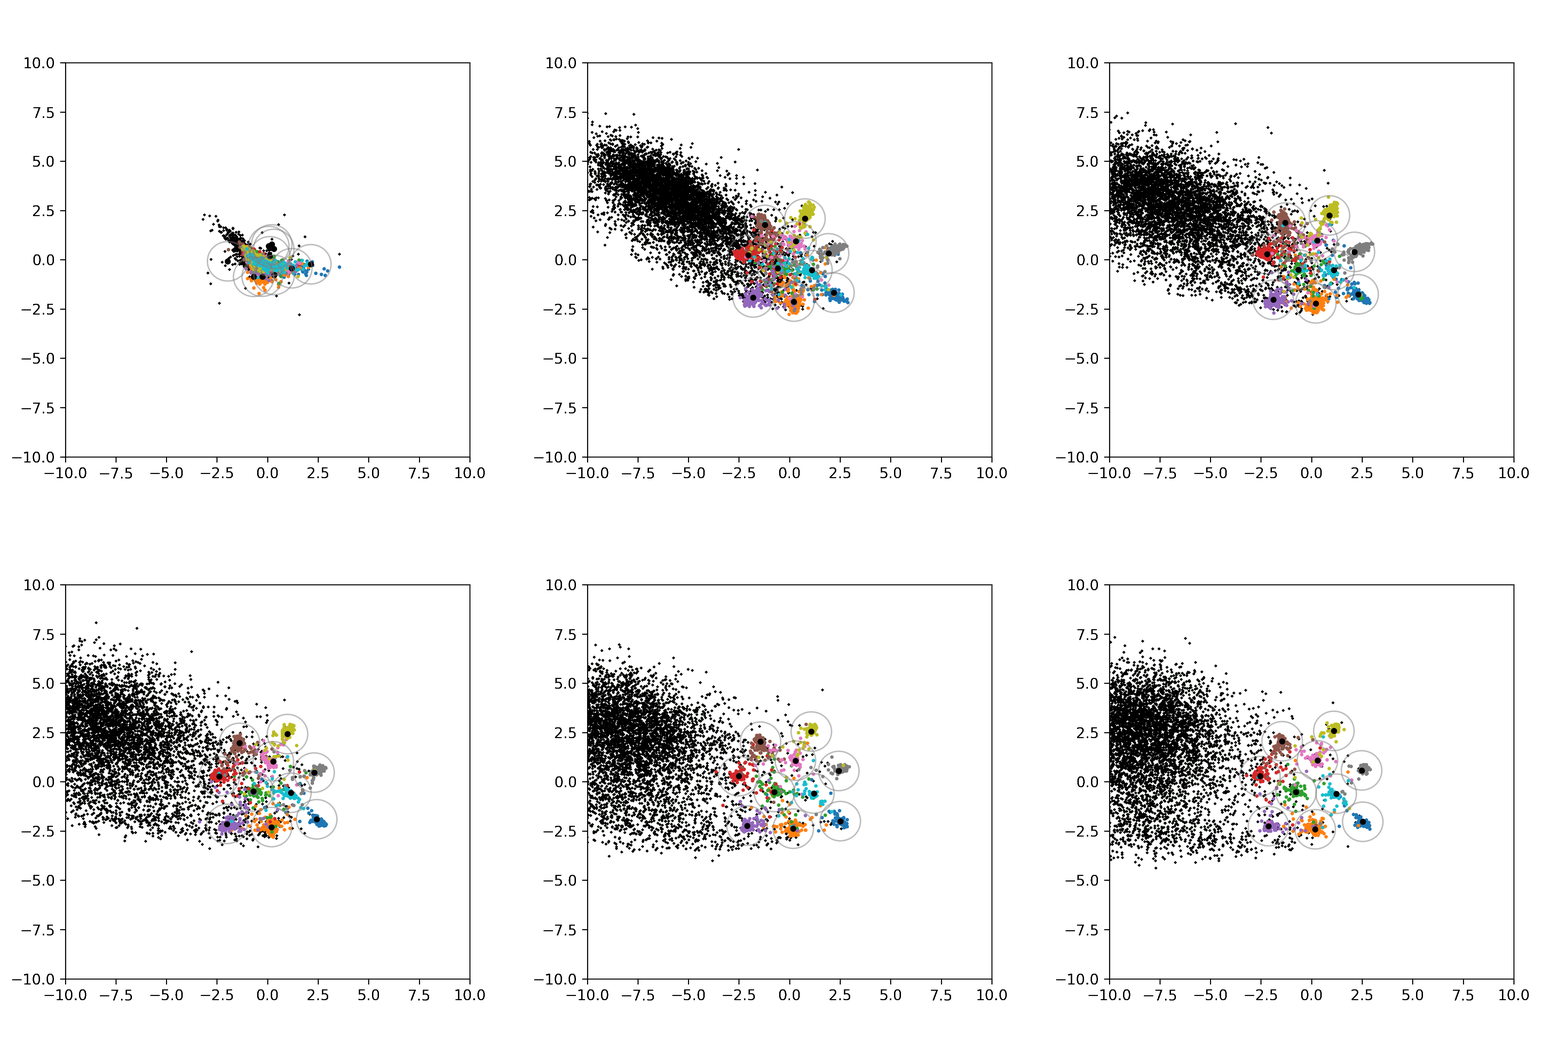


This Repository contains the source code for the paper Multi-Class Hypersphere Anomaly Detection as presented at ICPR 2022.
You can find a minimal example here.
This repository is a fork of the lightning-hydra-template, so you might want to read their excellent instructions on how to use this software stack. Most of the implemented methods and datasets are taken from pytorch-ood.
# setup environment
conda env create --name mchad -f environment.yaml
conda activate mchad

# these would lead to conflicts or have been installed later
pip install aiohttp==3.7 async-timeout==3.0.1 tensorboardX==2.5.1
Experiments are defined in config/experiments.
To run MCHAD on CIFAR10 run:
python run.py experiment=cifar10-mchad
Each experiment will create a results.csv file that contains metrics for all datasets, as
well as a CSV log of the metrics during training, and a TensorBoard log.
You can override configuration parameters via the command line, such as:
python run.py experiment=cifar10-mchad trainer.gpus=1to train on the GPU.
You can run experiments for multiple random seeds in parallel with hydra sweeps:
python run.py -m experiment=cifar10-mchad trainer.gpus=1 seed="range(1,22)"We configured the Ray Launcher for parallelization.
Per default, we run experiments in parallel on 21 GPUs.
You might have to adjust config/hydra/launcher/ray.yaml.
To visualize the embeddings of MCHAD, you can use the following callback:
python run.py experiment=cifar10-gmchad callbacks=mchad_embeds.yamlThis callback will save the embeddings to the tensorboard in TSV format.
Download Pre-Trained Weights used for models:
wget -P data "https://github.com/hendrycks/pre-training/raw/master/uncertainty/CIFAR/snapshots/imagenet/cifar10_excluded/imagenet_wrn_baseline_epoch_99.pt"Experiments can be replicated by running bash/run-rexperiments.sh,
which also accepts command line overrides, such as:
bash/run-rexperiments.sh dataset_dir=/path/to/your/dataset/directory/
All datasets will be downloaded automatically to the given dataset_dir.
Results for each run will be written to csv files which have to be aggregated.
You can find the scripts in notebooks/eval.ipynb.
To replicate the ablation experiments, run:
bash/run-ablation.sh dataset_dir=/path/to/your/dataset/directory/We average all results over 21 seed replicates and several benchmark outlier datasets.
| Accuracy | AUROC | AUPR-IN | AUPR-OUT | FPR95 | |||||||
|---|---|---|---|---|---|---|---|---|---|---|---|
| mean | sem | mean | sem | mean | sem | mean | sem | mean | sem | ||
| Dataset | Model | ||||||||||
| CIFAR10 | CAC | 95.17 | 0.01 | 92.81 | 0.38 | 88.14 | 0.77 | 94.84 | 0.23 | 18.87 | 0.76 |
| Center | 94.45 | 0.01 | 92.59 | 0.25 | 88.93 | 0.36 | 92.66 | 0.38 | 29.75 | 1.58 | |
| G-CAC | 94.98 | 0.03 | 93.33 | 0.59 | 90.33 | 0.72 | 94.78 | 0.42 | 19.95 | 1.18 | |
| G-Center | 94.28 | 0.02 | 93.29 | 0.51 | 89.27 | 0.83 | 94.77 | 0.40 | 19.19 | 1.19 | |
| G-MCHAD | 94.69 | 0.01 | 96.69 | 0.19 | 94.31 | 0.40 | 97.57 | 0.13 | 10.27 | 0.52 | |
| II | 28.41 | 0.19 | 60.83 | 1.41 | 59.18 | 1.34 | 63.24 | 1.47 | 78.18 | 2.41 | |
| MCHAD | 94.83 | 0.02 | 94.15 | 0.32 | 89.61 | 0.65 | 95.80 | 0.22 | 16.18 | 0.80 | |
| CIFAR100 | CAC | 75.67 | 0.02 | 73.85 | 1.12 | 68.82 | 1.24 | 77.90 | 0.97 | 59.91 | 1.92 |
| Center | 76.59 | 0.02 | 74.26 | 1.41 | 69.04 | 1.37 | 78.16 | 1.25 | 57.64 | 2.32 | |
| G-CAC | 69.99 | 0.94 | 68.67 | 1.34 | 64.88 | 1.32 | 73.20 | 1.11 | 66.95 | 1.85 | |
| G-Center | 67.94 | 0.11 | 69.38 | 2.35 | 75.34 | 1.70 | 69.52 | 2.04 | 66.75 | 3.40 | |
| G-MCHAD | 77.14 | 0.02 | 83.96 | 0.97 | 80.56 | 1.03 | 86.27 | 0.90 | 45.17 | 2.38 | |
| II | 5.90 | 0.07 | 51.05 | 1.46 | 50.56 | 1.11 | 55.79 | 1.27 | 86.72 | 1.88 | |
| MCHAD | 77.52 | 0.02 | 79.88 | 0.97 | 72.59 | 1.11 | 84.18 | 0.81 | 48.83 | 2.05 | |
| SVHN | CAC | 94.56 | 0.03 | 95.97 | 0.18 | 89.05 | 0.44 | 97.68 | 0.14 | 14.60 | 1.02 |
| Center | 96.06 | 0.01 | 97.96 | 0.11 | 94.15 | 0.24 | 98.89 | 0.08 | 6.35 | 0.31 | |
| G-CAC | 94.22 | 0.03 | 98.77 | 0.18 | 97.84 | 0.31 | 99.12 | 0.13 | 5.67 | 0.97 | |
| G-Center | 95.87 | 0.01 | 99.33 | 0.11 | 98.29 | 0.28 | 99.69 | 0.05 | 2.60 | 0.41 | |
| G-MCHAD | 95.69 | 0.01 | 99.38 | 0.05 | 97.24 | 0.24 | 99.80 | 0.02 | 2.14 | 0.18 | |
| II | 10.59 | 0.11 | 49.32 | 1.25 | 27.95 | 1.00 | 74.65 | 0.80 | 86.42 | 1.64 | |
| MCHAD | 95.81 | 0.01 | 99.22 | 0.04 | 97.12 | 0.14 | 99.74 | 0.02 | 3.16 | 0.20 | |
experiment=svhn-mchad trainer.gpus=1 model.weight_center=10.0 trainer.min_epochs=100 model.n_embedding=2experiment=svhn-gmchad trainer.gpus=1 model.weight_center=10.0 trainer.min_epochs=100 model.n_embedding=2If you use this code, please consider citing us:
@article{kirchheim2022multi,
	author = {Kirchheim, Konstantin and Filax, Marco and Ortmeier, Frank},
	journal = {International Conference on Pattern Recognition},
	number = {},
	pages = {},
	publisher = {IEEE},
	title = {Multi-Class Hypersphere Anomaly Detection},
	year = {2022}
}
