This repository stores my simple data-mining scripts. These tasks were implemented in the scope of my university study at the 4th course. The repository contains only Python scripts. You may need additional (very popular and easy to install) Python libraries. Such as:
- matplotlib
- networkx
- numpy
- nltk
- pandas
I won't list all of them here, because I'm sure you will figure out what libraries you require and how to install them
on your own.
The "purple" word was added to the repository name just to differ the repository from my other possible data-mining
repositories.
The repository consist of five parts:
All these parts have their own folder where you find everything you need to run the scripts.
In this part I made a data statistical analysis of the file sms-spam-corpus.csv. This file contains spam and ham
sms.
The part consist of three sub-parts:
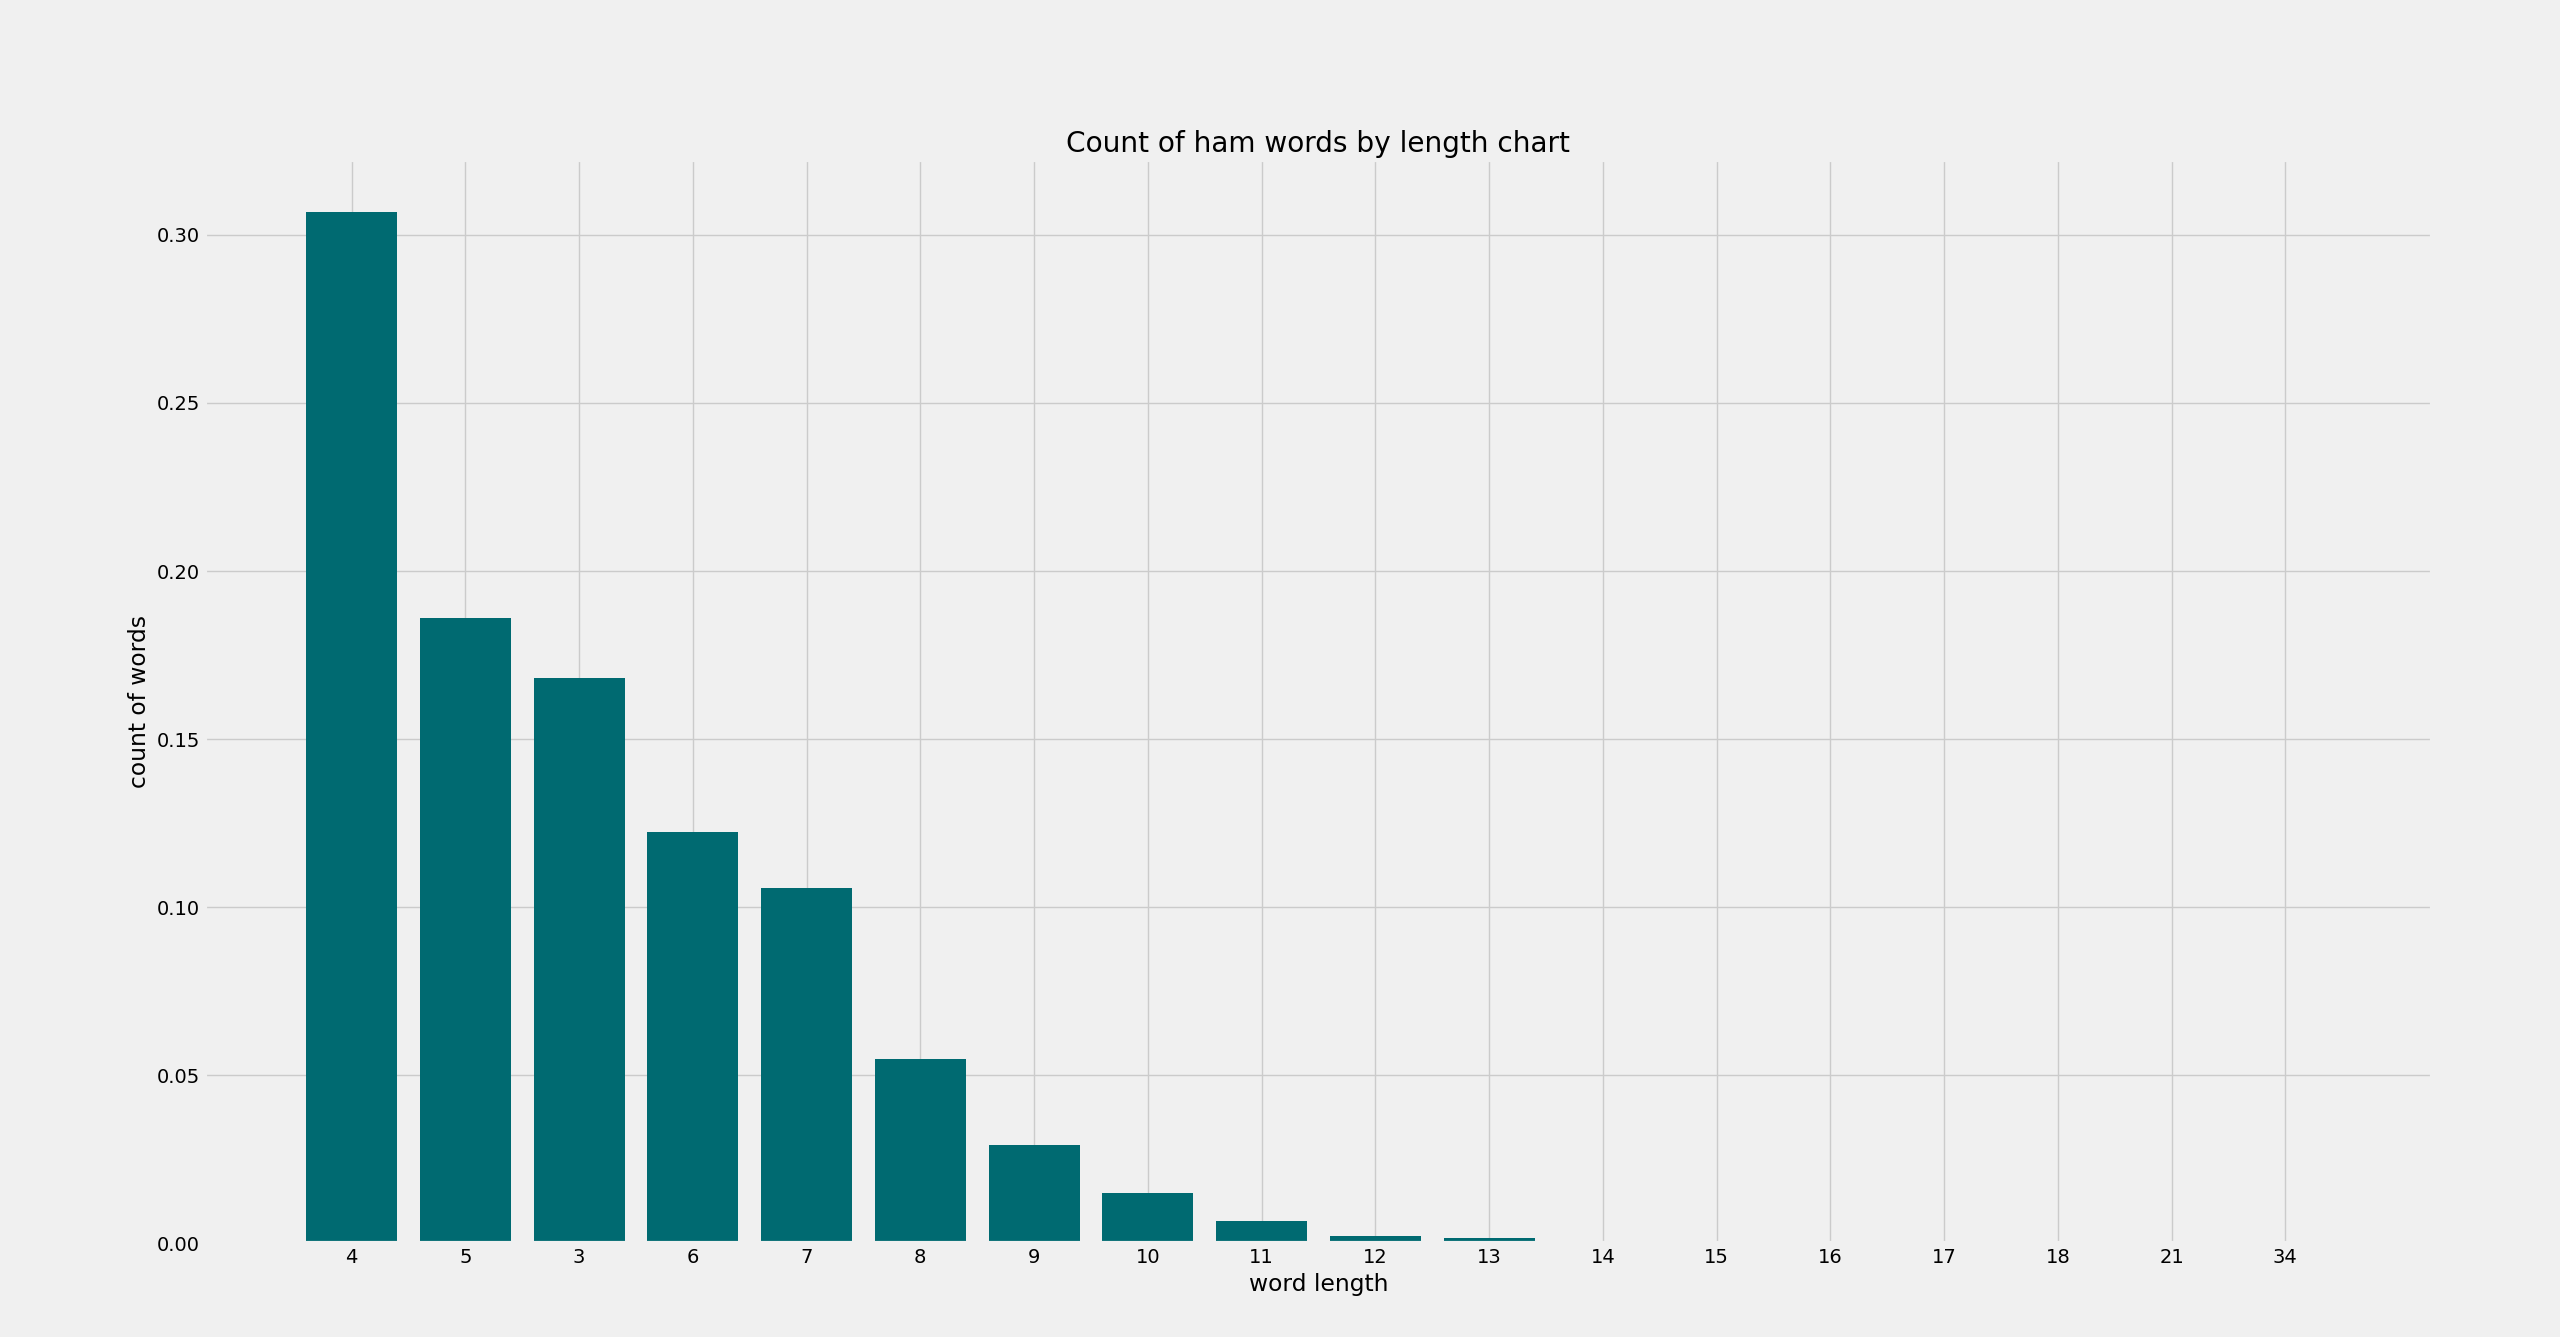
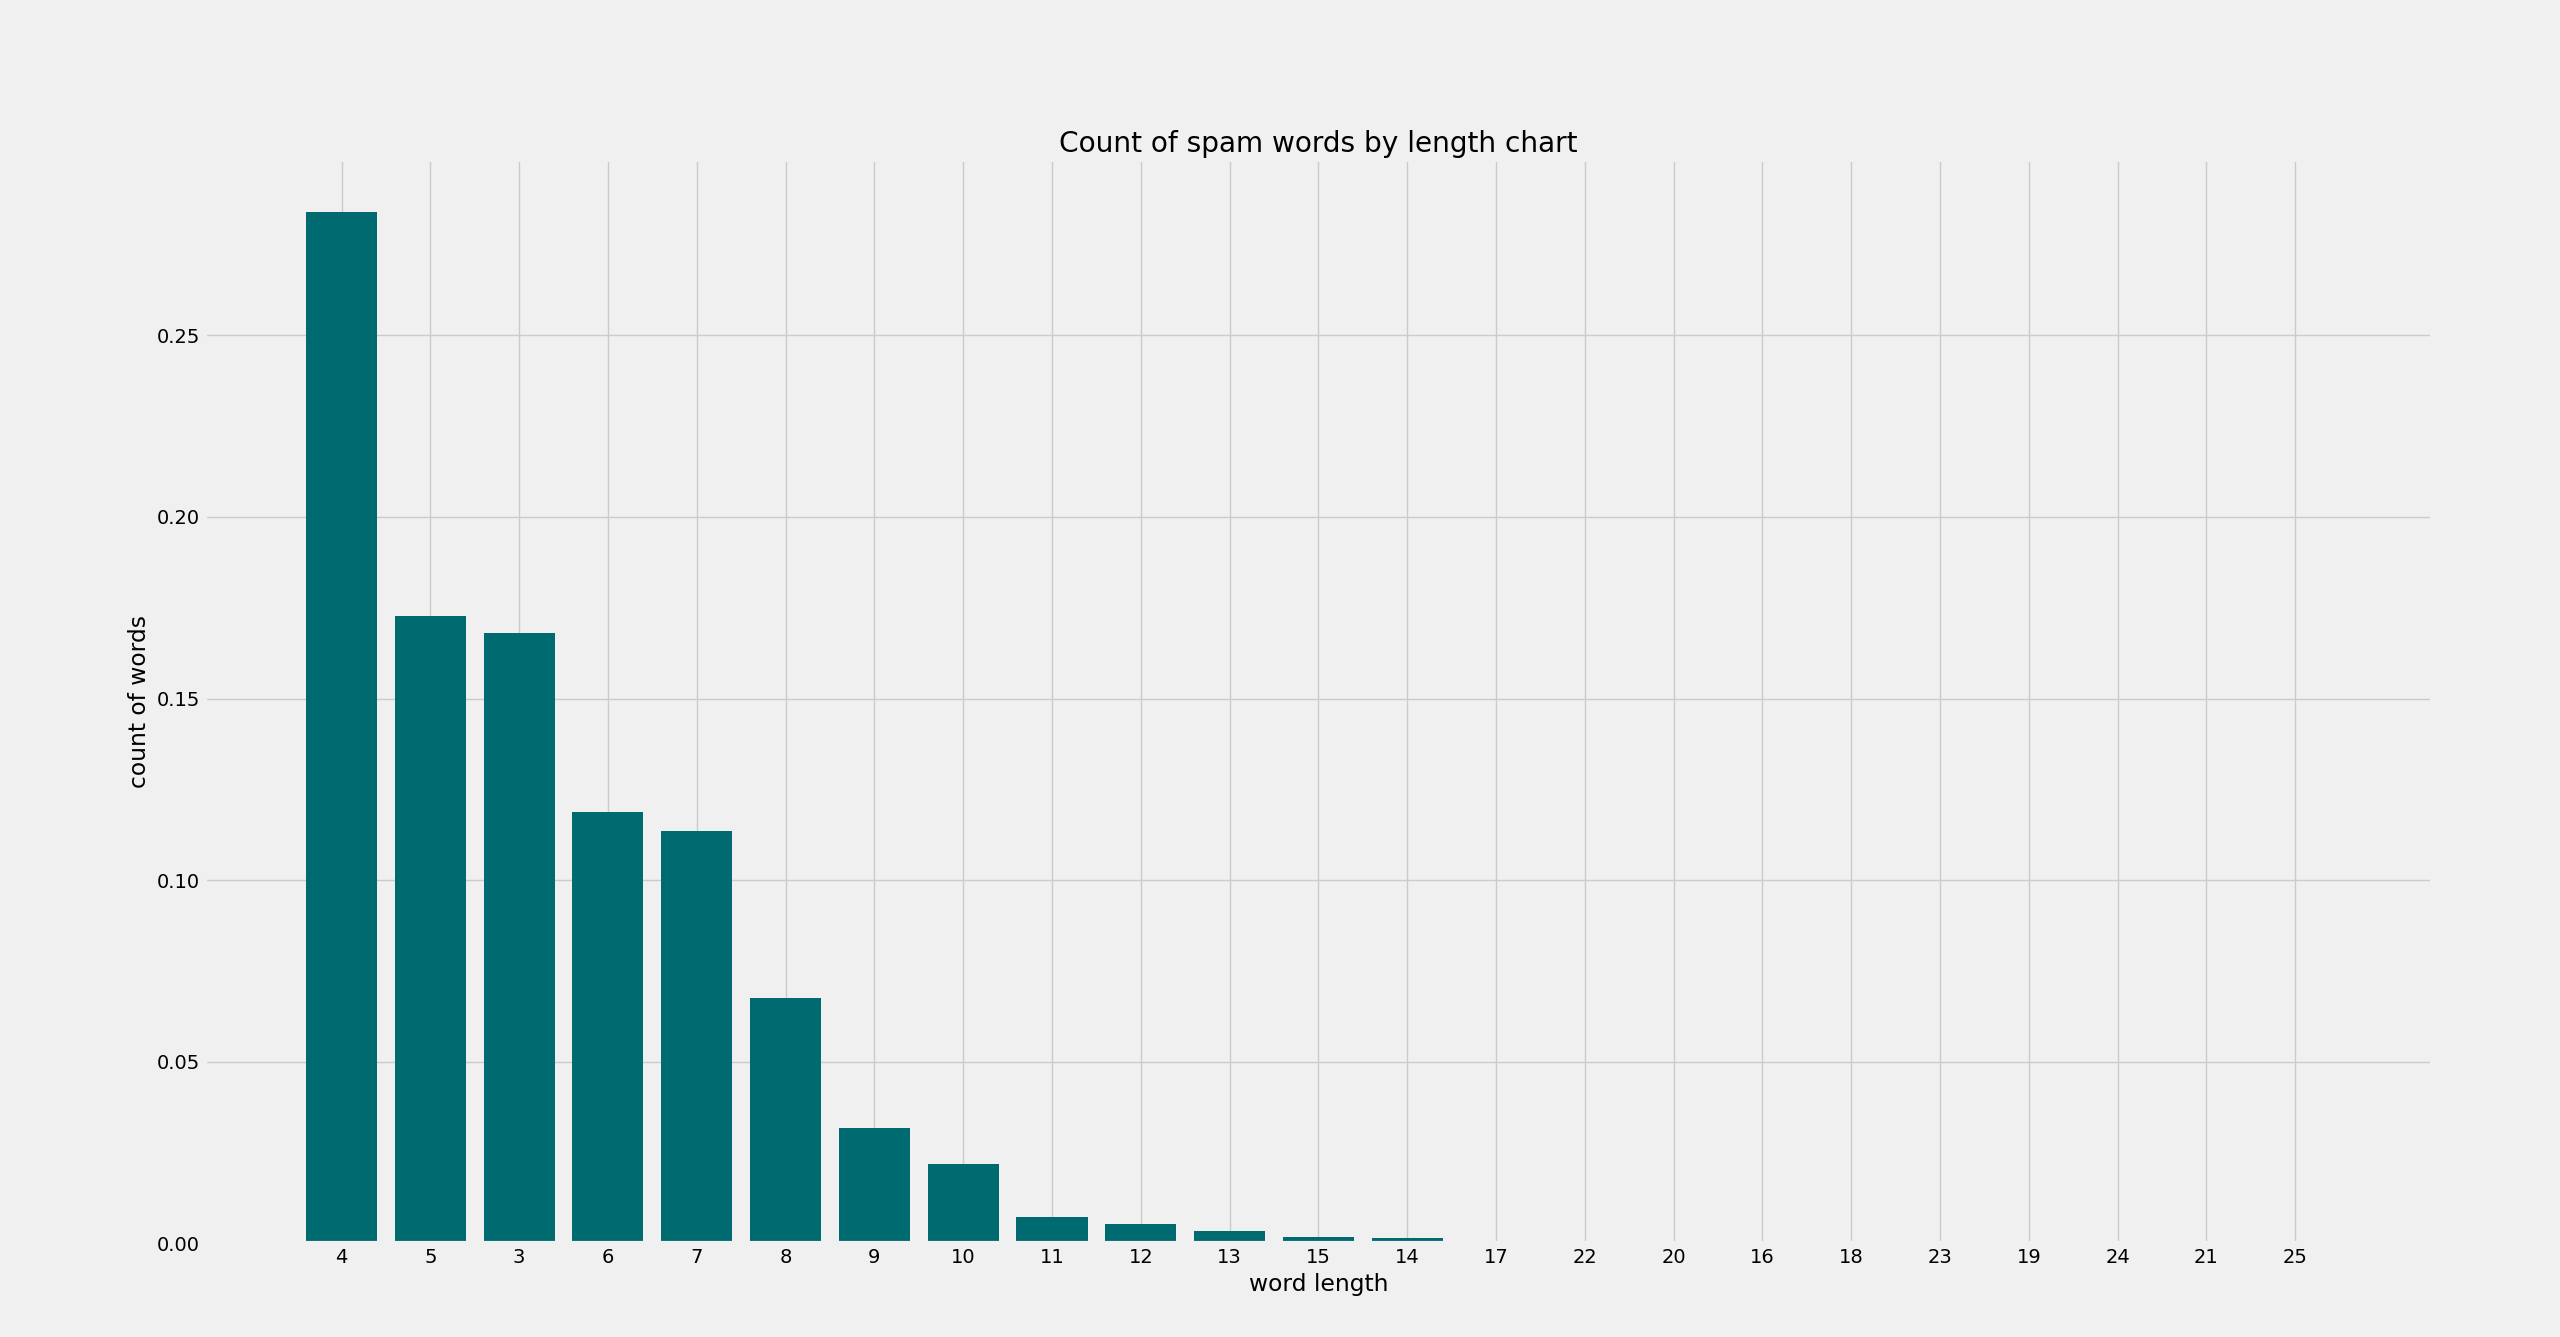
- Plot on the graphs the distribution of word length for each category and the average word length
- Graph the distribution of message lengths for each category and the average message length
- Conduct a frequency analysis of the appearance of words for two categories. Display on the graphs 20 words that are most common for each category separately
You must run the data_processor.py before running the other
scripts.
python data_processor.py
Then, choose the part you need and ran the script. For example, I will run the first sub-part:
python task_1_word_len_plot.py
After this, the script will show two plots (for ham and for spam words).
You can find the average word length in the console (terminal) output:
Average word length for spam is 5.339024390243902
Average word length for ham is 5.131272645653637
Also, all three sub-parts scripts save their plot in the specific folder.
This part calculates message spam and ham possibility using training data in ham_words_count.csv and spam_words_count.csv files.
Run the script by the next command:
python main.py
Then, you will see the next output:
Welcome to Saint-Tropez
Spam file name is "spam_words_count.csv"
Ham file name is "ham_words_count.csv"
Type your message:
You need to specify your message here. For example:
Welcome to Saint-Tropez
Spam file name is "spam_words_count.csv"
Ham file name is "ham_words_count.csv"
Type your message: Hello, world! How it's going?
After this you will see the result:
Preparing message...
Prepared message: "['world', 'go']"
Loading training data from files to memory...
Training data was successfully loaded
Calculating probability for both spam and ham...
Spam probability is "2.0651496689859363e-08"
Ham probability is "3.906686353734016e-08"
Making normalization...
Normalized:
Spam probability is "0.3458148651652589"
Ham probability is "0.6541851348347411"
Classifying the message...
The message "Hello, world! How it's going?" is a HAM
So, in the example above our classifier thinks that the message "Hello, world! How it's going?" is a ham.
In this part, I implemented k-means method for a 2-D array of dots. The example input files you find in
the points_datasets folder.
To run the script use the next command:
python main.py 7 points_datasets/s1.txt
Where:
- 7 - the count of clusters I need (you may choose your own count);
- s1.txt - the file with points data (you may use another file if you want).
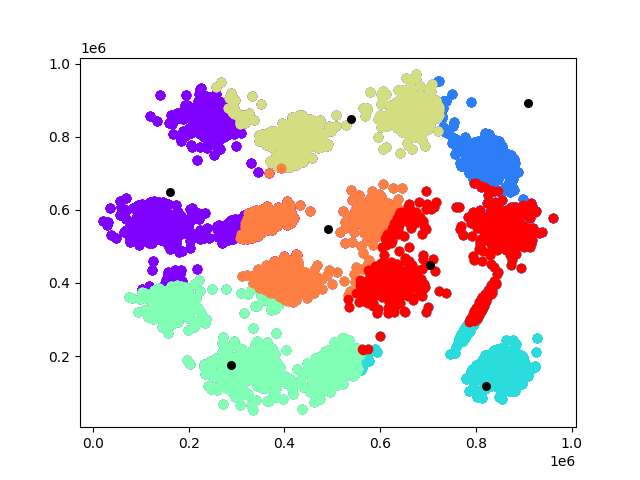
After the execution, you will see the first plot, on which centers were randomly selected, and the dots were spread between them.
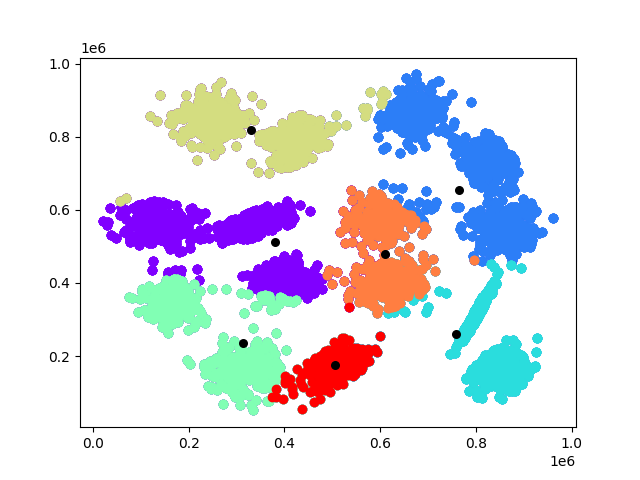
Close this plot and the program will start the classification. After the finish, the program will show you the final plot.
The count of steps needed to finish you will find in the console (terminal) output:
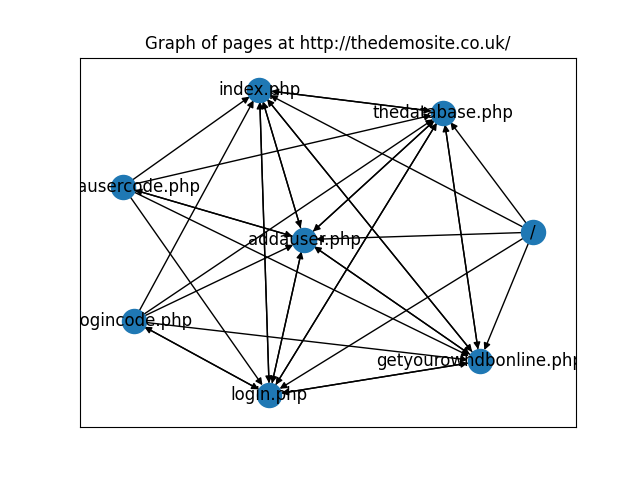
Program used 16 step(-s) to finish.The script builds a page graph of the site and calculates the site's pages rank. You can run the script by the next
command:
python main.py http://thedemosite.co.uk/
For our example, you will see the next graph
The page rank of the pages you will find in the console (terminal) output:
{
  "/": 0.018750000000000003,
  "index.php": 0.17862779158724276,
  "thedatabase.php": 0.17862779158724276,
  "addauser.php": 0.17862779158724276,
  "login.php": 0.17862779158724276,
  "getyourowndbonline.php": 0.17862779158724273,
  "addausercode.php": 0.044055521031893,
  "logincode.php": 0.044055521031893
}In this part I implemented market basket analysis. The analysis may be done
by apriori or by genetic
algorithms.
CAUTION: the apriori script executes too long and has a very big impact on the processor. I don't recommend you to
run it on a big amount of data.
To run the apriori algorithm script use the next command:
python apriori_alg.py 2 test.XLSX
Where:
- 2 - support level (you may choose your own value);
- test.XLSX - the file with purchases data (you may use another file if you want).
After the script execution, you will see the following in your console(terminal):
{
  "('84029G', '85123A', '84030E')": 2,
  "('84029G', '85123A', '84029E')": 2,
  "('84029G', '85123A', '85014B')": 2,
  "('84029G', '85123A', '84625A')": 2,
  "('84029G', '85123A', '85014A')": 2,
  "('84029G', '85123A', '85099F')": 2,
  "('84029G', '84029E', '85014B')": 2,
  "('84029G', '84029E', '84625A')": 2,
  "('84029G', '84029E', '85014A')": 2,
  "('84029G', '84029E', '85099F')": 2,
  "('15056BL', '15056N', '85099B')": 2,
  "('15056BL', '15056N', '85123A')": 2,
  "('15056BL', '15056N', '84030E')": 2,
  "('15056BL', '15056N', '84029E')": 2,
  "('15056BL', '15056N', '85014B')": 2,
  "('15056BL', '15056N', '84625A')": 2,
  "('15056BL', '15056N', '85014A')": 2,
  "('15056BL', '15056N', '85099F')": 2,
  "('85099C', '85099B', '85123A')": 3,
  "('85099C', '85099B', '84030E')": 3,
  "('85099C', '85099B', '84029E')": 3,
  "('85099C', '85099B', '85014B')": 3,
  "('85099C', '85099B', '84625A')": 3,
  "('85099C', '85099B', '85014A')": 3,
  "('85099C', '85099B', '85099F')": 3,
  "('85014B', '85014A', '85099F')": 2,
  "('85099B', '85123A', '84030E')": 2,
  "('85099B', '85123A', '84029E')": 2,
  "('85099B', '85123A', '85014B')": 2,
  "('85099B', '85123A', '84625A')": 2,
  "('85099B', '85123A', '85014A')": 2,
  "('85099B', '85123A', '85099F')": 2,
  "('85123A', '84030E', '84029E')": 2,
  "('85123A', '84030E', '85014B')": 2,
  "('85123A', '84030E', '84625A')": 2,
  "('85123A', '84030E', '85014A')": 2,
  "('85123A', '84030E', '85099F')": 2,
  "('84625C', '84625A', '85014A')": 2,
  "('84625C', '84625A', '85099F')": 2,
  "('84625C', '85169B', '15056N')": 2,
  "('84625C', '85169B', '85099B')": 2,
  "('84625C', '85169B', '85123A')": 2,
  "('84625C', '85169B', '84030E')": 2,
  "('84625C', '85169B', '84029E')": 2,
  "('84625C', '85169B', '85014B')": 2,
  "('84625C', '85169B', '84625A')": 2,
  "('84625C', '85169B', '85014A')": 2,
  "('84625C', '85169B', '85099F')": 2,
  "('85231G', '85231B', '84029G')": 2,
  "('85231G', '85231B', '85099C')": 2,
  "('85231G', '85231B', '85169B')": 2,
  "('85231G', '85231B', '15056N')": 2,
  "('85231G', '85231B', '85099B')": 2,
  "('85231G', '85231B', '85123A')": 2,
  "('85231G', '85231B', '84030E')": 2,
  "('85231G', '85231B', '84029E')": 2,
  "('85231G', '85231B', '85014B')": 2,
  "('85231G', '85231B', '84625A')": 2,
  "('85231G', '85231B', '85014A')": 2,
  "('85231G', '85231B', '85099F')": 2,
  "('85231G', '85099B', '85123A')": 2,
  "('85231G', '85099B', '84030E')": 2,
  "('85231G', '85099B', '84029E')": 2,
  "('85231G', '85099B', '85014B')": 2,
  "('85231G', '85099B', '84625A')": 2,
  "('85231G', '85099B', '85014A')": 2,
  "('85231G', '85099B', '85099F')": 2,
  "('85231B', '85099B', '85123A')": 2,
  "('85231B', '85099B', '84030E')": 2,
  "('85231B', '85099B', '84029E')": 2,
  "('85231B', '85099B', '85014B')": 2,
  "('85231B', '85099B', '84625A')": 2,
  "('85231B', '85099B', '85014A')": 2,
  "('85231B', '85099B', '85099F')": 2
}
Where the key is a triple of products, and the value is the count of this triple popularity in the baskets.
To run the genetic algorithm script use the next command:
python genetic_alg.py "Filtered Online Retail.xlsx"
Where:
- Filtered Online Retail.xlsx - the file with purchases data (you may use another file if you want).
After the script execution, you will see the TOP-10 product triples in your console(terminal):
 [
  [
    "20728",
    "20726",
    "22382",
    180
  ],
  [
    "21928",
    "85099B",
    "22386",
    130
  ],
  [
    "22423",
    "22697",
    "47566",
    126
  ],
  [
    "85099C",
    "23199",
    "85099B",
    123
  ],
  [
    "22423",
    "22697",
    "85123A",
    104
  ],
  [
    "23199",
    "23344",
    "22382",
    86
  ],
  [
    "20728",
    "20726",
    "21212",
    84
  ],
  [
    "21928",
    "85099B",
    "20713",
    84
  ],
  [
    "22423",
    "22697",
    "21212",
    78
  ],
  [
    "20728",
    "20726",
    "22086",
    78
  ]
]- Name: Evgeniy Kiprenko
- Email: zhenyakiprenko@gmail.com
