This is a console debugger for use with sketches running on an embedded Arduino system. After uploading your sketch to the Arduino, you can connect the serial port to your computer and debug your running sketch with this application.
You must include a small debugging library (dbg.cpp and PyArduinoDebug.h) available at
https://github.com/kimballa/PyArduinoDebug in your application.
- Arduino IDE users can include the
PyArduinoDebuglibrary in their sketch dependencies. - If compiling with a Makefile, you should
#include <PyArduinoDebug.h>and link withlibPyArduinoDebug.ato enable debugging your sketch.
You will find instructions in PyArduinoDebug.h on the API for creating unconditional
and assertion-based breakpoints, and emitting debug and trace messages.
- Install this debugger and its dependencies with
pip install arduino-dbgor if you have checked out the source on github with:pip install . - If not already installed, install
binutilsthrough your OS package manager (apt,yum, ...). - Add the
PyArduinoDebuglibrary to your project in the Arduino IDE, or clone and build the Arduino library withmake install. - Follow instructions in
PyArduinoDebug.hto include in your application. - Run
arduino-dbgto launch the debug console. Use-hto see CLI options. - Set your Arduino platform: e.g.:
set arduino.platform = uno - Use the
helpcommand at the prompt to see available capabilities.
Typical usage is something like:
arduino-dbg -f /path/to/sketch.elf -p /dev/ttyACM0
(Assuming your Arduino's USB serial port connection is on ttyACM0.)
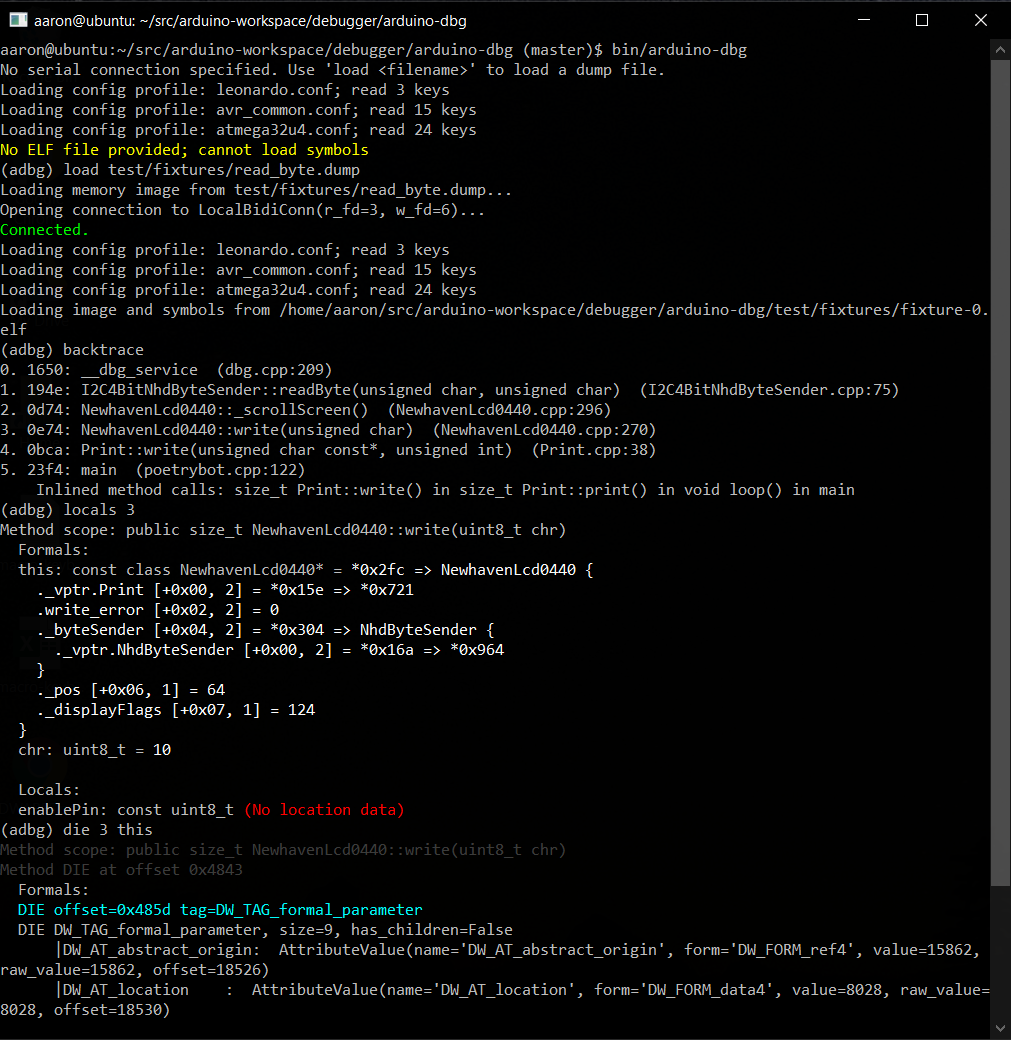
If you run the break command or press ^C within the debugger, it will pause the
running sketch so you can interrogate or set the values of variables (print someglobal),
see a backtrace, etc. Programmatic breakpoints can be selectively toggled on and off
with breakpoint enable and breakpoint disable. New breakpoints can be created from
the debugger at runtime only on platforms like the ARM Cortex-M4 which support
monitor-mode debugging. On AVR CPUs, you are restricted to breakpoints added statically
in the source code.
Within the debugger, you can save a dump of the system registers and memory with dump <filename>. With this dump file and the compiled ELF file of your sketch, you can then
perform offline debugging later with arduino-dbg -d /path/to/filename.dump, or by
running load /path/to/filename.dump within the debugger.
The dump file will retain the filename of your sketch's ELF file. If you move it to a
different location, you can open the ELF file with open /path/to/my.elf within the
debugger after running the load command.
There are several additional commands. Typing help will list available commands in the
debugger. Type help <command> to see usage information for each specific command.
Type quit, exit, or \q to quit the debugger.
You should specify what Arduino platform you are using with the set command. e.g.:
set arduino.platform = uno
The available platforms are:
feather_m4leonardouno
You can see an up-to-date list of supported Arduino platforms with the list platforms
command. The list architectures command will display supported CPU architectures.
By default the platform is auto, and the debugger will attempt to auto-detect your CPU.
You can force auto-detection with:
set arduino.platform = auto
Please open an issue if you are interested in support for additional platforms. At the time of this writing, the debugger has the ability to support AVR- and ARM-based platforms; each new cpu or platform in these families just requires a new configuration file to be added and tested.
Type set to see more configuration variables you can modify. Once set, configuration is
saved to ~/.arduino_dbg.conf and reused in future sessions. You can delete this file and
restart the debugger to reinitialize the default configuration.
This debugger can perform useful functions on any Arduino with a USB-serial connection.
The debugger service can be activated by breakpoints introduced with the BREAK() macro
or by issuing the break (^C) command within the debugger prompt.
Beyond that, for CPUs that support "monitor-mode debugging" (where debug events trigger an
IRQ which can be handled with onboard software, rather than requiring control by an
external JTAG debugger), such as the ARM SAMD51-based Cortex-M4, used in the Adafruit
Feather-M4 platform, this debugger can also take advantage of CPU-assisted debugging
features such as single-stepping with the step (\s) command, or using the ability to
create new breakpoints or watchpoints dynamically at run-time.
On such platforms, the ARM BKPT opcode will also properly enter the debugger service.
This project is licensed under the BSD 3-Clause license. See LICENSE.txt for complete details.