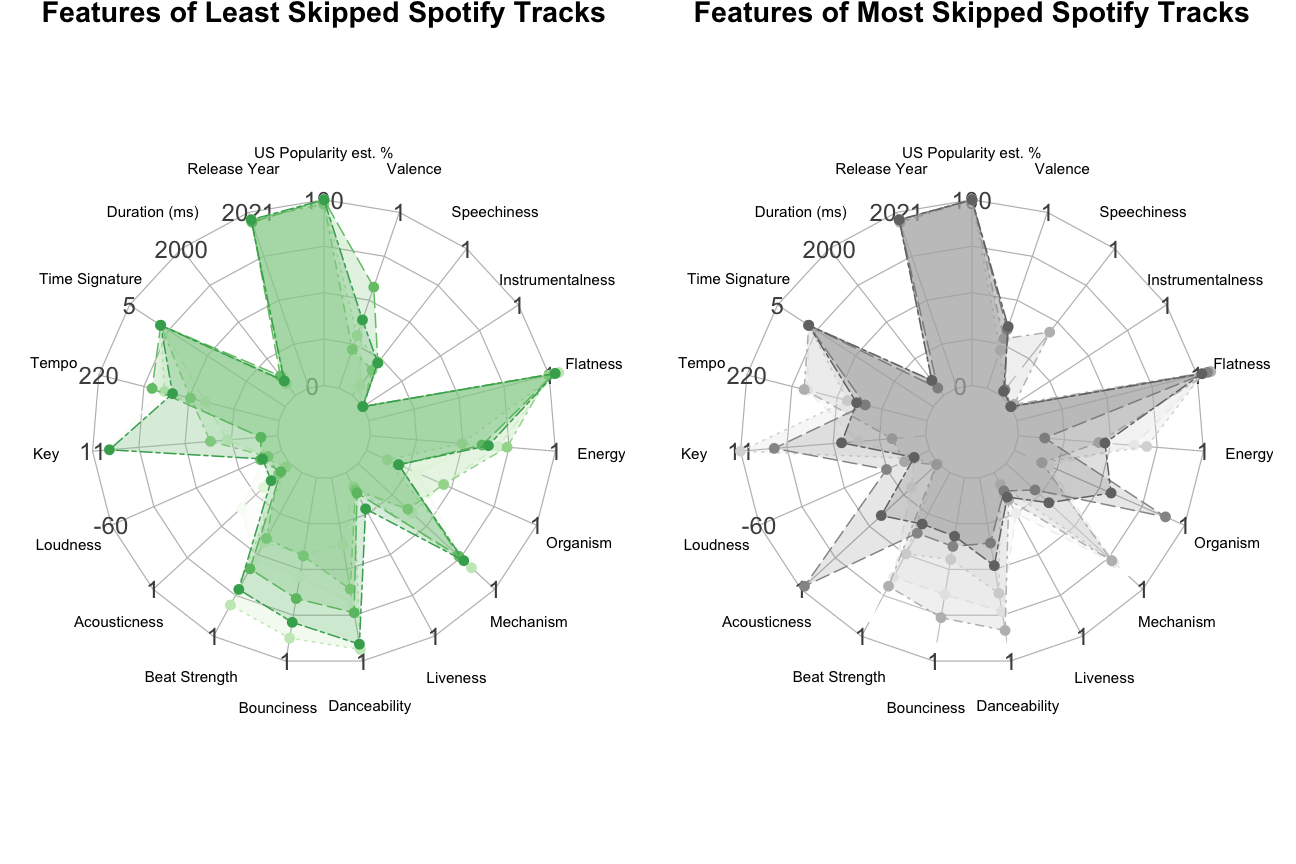
Analyzing visually how theoretically a musician might make a data driven plan to make popular music. (Please don't use this to make music!)
To see my analysis, view the R Markdown Notebook (.Rmd) or its more pleasing .html version in your browser. Here, I created this side-by-side radar plot comparison with R package fmsb.
You can also view the Shiny app deployed publicly at [Sell Out Music Listener](https://data-design-dimension.shinyapps.io/Sell-Out-Music-Listener/ https://data-design-dimension.shinyapps.io/Sell-Out-Music-Listener/), or if you'd like to run the app R script yourself with the file (Sell-Out-Music-Listener/app.R) !I am working to build interactivity into the radar chart.! So as of publishing this update it's still buggy. I've converted it to ggplot2 ggradar syntax in Shiny app interface, and am exploring using other packages and extensions for interactivity. Here in this app, I would also like to embed a Spotify web player to allow the musician to hear a playlist of recommendations/like songs generated with the least skipped tracks as input seeds.
Work in progress, with this exploratory data analysis leading to an interactive data product which would be presented to convey findings to the musician.
Developed as an assignment in MICA Data Analytics & Visualization MPS program course titled Visual Storytelling with professor Justin Elszasz. Feel free to submit comments or contribute with improvements to code if you are inclined with the time to do so. Thanks for looking!


