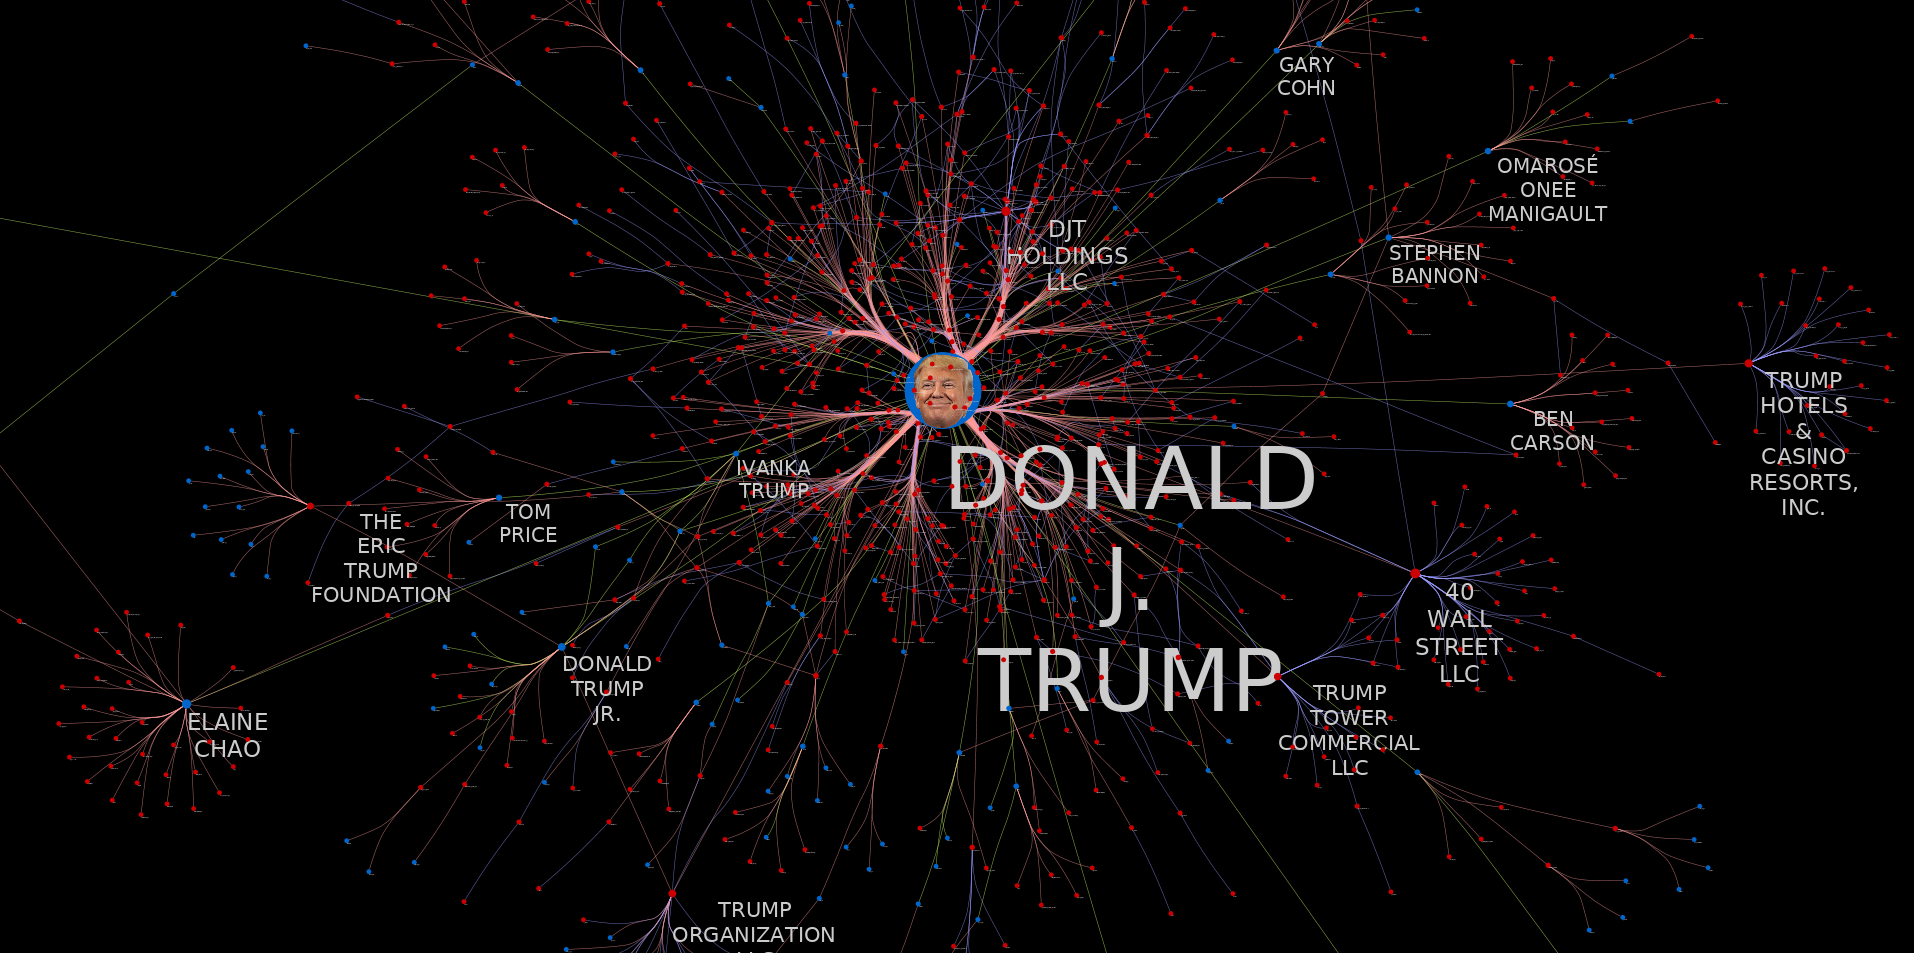
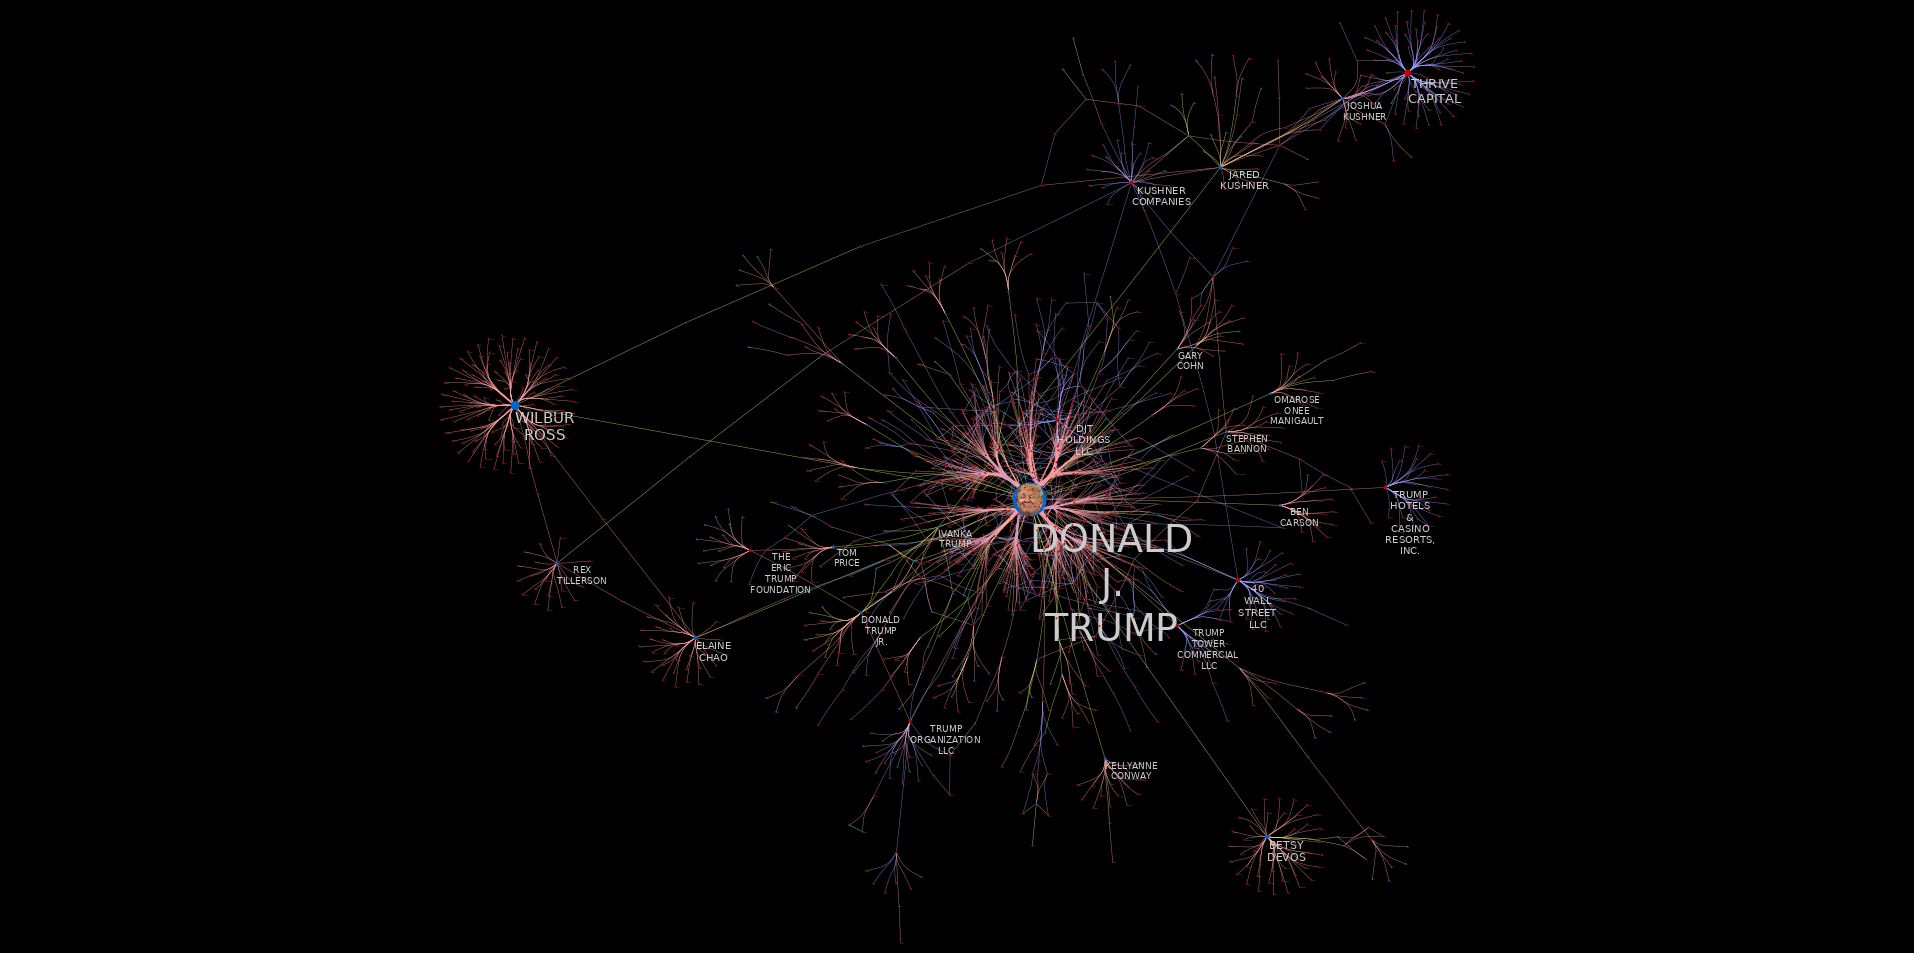
This RMarkdown document provides some simple R code for parsing the BuzzFeed TrumpWorld open dataset, and generating both an internal igraph representation of the dataset, as well as an exported GraphML network file, allowing for the easy import into external tools such as Cytoscape.
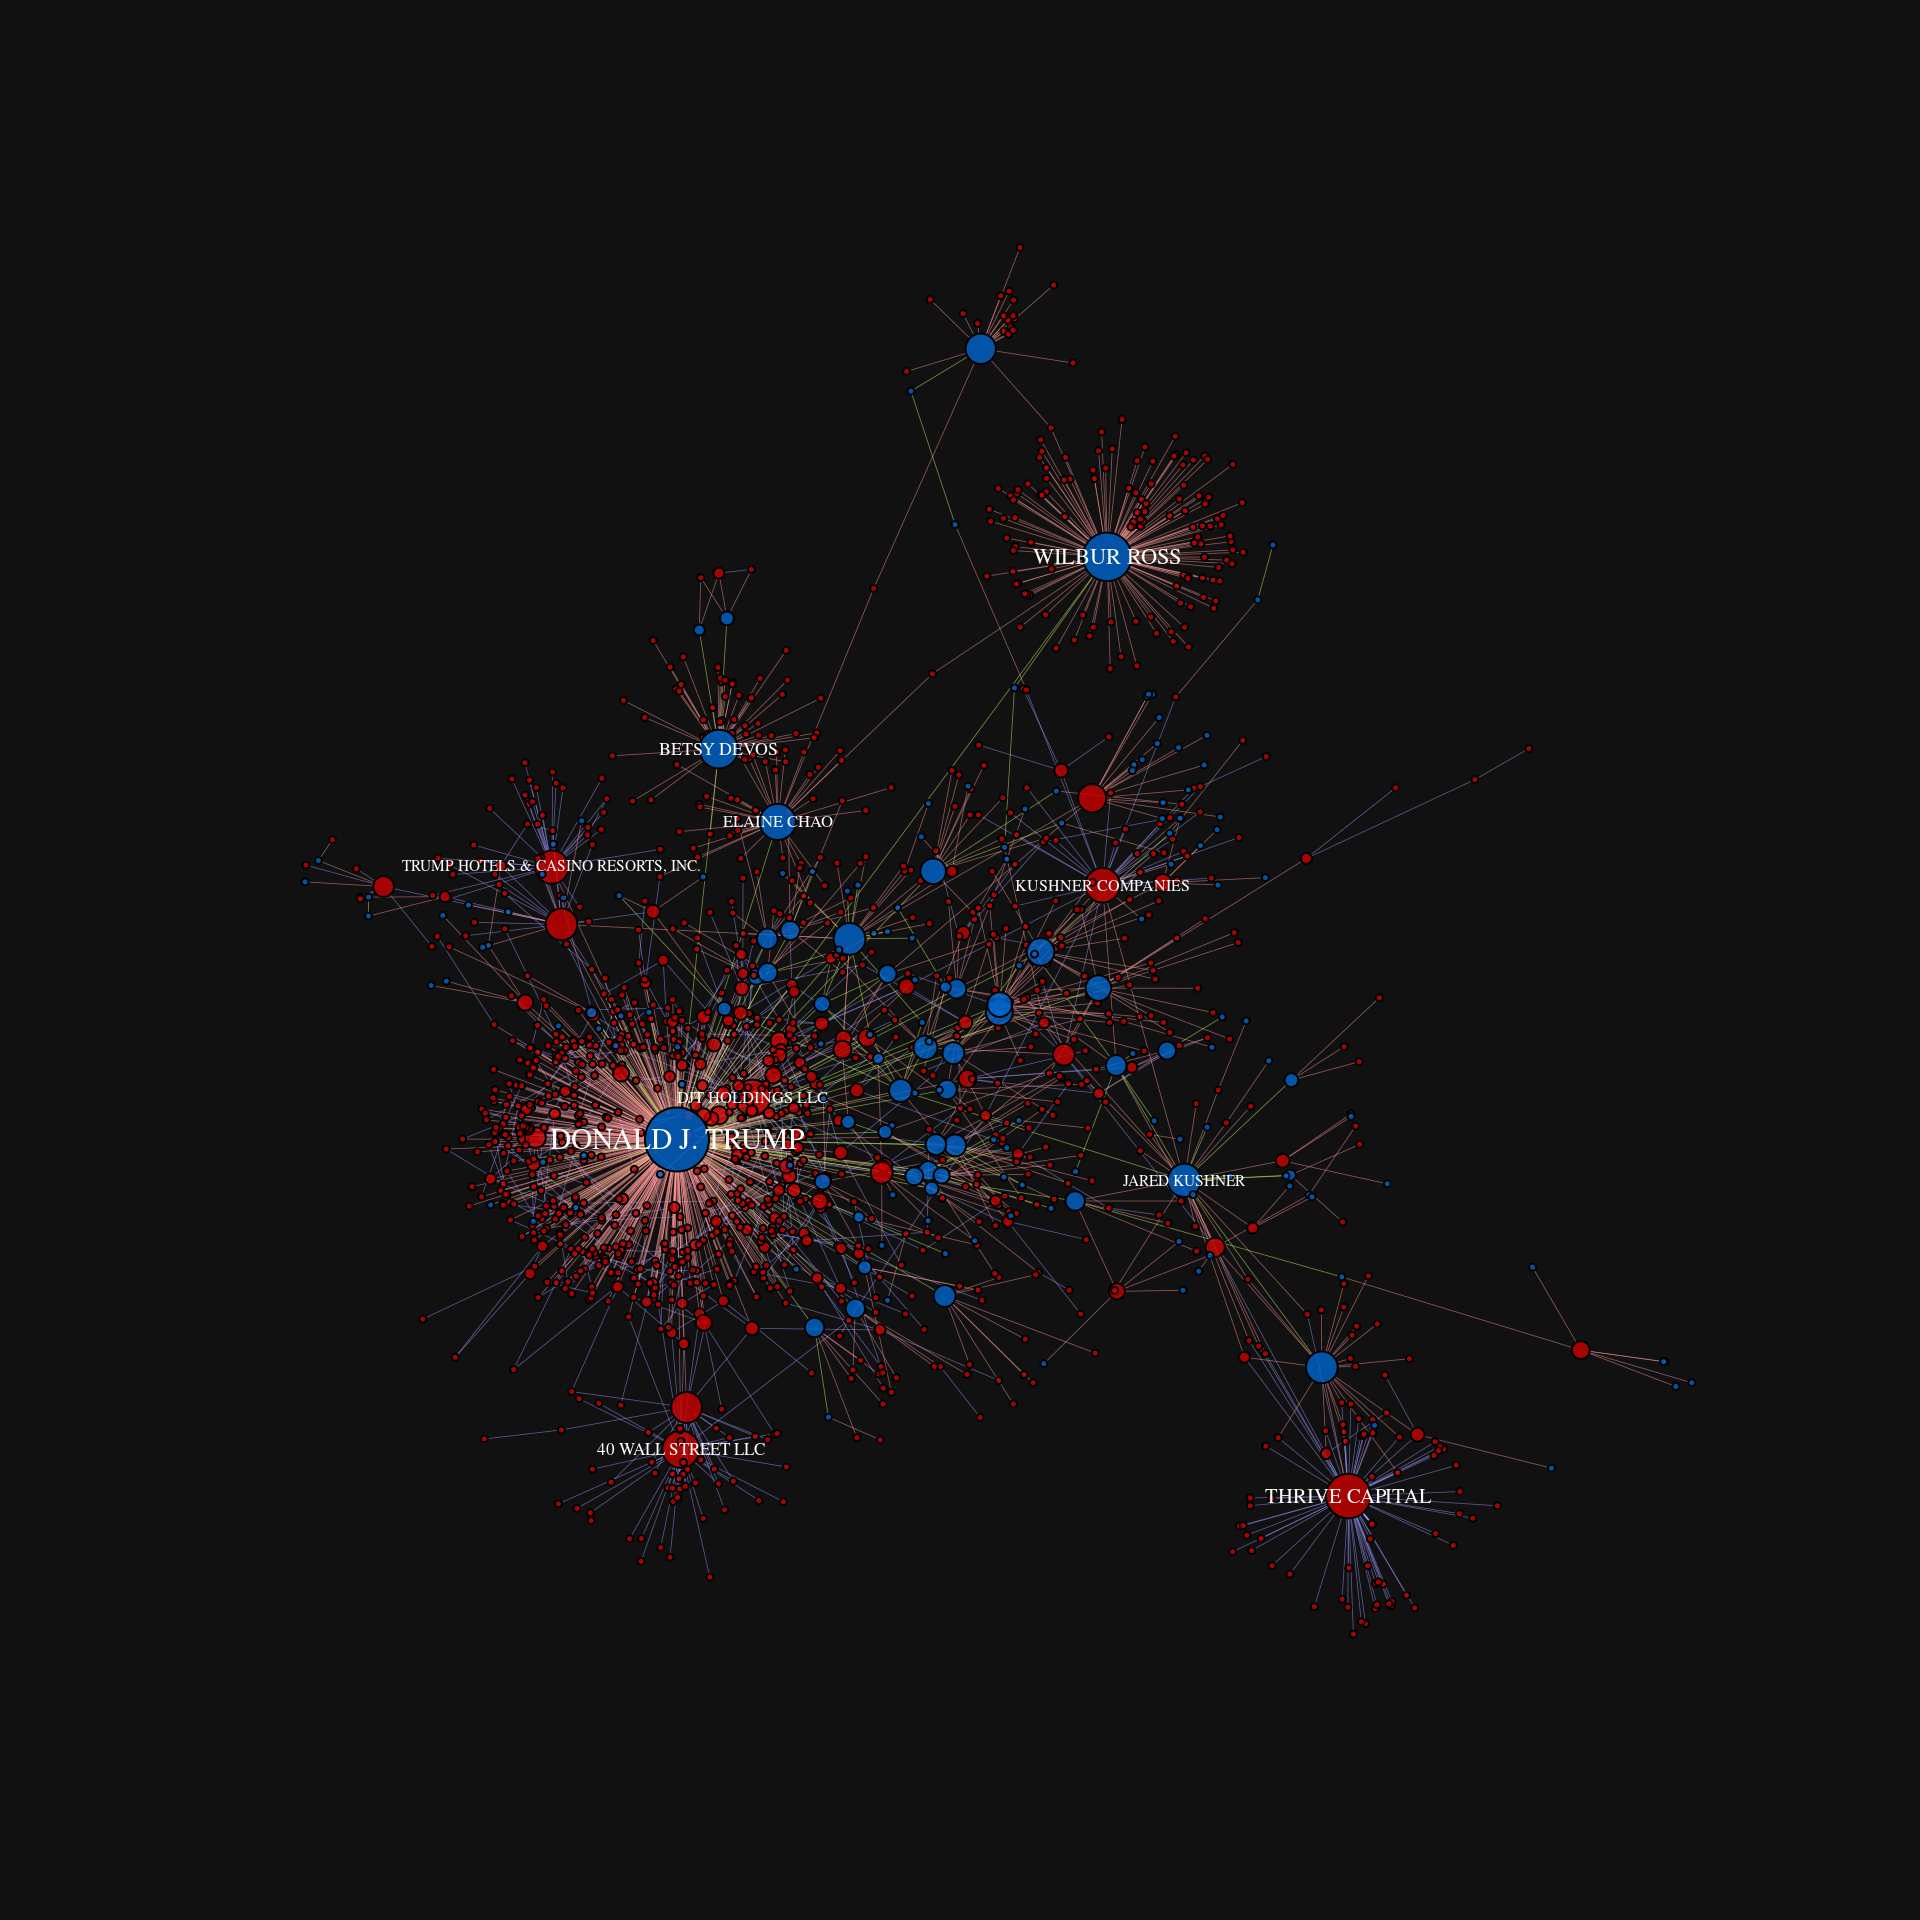
Below are a couple example visualizations created by assigning various visual properties (vertex size and color, edge color, etc.) to different data variables, as well as computed network metrics.
library('igraph')
library('knitr')

# knitr options
opts_chunk$set(fig.width=1920/192,
               fig.height=1920/192,
               dpi=192)

# igraph options
igraph.options(vertex.label.color='white',
               edge.arrow.mode='-',
               edge.width=0.4)

# behave, R
options(stringsAsFactors=FALSE)Next, in order to create a single data sheet from the three separate Google doc sheets (person-person, organization-organization, and person-organization), we will download each of the sheets, and combine them into a single dataframe, keeping track of both the node and edge types.
# load data
base_url <- "https://docs.google.com/spreadsheets/d/1Z5Vo5pbvxKJ5XpfALZXvCzW26Cl4we3OaN73K9Ae5Ss/pub?gid=%d&output=csv"

# google drive sheet identifiers
sheets <- list('org-org'=634968401, 'person-org'=1368567920,
               'person-person'=905294723)

# vectors to keep track of vertex types
orgs <- c()
people <- c()

# combine into a single dataframe, keeping track of edge and vertex types
dat <- data.frame()

for (sheet_name in names(sheets)) {
    url <- sprintf(base_url, sheets[[sheet_name]])
    sheet <- read.csv(url)
    colnames(sheet) <- c('a', 'b', 'connection', 'source')

    # vertex type
    if (sheet_name == 'org-org') {
        orgs <- unique(append(orgs, sheet$a))
        orgs <- unique(append(orgs, sheet$b))
    } else if (sheet_name == 'person-org') {
        orgs <- unique(append(orgs, sheet$a))
        people <- unique(c(people, sheet$b))
    } else {
        people <- unique(c(people, sheet$a))
        people <- unique(c(people, sheet$b))
    }

    # append to combined data frame
    dat <- rbind(dat, cbind(sheet, 'edge_type'=sheet_name))
}Now that we have a single dataframe describing each edge in the dataset, along with some additional metadata, we will create an igraph graph instance of the data frame.
# create a graph instance
g <- graph_from_data_frame(dat)

# assign vertex types
V(g)$type <- ifelse(V(g)$name %in% people, 'person', 'organization')

# only label vertices with more than 25 edges connecting to them
V(g)$label <- ifelse(degree(g) > 25, V(g)$name, NA)

# scale vertex size based on node degree
vertex_size <- pmax(1, log2(degree(g)))

# color vertices based on type (person/organization)
vertex_colors <- ifelse(V(g)$type == 'person', '#0066CCCC', '#CC0000CC')

# vertex label properties
vertex_label_cex <- vertex_size / 10

# color edges based on connection type
edge_color <- ifelse(E(g)$edge_type == 'org-org', '#9999FF88',
                     ifelse(E(g)$edge_type == 'person-person', '#CCFF6688',
                            '#FF999988'))

# assign edge weight based on edge-betweeness
E(g)$weight <- edge.betweenness(g)

# visualize the network using igraph
coords <- layout.fruchterman.reingold(g, weights=E(g)$weight)

par(bg="#111111")
plot(g,
     vertex.label=V(g)$label,
     vertex.color=vertex_colors,
     vertex.size=vertex_size,
     vertex.label.cex=vertex_label_cex,
     edge.color=edge_color,
layout=coords)Finally, let's save the network as a GraphML file. This will allow us to provide a single file including both the network topology and and node/edge metadata.
write_graph(g, file=file.path('data', 'trump_world.graphml'), format='graphml')
All done!
sessionInfo()## R version 3.3.2 (2016-10-31)
## Platform: x86_64-pc-linux-gnu (64-bit)
## Running under: Arch Linux
##
## locale:
## [1] LC_CTYPE=en_US.UTF-8 LC_NUMERIC=C
## [3] LC_TIME=en_US.UTF-8 LC_COLLATE=en_US.UTF-8
## [5] LC_MONETARY=en_US.UTF-8 LC_MESSAGES=en_US.UTF-8
## [7] LC_PAPER=en_US.UTF-8 LC_NAME=C
## [9] LC_ADDRESS=C LC_TELEPHONE=C
## [11] LC_MEASUREMENT=en_US.UTF-8 LC_IDENTIFICATION=C
##
## attached base packages:
## [1] stats graphics grDevices utils datasets methods base
##
## other attached packages:
## [1] knitr_1.15.1 igraph_1.0.1 rmarkdown_1.3 nvimcom_0.9-25
## [5] colorout_1.1-1
##
## loaded via a namespace (and not attached):
## [1] backports_1.0.4 magrittr_1.5 rprojroot_1.1 htmltools_0.3.5
## [5] tools_3.3.2 yaml_2.1.14 Rcpp_0.12.8 stringi_1.1.2
## [9] highr_0.6 stringr_1.1.0 digest_0.6.11 evaluate_0.10


