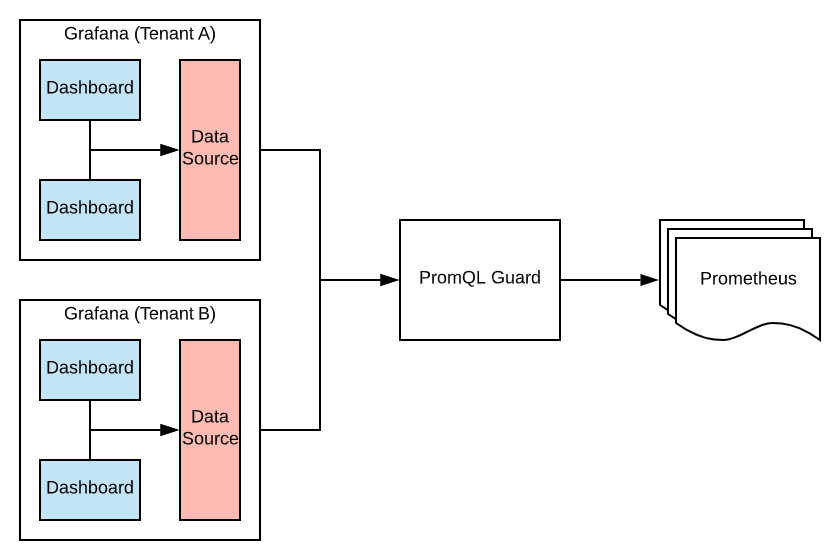
PromQL Guard provides a thin proxy on top of Prometheus, that allows us to inspect and re-write promql queries, so that a tenant can only see the data we allow, even when using a shared Prometheus server.
The original intended use case, is managing multiple Grafana instances for tenants, though there is nothing Grafana specific in the implementation.
# Example Configuration
# htpasswd is used for tenant passwords
htpasswd: guard.htpasswd

# each tenant can then be configured with required matchers
hosts:
  - username: tenantA
    prometheus:
      upstream: https://prometheus.example.com
      matcher: '{service="tenantA"}'
  - username: tenantB
    prometheus:
      upstream: https://thanos.example.com
      matcher: '{app=~"appY|appZ"}'
PromQL Guard proxies the Prometheus API, re-writing the query to restrict to a certain tenant.
Querying as the user tenantA with the query foo - bar would be re-written to foo{service="tenantA"} - bar{service="tenantA"} before being proxied to https://prometheus.example.com
Querying as the user tenantB with the query secret{app="appX} would be re-written to secret{app="appX", app=~"appY|appZ"} before being proxied to https://thanos.example.com which would result in no metrics being returned.
Direct access to the upstream Prometheus servers should be controled by other access means such as network access control or firewall. The Grafana Admin can register promql-guard as a Prometheus datasource and then be reasonably sure that tenants with Viewers and Editors roles can freely edit dashboards and query metrics without viewing other tenants data.
