pbi-dataops-monitoring
Templates for monitoring Power BI components and related Power Platform elements for your data analytics projects.
Table of Contents
- Introduction
- Prerequisites
- Installation
- Monitoring Power Automate Flows
- Exceptions with unscheduled Power BI Datasets
- Azure DevOps Pipeline Monitoring - Add On
Introduction
Embracing the DataOps principle "Monitor Quality and Performance", this repository provides a set of templates and instructions for monitoring your Power BI solution/projects. If you're an administrator of a workspace or multiple workspaces you should be monitoring your datasets and/or dataflows. In addition, you may leverage Power Automate to schedule refreshes, deliver reports, move data between environments, or use the Power Automate visual in Power BI. All these components are crucial to your solution working and relying on email alone can be problematic due to alert fatigure or incorrect settings for how email notifications are sent.
The Power BI templates in this repository help you monitor for issues such as:
Power BI Issues
- Unresolved Failed Dataset Refreshes - If the latest dataset refresh has failed this template identifies the issue.
- Unscheduled Dataset Refresh - If a dataset fails multiple times then the schedule refresh is disabled. This can lead to latent data and this template highlights this issue.
- Long-running dataset refreshs - If a dataset is taking longer than two hours to run this is generally a concern and should be investigated.
- Unresolved Failed Dataflows Refreshes - If the latest dataflow has failed this template identifies the issue.
- Number of Data Quality Issue Tables within Dataset - If the dataset has hidden tables that start with "Errors in", this template identifies the issue. This indicates existing or prior cell-level errors that need to be resolved (and tables deleted).
Power Automate Issues
- Unresolved Failure with Scheduled Power Automate Flows - If the latest schedule flow in Power Automate fails this template identifies the issue.
- Failed Manually Triggered Power Automate Flows in past 72 hours - If manually triggered flows (often through Power Automate visuals) fail this template highlights this issue.
Prerequisites
To help automate checks of the issues, the templates use two open-source customer connectors.
Commercial Tenant
Please follow the instructions for the following connectors:
Power Query Custom Data Connector for Power BI REST APIs
Power Query Custom Data Connector for Power Automate REST APIs
Government Community Cloud (GCC) Tenant
Please follow the instructions for the following connectors:
Power Query Custom Data Connector for Power BI REST APIs
Power Query Custom Data Connector for Power Automate REST APIs
On-Premises Gateway
The custom data connectors will need to be installed in the a Power BI Gateway in order to refresh the monitoring template in the Power BI Service. For more information on installing a custom data connector with a gateway please see: https://learn.microsoft.com/en-us/power-bi/connect-data/service-gateway-custom-connectors.
Installation
-
Download the appropriate .pbit file from the latest Release section.
-
Open the .pbit template.
-
You will see a prompt as shown in the Figure 1
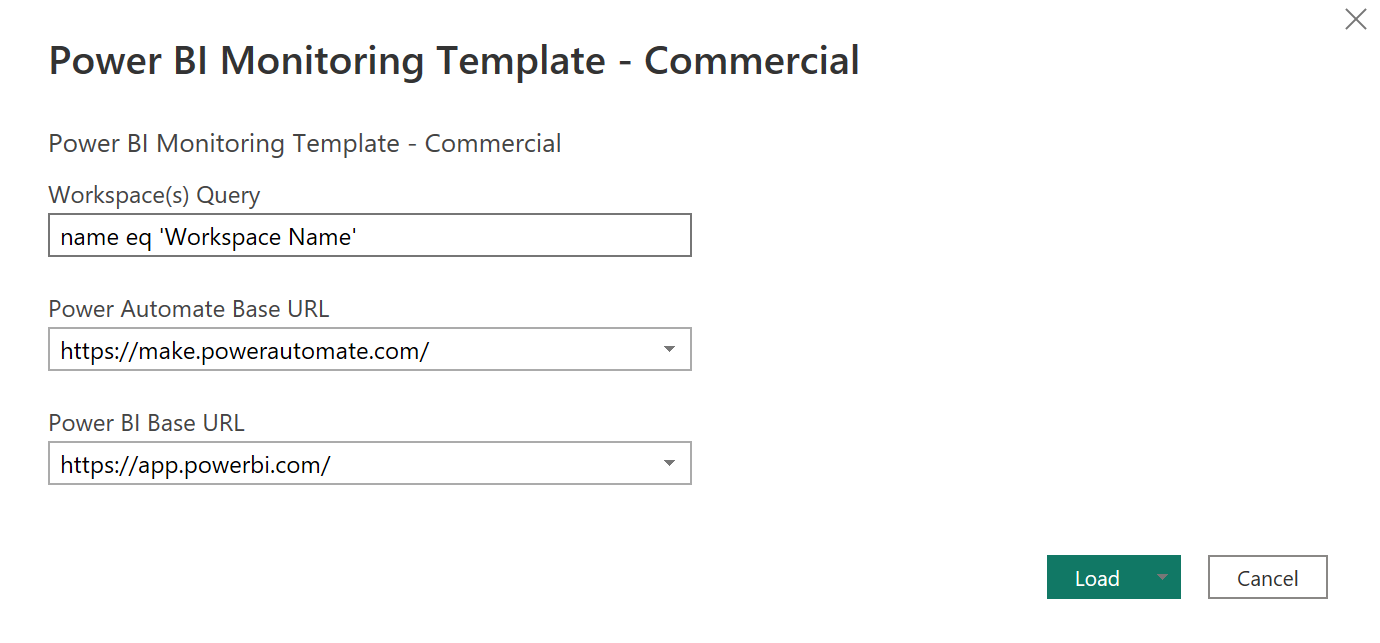 Figure 1 - Example of Template Prompt
- In the field "Workspace(s) Query" enter the OData query that identifies the workspace or workspaces you wish to monitor.
For example if the workspace you wish to monitor is named 'Test1' you will enter "name eq 'Test1'".
For another example if the workspaces you wish to monitor are named 'Test1' and 'Test2' you will enter "name eq 'Test1' or name eq 'Test2'".
- Select the "Load" button. If this is your first time using the custom data connectors you will be prompted to sign into Office 365. Please follow the instructions to sign in and then choose the "Connect" button.
- and the template will load.
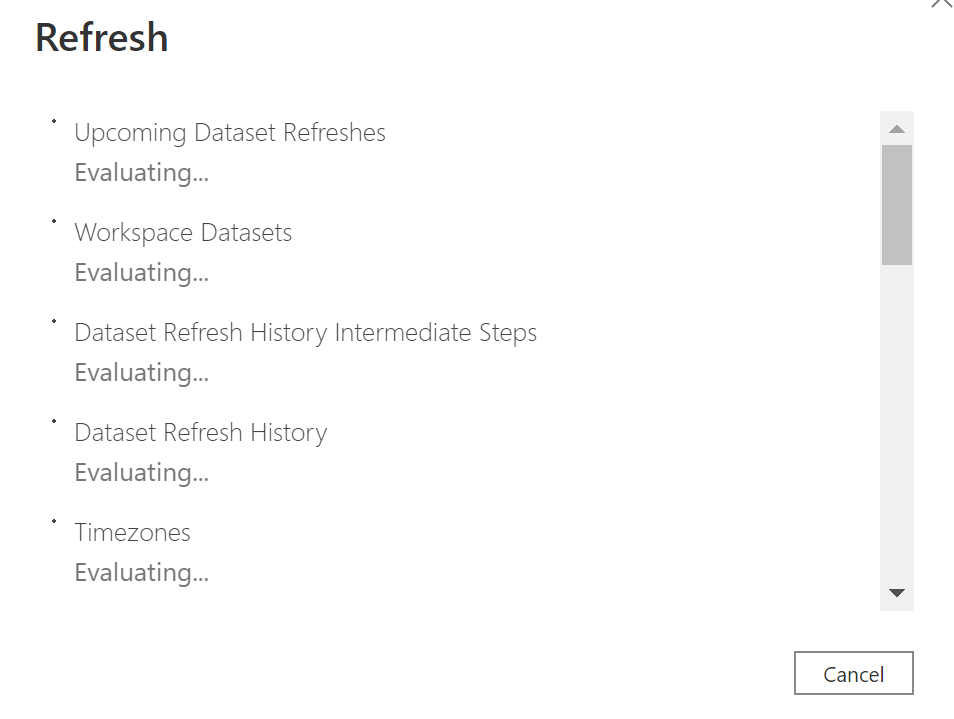 Figure 3 - Example of Refresh In Progress
6. When completed you should see the Home tab of the monitoring report.
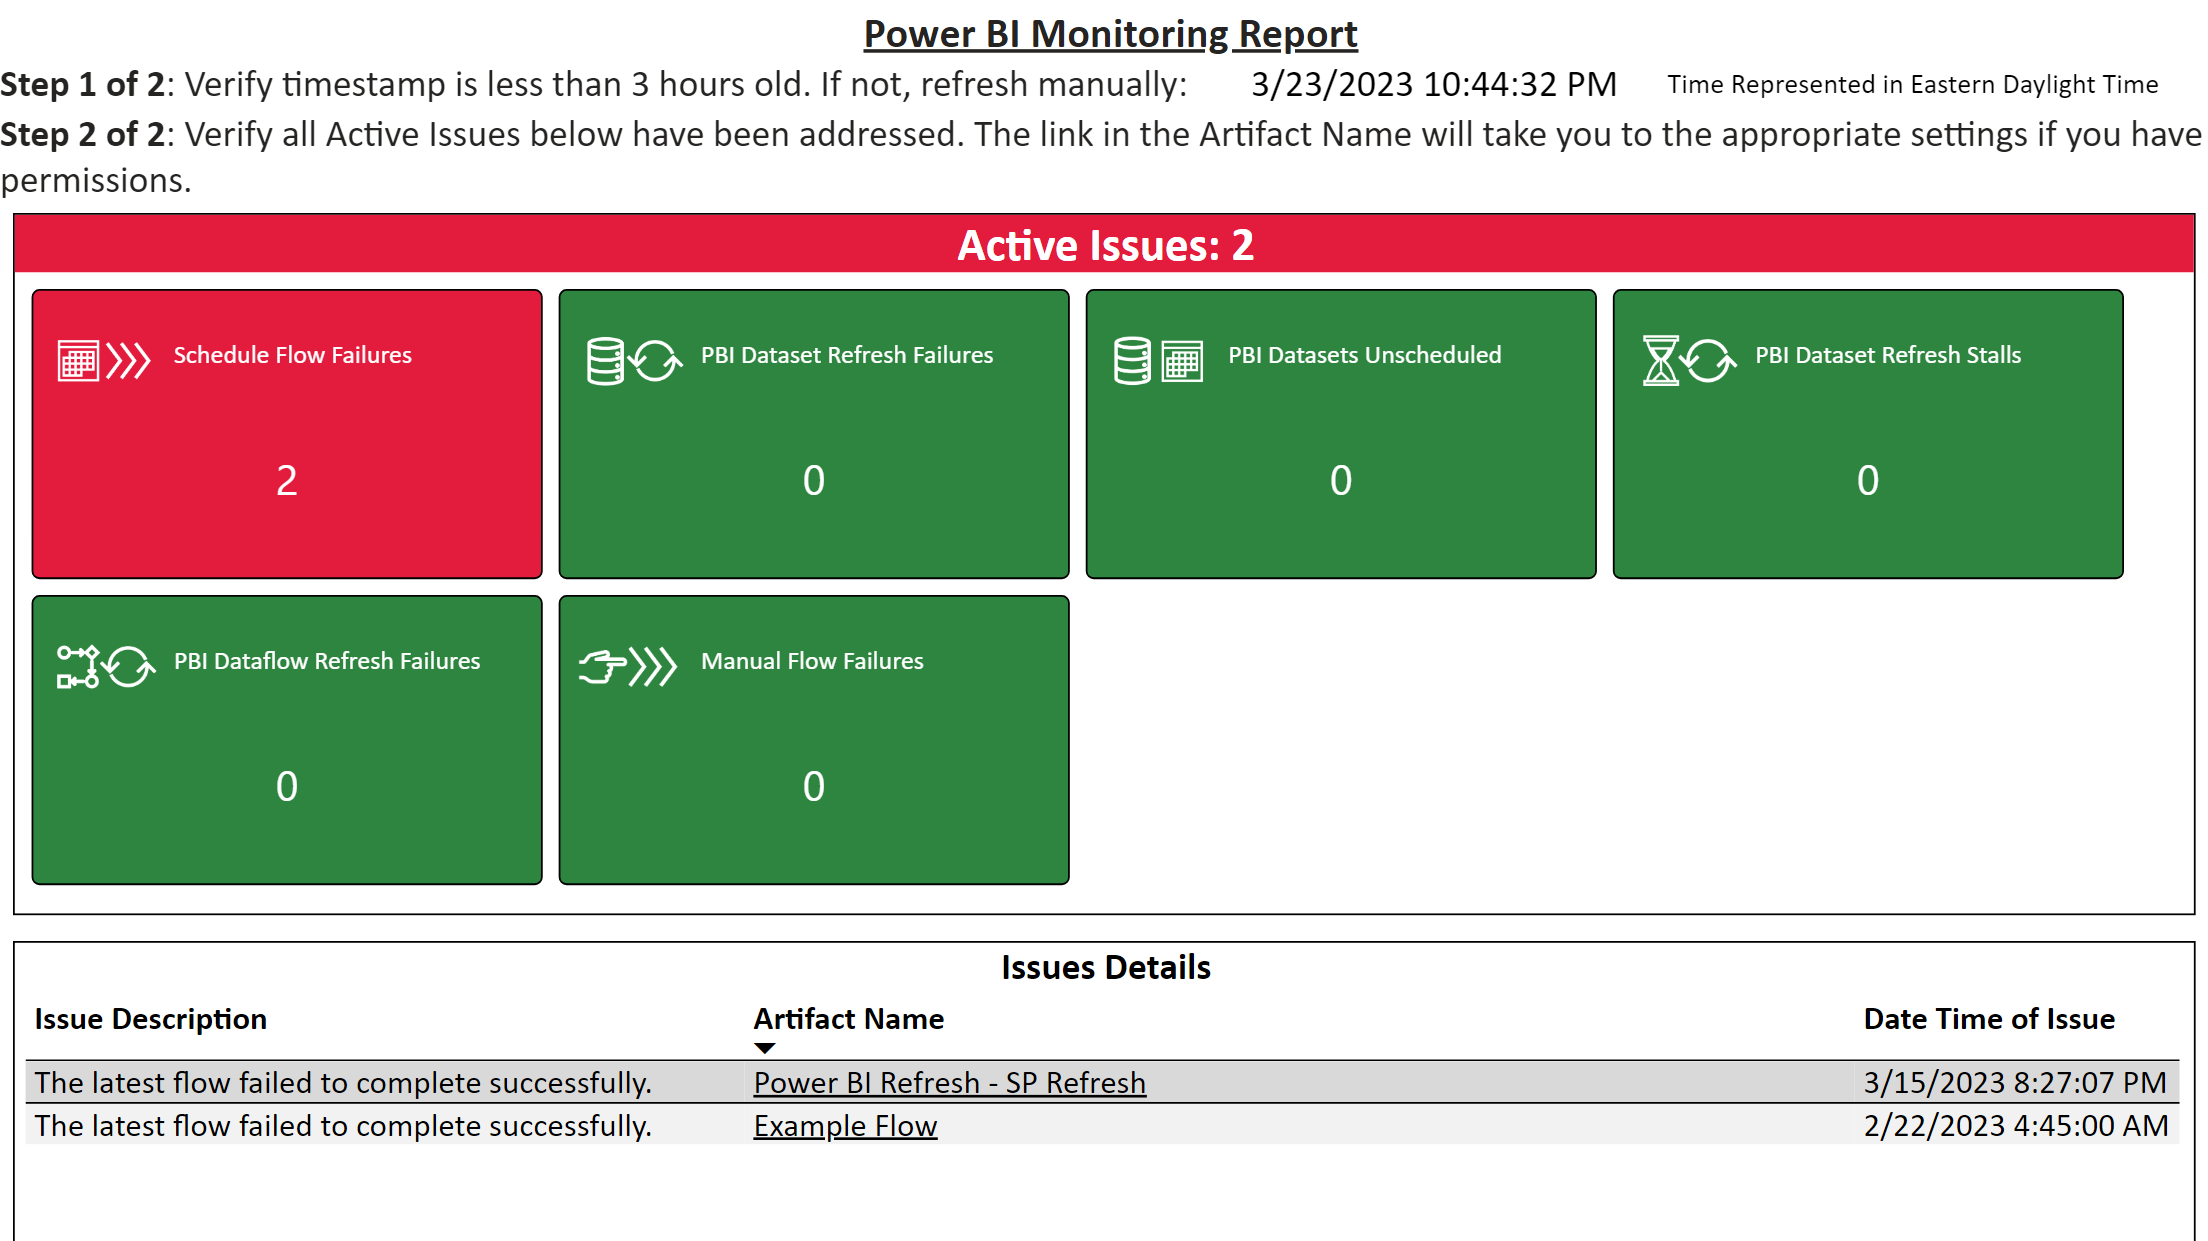 Figure 4 - Example of Power BI Monitoring Report
- Please save this file. If you do not have a gateway installed, you will need to refresh this file locally to pull the latest information.
Monitoring Power Automate Flows
Since the connector uses the OAuth of the logged in accountto get the Power Automate flows, it's possible that you do not want to monitor all the Power Automate flows that are retrieved by the template. To specify the Power Automate flows you wish to monitor, within the template follow these steps:
-
Open Power Query.
-
Navigate to the table "Power Automate Flows".
-
Filter the "Name" and specify with flows you wish to monitor.
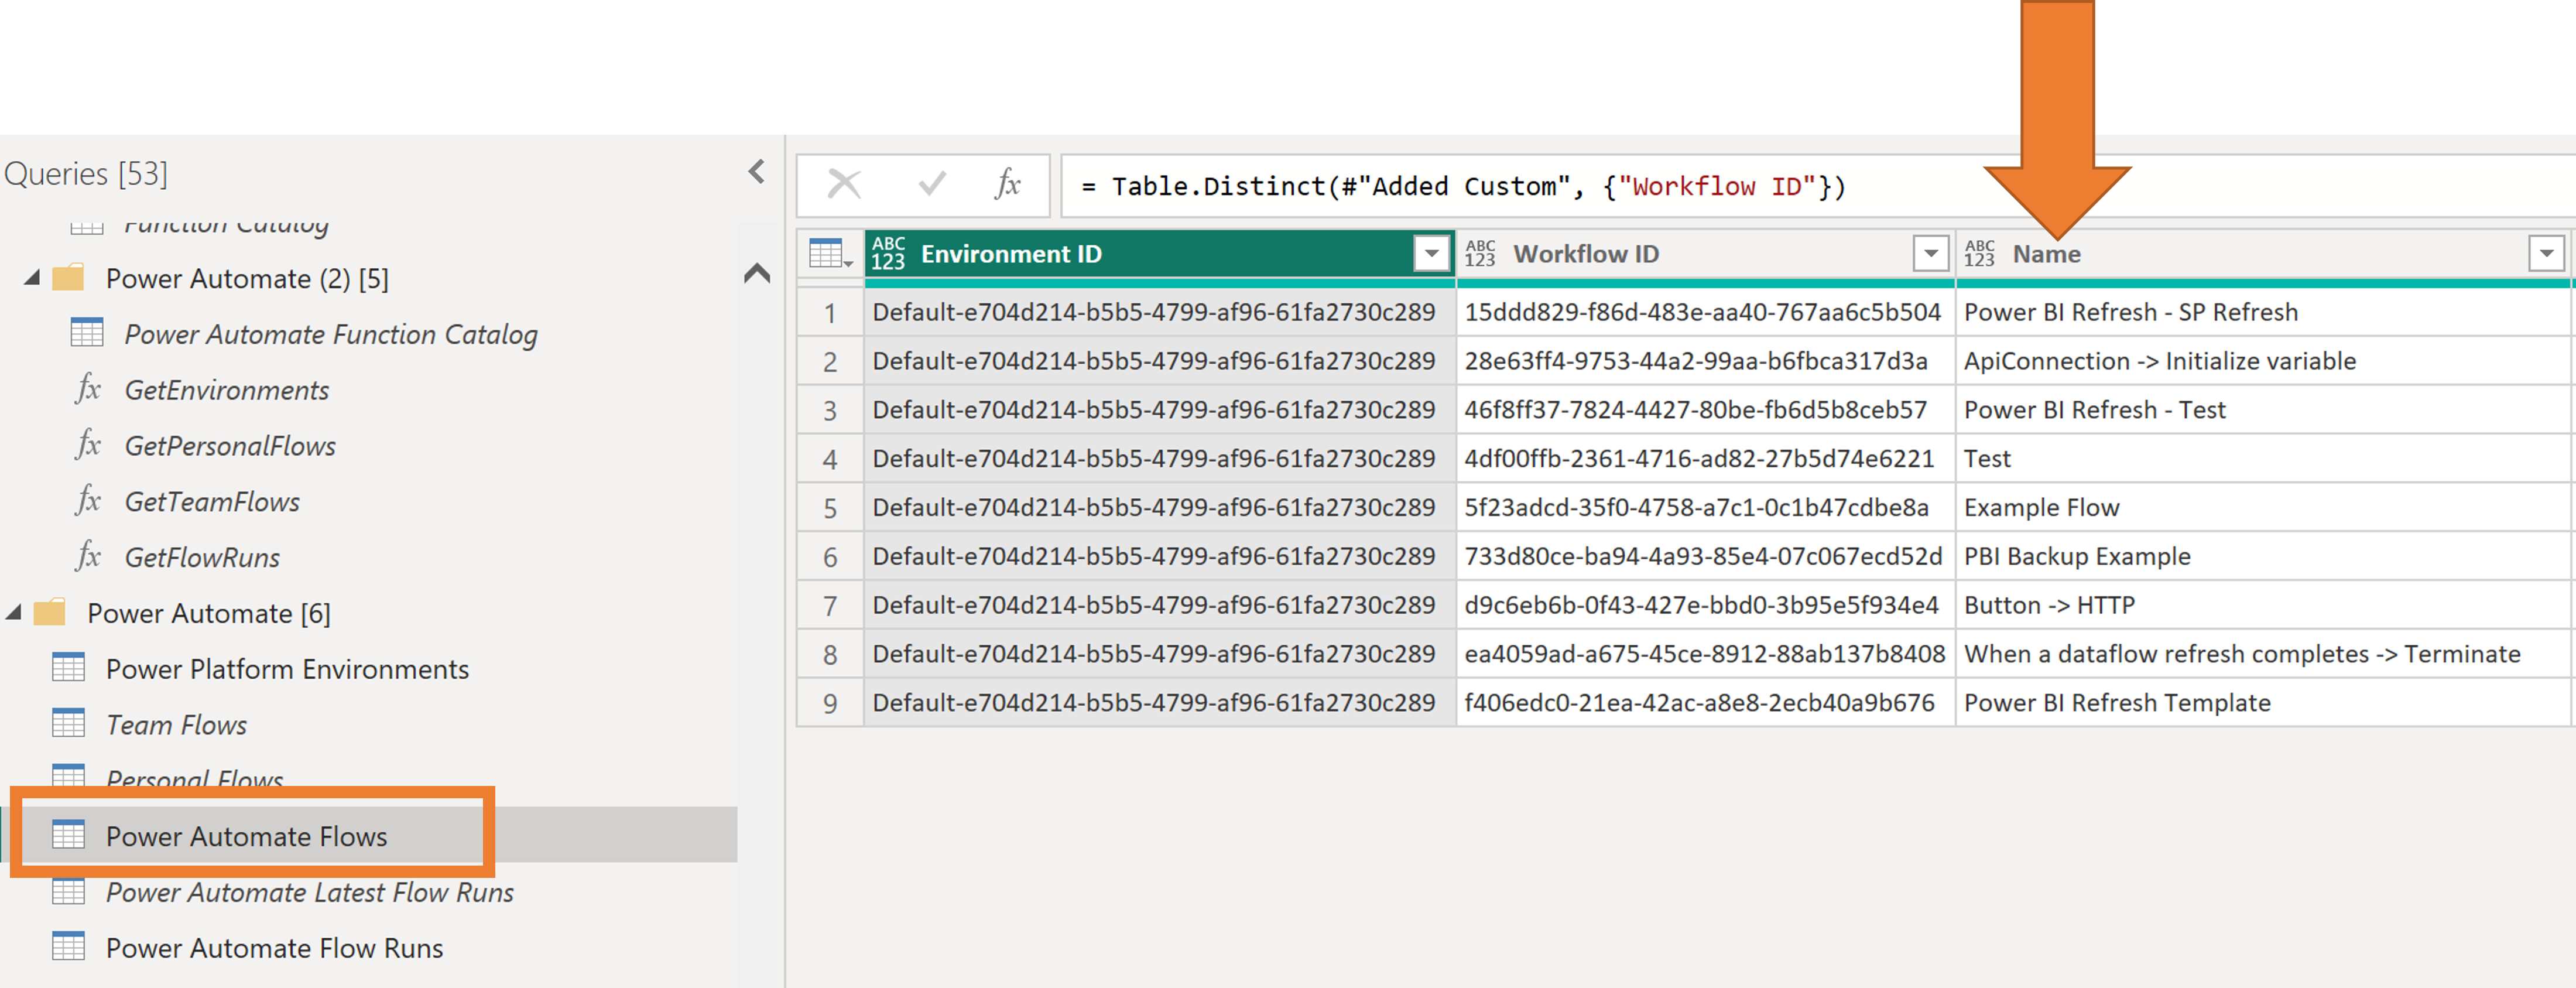 Figure 5 - Screenshot of where to filter the Power Automate flows that you wish to monitor.
Exceptions with unscheduled Power BI Datasets
If there are datasets that do not require an automated refresh scheduled with the Power BI Dataset settings, you can add those datasets to an exception list. Within the template, please follow these steps:
-
Open Power Query.
-
Navigate to the table "Refresh Exception List"
-
Within the "Query Settings" pane, click the cog icon next to the "Source" step.
 Figure 6 - Screenshot of where to add/update datasets on the refresh exception list.
- Add/Update the names of the datasets you wish to have an exception. When complete, click the "OK" button. Please note the name of the dataset must match exactly the name in the Power BI service.
