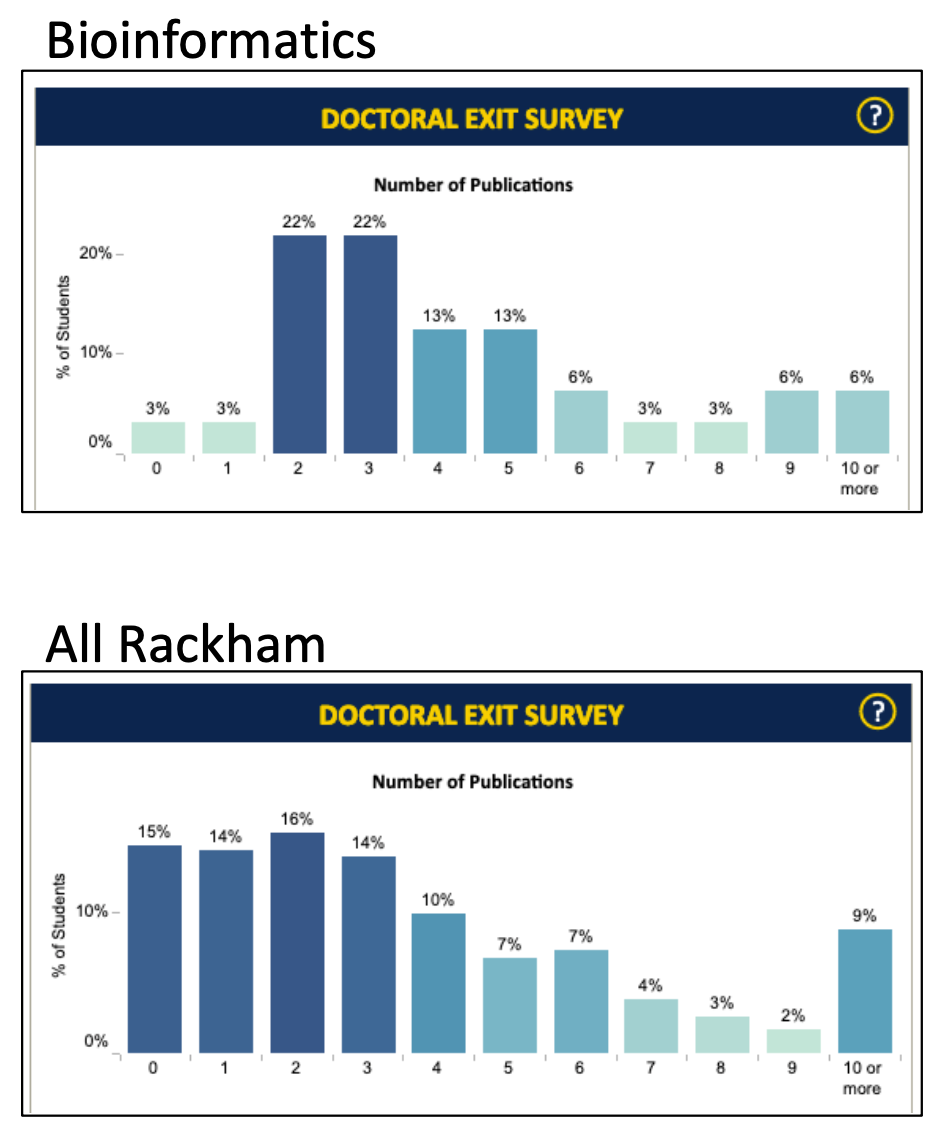
2021-06-09
library(tidyverse)
dat <- tribble(
  ~npubs, ~Bioinf, ~`All of Rackham`,
  0, 3, 15,
  1, 3, 14,
  2, 22, 16,
  3, 22, 14,
  4, 13, 10,
  5, 13, 7,
  6, 6, 7,
  7, 3, 4,
  8, 3, 3,
  9, 6, 2,
  10, 6, 9
) %>%
  pivot_longer(c(Bioinf, `All of Rackham`),
               names_to = "Program", values_to = "percent")
head(dat)
## # A tibble: 6 x 3
## npubs Program percent
## <dbl> <chr> <dbl>
## 1 0 Bioinf 3
## 2 0 All of Rackham 15
## 3 1 Bioinf 3
## 4 1 All of Rackham 14
## 5 2 Bioinf 22
## 6 2 All of Rackham 16
micolors <- c('#FFCB05', '#00274C')
add_layers <- function() {
  list(
    scale_fill_manual(values = micolors),
    labs(y = "", x = "", title = "Number of Publications"),
    theme_classic(),
    theme(legend.position = c(0.8, 0.9))
  )
}
dat %>%
ggplot(aes(npubs, percent, fill = Program)) +
geom_bar(stat = 'identity', position = 'dodge') +
add_layers() +
scale_x_continuous(breaks = 0:10, labels = c(0:9, "10+")) +
ylab('% of students')dat %>%
ggplot(aes(Program, npubs, weight = percent,
fill = Program, color = Program)) +
geom_boxplot() +
add_layers() +
scale_color_manual(values = c('#00274C', '#989C97')) +
scale_y_continuous(breaks = 0:10, labels = c(0:9, "10+")) +
theme(legend.position = 'none')## Warning in rq.fit.br(wx, wy, tau = tau, ...): Solution may be nonunique
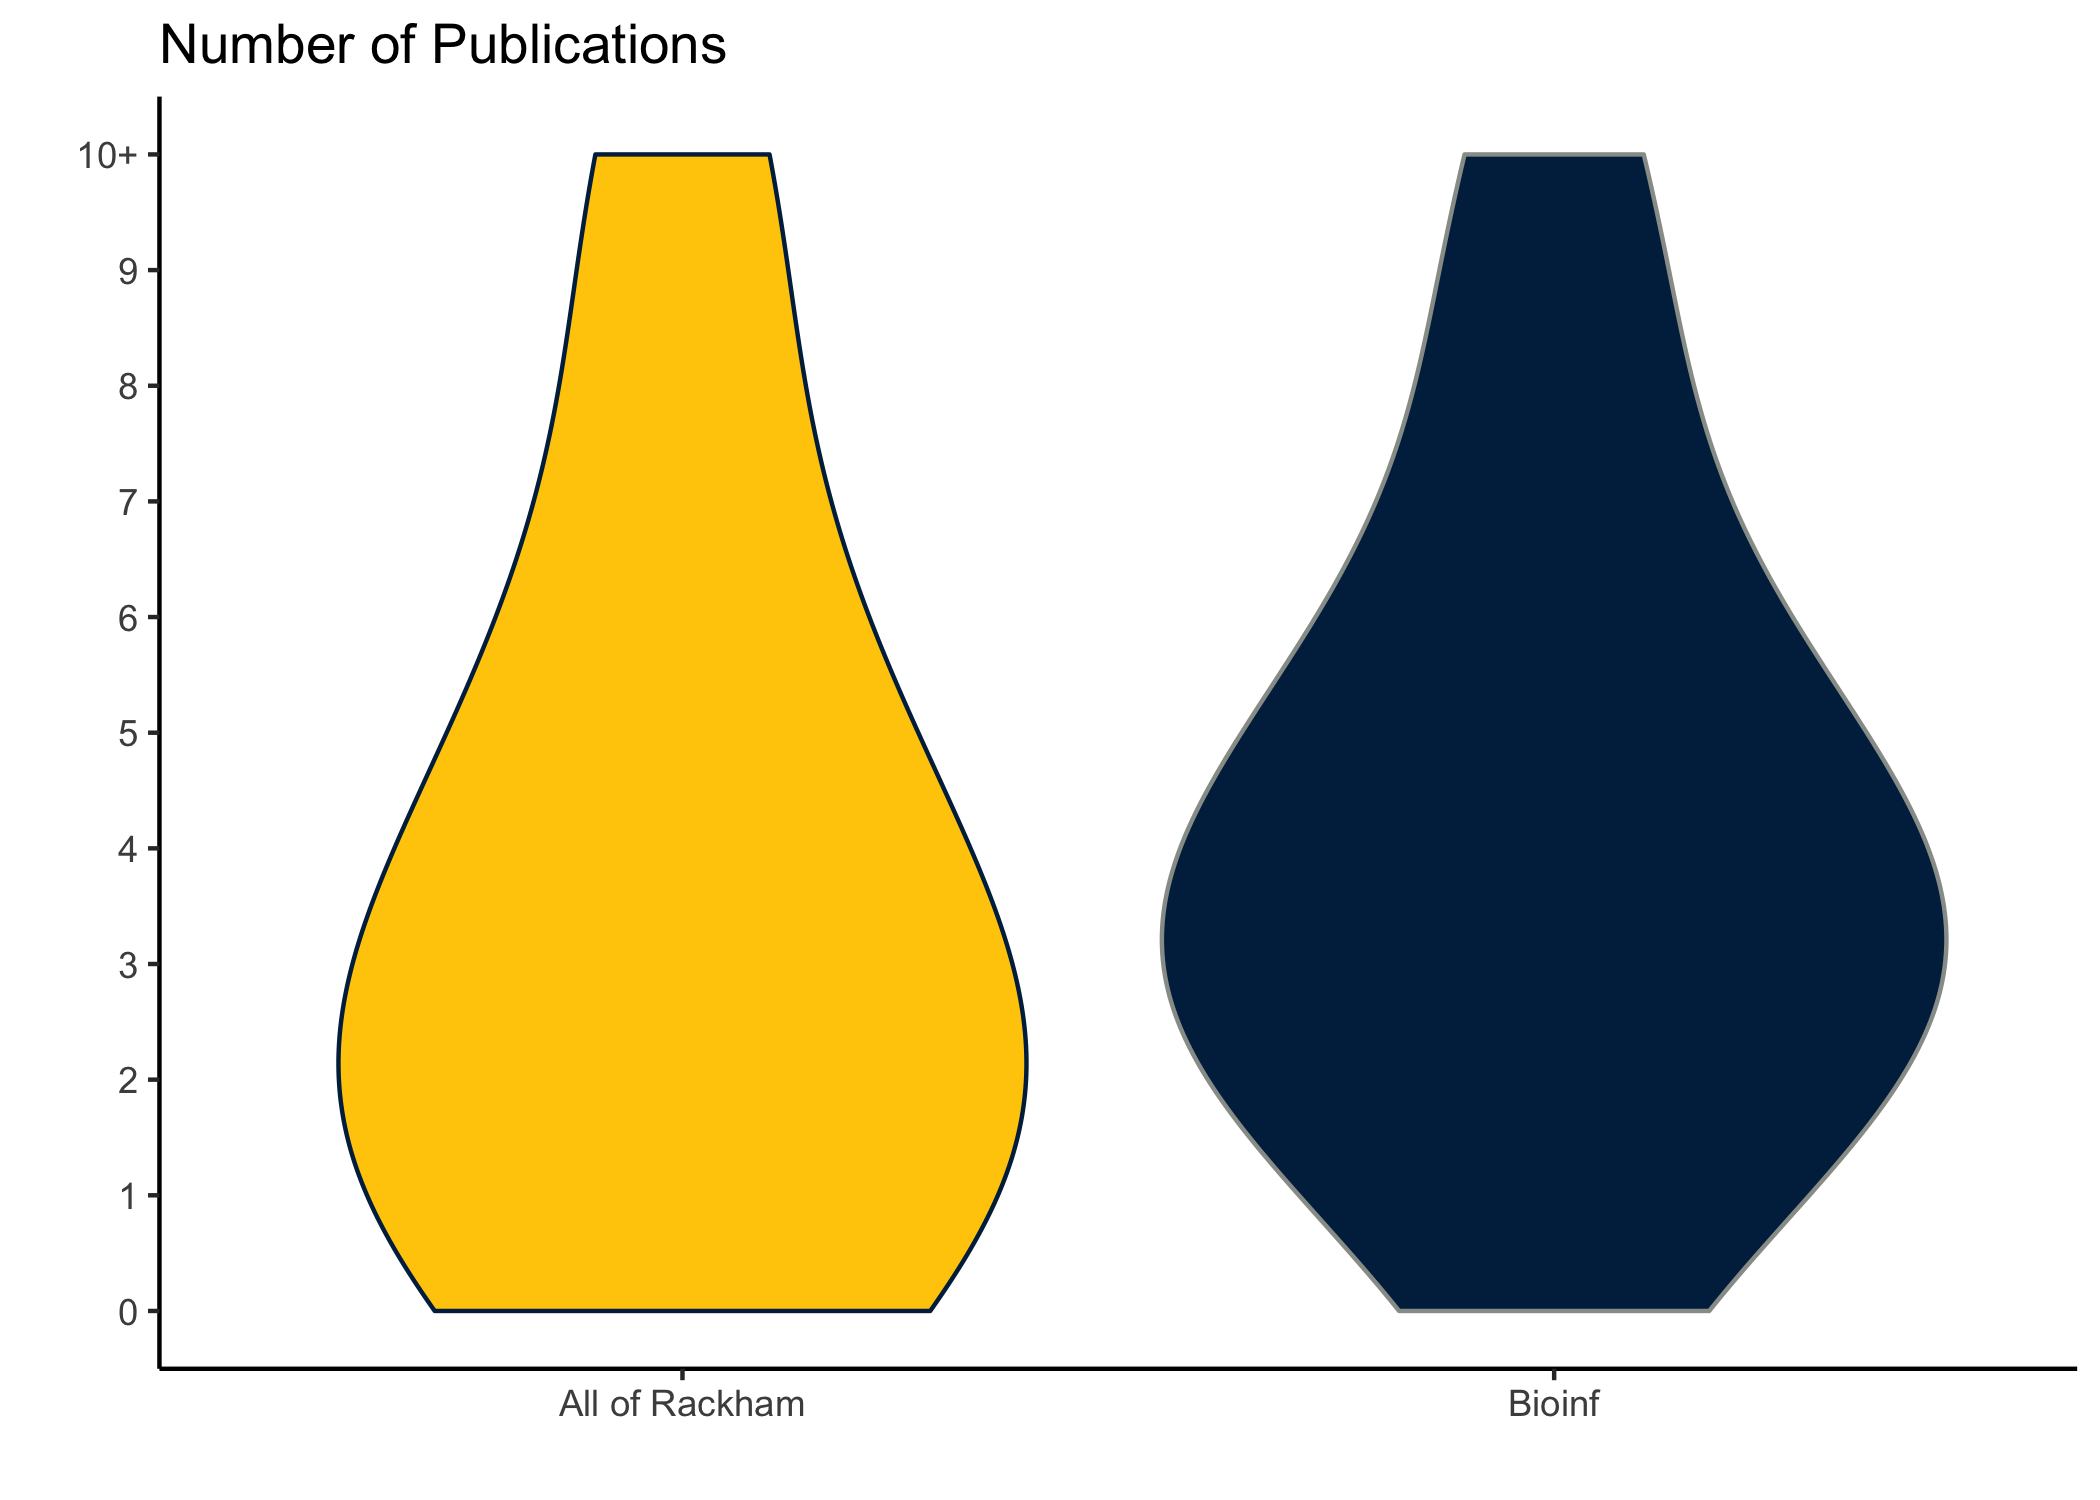
dat %>%
  ggplot(aes(Program, npubs, weight = percent,
             fill = Program, color = Program)) +
  geom_violin() +
  add_layers() +
  scale_color_manual(values = c('#00274C', '#989C97')) +
  scale_y_continuous(breaks = 0:10, labels = c(0:9, "10+")) +
  theme(legend.position = 'none')


